Built for
Instruments: Stock/Futures
Trading Style: Scalping/Day Trading
Playbook Overview
This strategy is based on understanding how the market behaves like an auction each day. By analyzing the previous day’s price action and recognizing where the price found value (the auction area), you can anticipate directional moves during the next session.
It follows a top-down approach: the daily chart sets the directional bias, while the 5-minute chart is used for execution. Trades are only taken when both timeframes align in the same direction, using tools like moving averages and price structure to define the edge.
The key setup occurs when price returns to the auction zone and rejects it in the direction of the trend, often during the first hour of the session, when volume and volatility are highest. This strategy emphasizes market sentiment, structure, and simplicity.
While it’s mainly used for stocks, the same principles can be applied to indices and crypto, any market with a strong intraday range and clear price behavior. It’s clean, rule-based, and designed to keep traders on the right side of the market.
Playbook Rules
Timeframes
- Daily chart: Sets directional bias.
- 5-minute chart: Execution timeframe.
- Both timeframes must show a trend in the same direction (down for shorts, up for longs).
Trend Alignment
Use moving average (e.g., 21/50 MAs ) only to confirm trend direction.
- For longs: The price must be above the moving averages in both timeframes.
- For shorts: The price must be below the moving averages in both timeframes.
- MAs are used to visually confirm alignment, not as trade signals.
Directional Bias
Determined by the previous day’s daily candle. If the prior day closed strongly bearish, the next day’s bias is short. If bullish, the bias is long.
Auction Zone
- Look for zones of congestion (value area) on the 5-min chart where price previously consolidated or found balance.
- Price returning to this zone provides a potential setup if it rejects the area in the direction of the trend.
Open and Gap Context
- At the open, identify:
- Are we gapping up or down?
- Are we opening inside or outside of the previous day’s range?
- This adds important context to the auction and sentiment.
Wait for Alignment
- The daily chart must show a clear 45-degree trend.
- 5-minute chart must mirror the daily trend and be aligned with the moving average direction.
- Avoid setups where the daily and intraday charts are conflicting.
Entry
- Enter when price retests the auction zone and shows a rejection candle.
- Entry is made immediately after candle confirmation.
Stop Loss
- Place the stop loss just beyond the structure's high/low of the setup candle.
- For shorts, above the rejection candle high.
- For longs, below the rejection candle low.
Target
- Use a minimum 2:1 risk-to-reward ratio.
Time of Day
- Focus on the first hour after the open.
- Avoid trading in the middle or late session unless conditions clearly align.
No Trade Conditions
- If the daily and 5-minute trades are not aligned, skip the trade.
- If the auction structure is messy or sentiment is unclear (e.g., conflicting news headlines), stay out.
- If price does not retest the auction zone or quickly sells off at the open without structure, skip.

Pros and Cons of the Strategy
This model is designed to deliver high-quality, repeatable setups — but like any trading method, there are key things to understand before using it.
Note: The cons listed here aren’t disadvantages. They are things to be aware of — important characteristics that require patience, discipline, and proper management to make the playbook work effectively.
Pros
- Simple and rule-based: Easy to follow with clear trend and zone criteria.
- Rule-based: Removes emotion and overthinking.
- Specific Time Window: Focused on the first hour of the trading session.
- Trading with trend: Always aligned with higher timeframe direction.
- Fractal – HTF Alignment: Strategy works across timeframes (e.g., monthly → daily, daily → 5-min).
Cons(Things to Be Aware Of and Manage)
- Limited R/R: Most trades target 2:1; doesn’t allow big R-multiples unless modified.
- Courage required: You must trust the setup and act quickly.
- Patience needed: Many days will have no trade if the criteria aren’t met.
- Must be a good loser: High composure is needed to accept losses without hesitation.
- Speed: Execution must be fast — trades often trigger in seconds after the open.
Trade Breakdown
- Daily Bias: SPY was in a clear downtrend on the daily chart, with price trading below the 21 EMA.
- SPY opened with a gap down, opening below the previous day’s close. This added to the bearish sentiment, suggesting sellers remained in control from the prior session.

Auction Zone
- On the 5-minute chart, price formed a clean consolidation area after the open.
- This zone became the auction zone — a place where short-term buyers and sellers had found a temporary balance.
- SPY broke down from this zone shortly after it formed, confirming trend continuation.
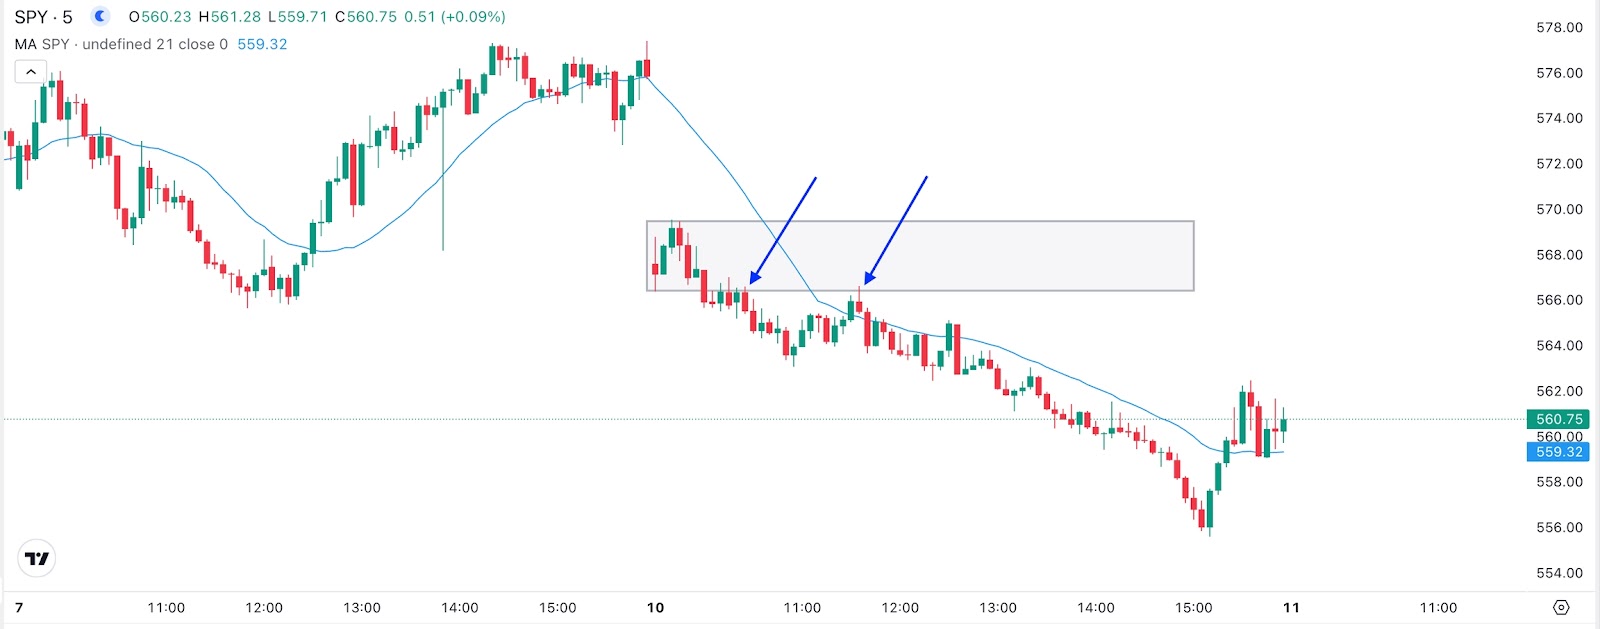
First Trade – First Retest
After SPY dropped out of the early range, it came back up to the same area (the auction zone). At that point, the trend was still clearly down, and the price was still below the 21 EMA.
When the price reached the zone again, it made a clear rejection candle — it went into the zone but then closed below it.
- Entry: A short trade was taken as soon as that candle closed.
- Stop Loss: Placed just above the high of that candle.
- Target: A 2:1 reward compared to the risk.
Second Trade – Second Retest
If you missed the first trade, SPY gave another opportunity:
Later on, the price went back up to the same zone a second time but failed again to break through. It made another rejection candle, just like before, showing that sellers were still in control.
- Entry: Another short trade was taken after this second rejection candle closed.
- Stop Loss: Place just above the height of this new candle.
- Target: Same 2:1 reward was hit again as the price dropped once more.