Order Flow Secrets: How to Catch Explosive Moves Using Order Flow
Order Flow Secrets: How to Catch Explosive Moves Using Order Flow
Explosive market moves aren’t random — they come from imbalances in the auction between buyers and sellers. By studying order flow, traders can spot setups like absorption, exhaustion, breakouts, and rejections, and use tools such as tape reading, footprint charts, and DOM heatmaps to confirm entries. When context, key zones, flow, and volume align, traders can build high-probability setups with strong risk-to-reward.
Disclaimer: The content in this video is for educational and informational purposes only. It does not constitute financial advice, investment advice, or a recommendation to trade any specific strategy or security. Trading involves significant risk and may not be suitable for all investors. Always do your own research and due diligence before making any financial decisions. TradeZella and its affiliates are not liable for any losses incurred from trading decisions based on this content. Past performance is not indicative of future results.
class SampleComponent extends React.Component {
  // using the experimental public class field syntax below. We can also attach
  // the contextType to the current class
  static contextType = ColorContext;
  render() {
    return <Button color={this.color} />
  }
}
Last Updated: June 10, 2026
Order flow trading is the practice of reading real-time buying and selling pressure, the interaction between aggressive market orders and passive limit orders, to anticipate explosive directional moves before they appear on a standard chart.
Markets often spend time moving sideways in balance, only to suddenly explode into powerful directional trends. If you’ve ever wondered why these explosive moves happen and, more importantly, how to catch them, order flow is the key.
In this breakdown, we’ll explore:
Why explosive moves occur in markets and the auction theory behind them
The role of market events, technical levels, and price discovery
The interaction between limit orders and market order
Four core order-flow setups: absorption, exhaustion, breakout, and rejection
The tools you need to read order flow (tape, footprint, DOM/heatmaps)
How to combine context, zones, flow, and volume into an A+ trade framework
Real-world case studies
Why explosive moves occur in markets and the auction theory behind them
Markets move because buyers and sellers are constantly negotiating on price. At the core, it works just like an auction. Buyers call out the prices they are willing to pay, and sellers do the same for the prices they want. Most of the time, the market finds a fair zone in the middle where most trades happen.
If you looked at this activity on a chart, it would look a lot like a bell curve. The middle of the curve is where most of the trading takes place and where the price feels “fair” to both sides. The extremes, on the other hand, are where price usually gets rejected because there isn’t much agreement.
Explosive moves happen when this balance breaks down. Instead of buyers and sellers being evenly matched, one side completely takes control. Aggressive buyers might keep lifting prices higher, or aggressive sellers might keep pushing prices lower. When that happens, the market quickly moves away from its old fair zone and starts searching for a new one.
For traders, this imbalance is what creates those fast, powerful moves on the chart. Once one side wins the auction, price often runs in that direction, and that’s where the best trading opportunities appear.
Key triggers of imbalance
Explosive moves in the market don’t appear out of nowhere. They usually begin when the balance between buyers and sellers is shaken by a clear trigger. The most common triggers are major market events, key technical and liquidity levels, and periods of price discovery.
Market Events
Macroeconomic reports (CPI, jobs data, FOMC) for indices like SPY.
Earnings, product launches, CEO news for individual stocks.
These events reset sentiment, revalue assets, and spark price discovery
Technical Levels & Liquidity Zones
Market maker levels: Option strikes or gamma exposures (e.g., 6500 on an index) where dealers defend against losses.
Institutional zones: Big round numbers where funds accumulate in size (e.g., Tesla at 300). Institutions defend these zones aggressively.
Price Discovery
At all-time highs/lows, there are no references. Price explores freely until heavy bids/offers appear.
These discovery phases often produce the most explosive runs.
Order Types: The Fuel Behind the Moves
Every trade in the market comes from two basic types of orders: limit orders and market orders.
Limit orders are passive. These are bids or offers placed at specific prices, waiting to be filled. For example, a trader might set a buy limit at $100 and only get filled if the price drops there.
Market orders are aggressive. They say, “Fill me right now at the best available price,” no matter where that is.
Explosive moves happen when aggressive market orders push through the passive order sitting in the order book. If buyers keep hitting the offers with size, they can blow through all the sell orders at a level and drive the price higher. If sellers smash the bids, they can push the price lower in a hurry.
This tug-of-war between passive and aggressive orders is the core of order flow trading. By watching how these two forces interact at key levels, traders can spot the moments when balance is breaking and a strong move is about to begin.
The Four Core Order-Flow Setups
When you look at order flow, explosive moves usually form in a few common ways. These setups come from how market orders and limit orders interact at important levels.
Absorption
Absorption happens when strong buy orders are waiting at a level and take in all the selling pressure. Sellers keep hitting the bids, but the price doesn’t drop because buyers are quietly filling everything. Once the selling dries up, the price often bounces and moves higher.
Exhaustion
Exhaustion is the opposite. Buyers try to push the price up, but big sell orders keep holding the line. Price fails again and again to break through. When buyers finally give up, sellers step in and the price turns lower.
Breakout
A breakout happens when aggressive market orders are strong enough to push through all the resting orders at a level. Once that level is cleared, the price can move quickly in one direction. Traders often look for a pullback after the breakout to join the move with less risk.
Rejection
Rejection is when the price touches a level and instantly turns away. For example, price hits a wall of sell orders and is pushed back down right away. Unlike exhaustion, which takes time, rejection is fast and sharp — like the market touching a hot stove.
These four patterns are the foundation of order flow trading. They show who is winning the battle at key levels and help traders spot when a strong move is about to happen.
Tools for Reading Order Flow
To spot explosive moves, you need the right tools to see how buyers and sellers are interacting in real time. Here are the main ones to use:
Tape Reading (Level 2 + Time & Sales)
The tape shows bids, offers, and trades as they happen. By watching the speed, size, and clustering of orders, you can sense when aggressive buying or selling is building. Fast, heavy prints on one side often signal that a strong move is starting.
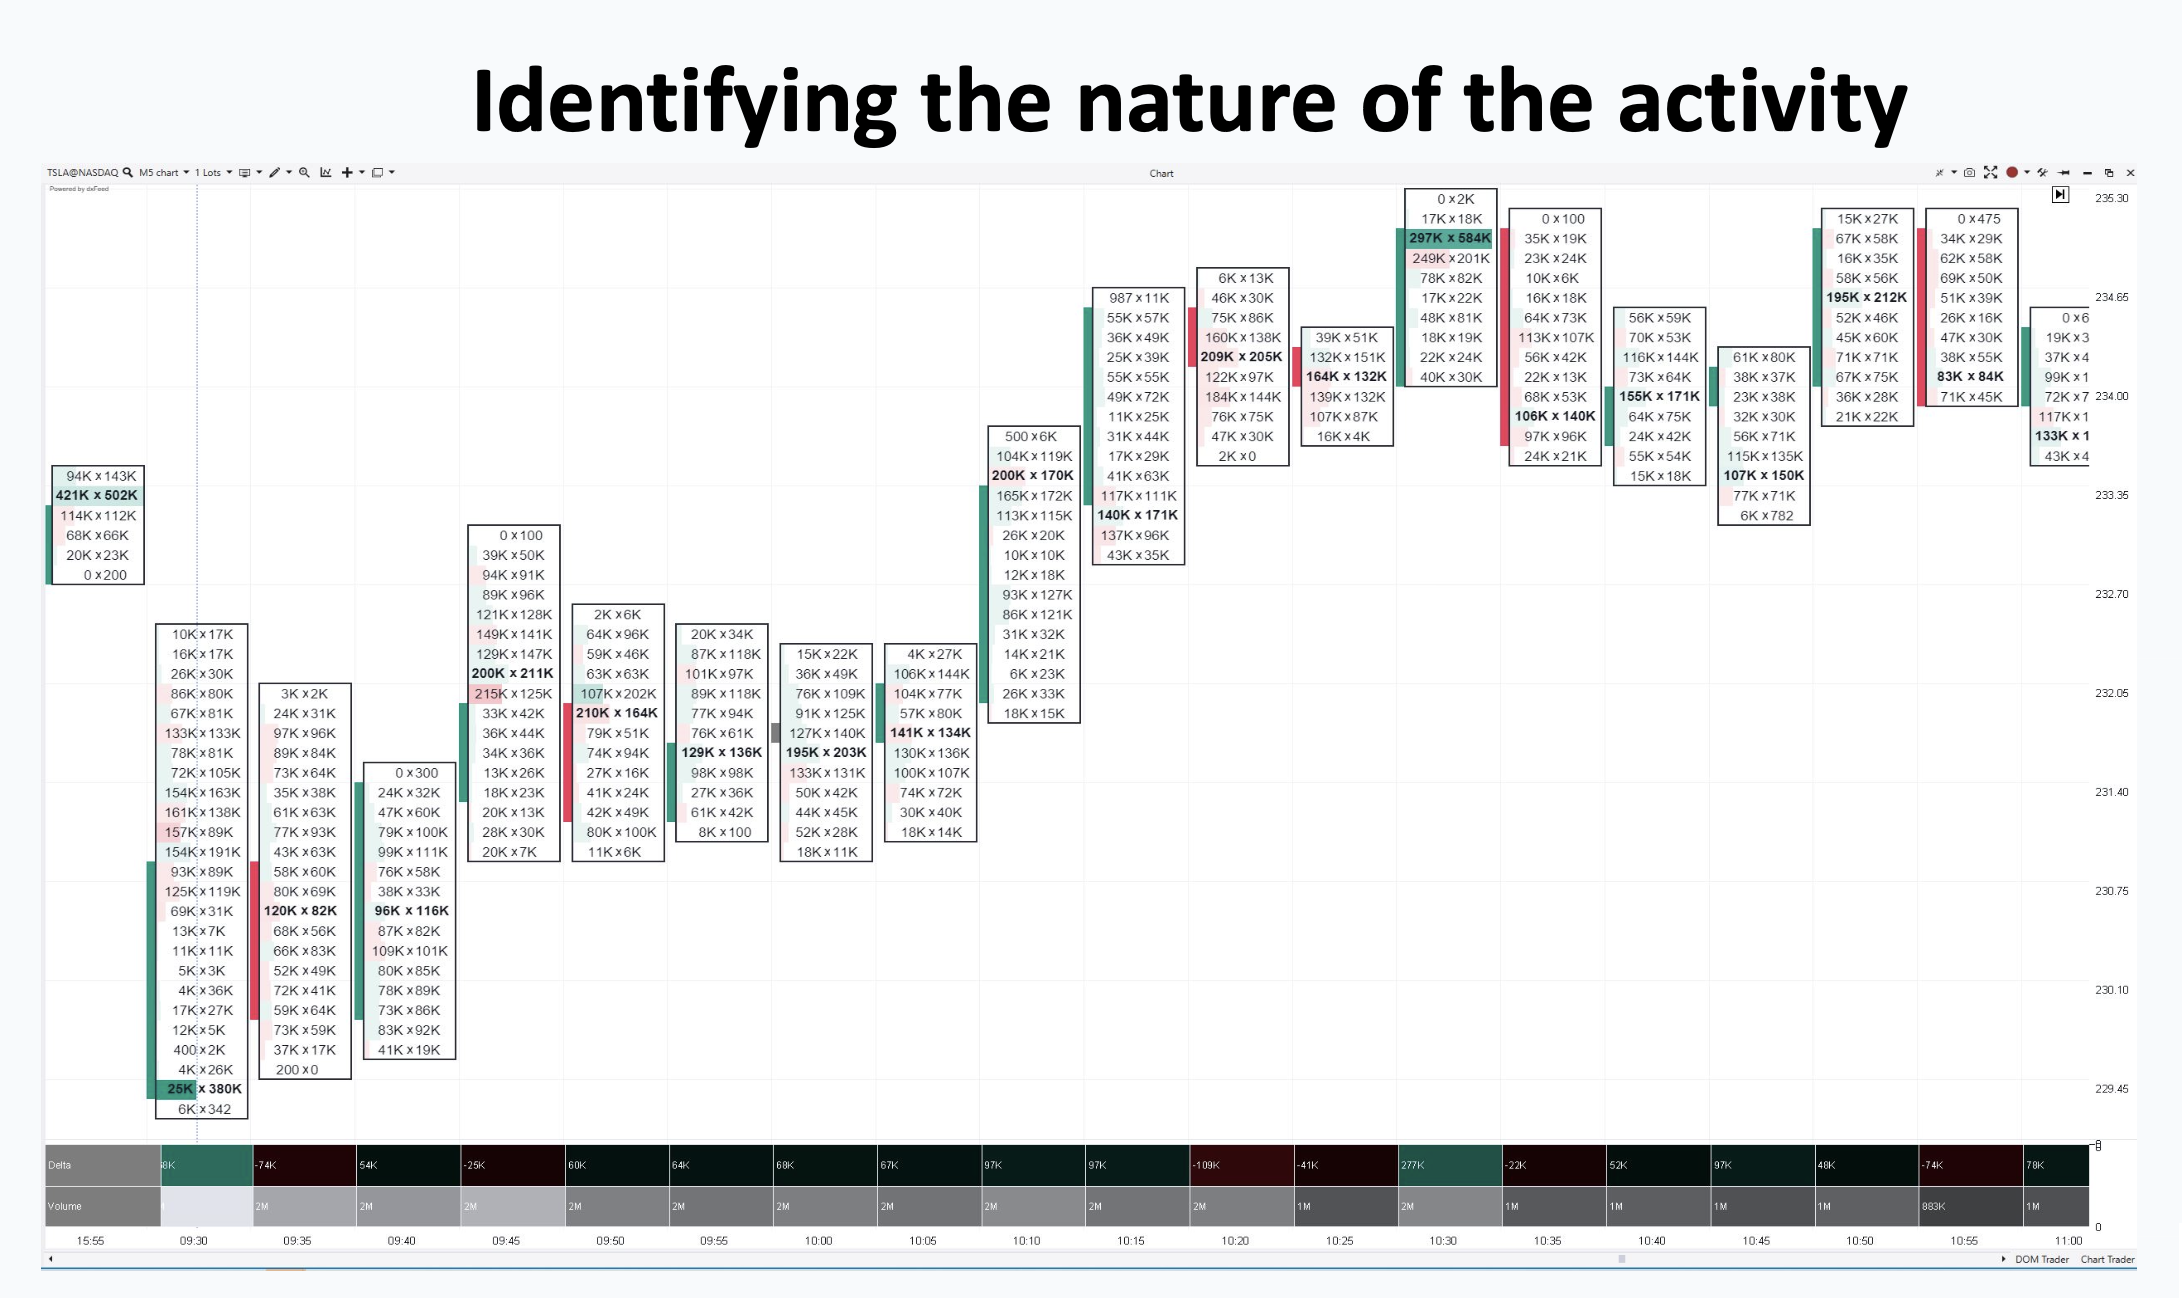
Footprint Charts
A footprint chart shows exactly how much volume traded at the bid and ask at each price. This makes it easier to spot things like absorption (when buyers or sellers quietly soak up orders), imbalances, or failed pushes. It adds another layer of detail beyond a normal candlestick chart.
DOM / Level 4 / Heatmap
The DOM (depth of market) and heatmap show where big orders are sitting and how that liquidity changes. For example, Bookmap gives a clear, visual heatmap of stacked buy and sell orders, while Sierra Chart offers advanced DOM and footprint tools that are especially popular for futures traders.
Tools for Reading Order Flow
Note: Futures like ES or NQ go through a central exchange, so the order flow data is clean and reliable. Stocks, on the other hand, trade across multiple venues, so the data is a bit noisier. Still, the same principles apply, you just need to read the bigger picture rather than focusing on every single print.
The Role of Context
In trading, context is everything. Looking only at a 1–5 minute chart without understanding the bigger picture often leads to getting chopped up. Before you pay attention to order flow, you need to know the market’s backdrop.
Macro context: What’s the bigger theme? Is the market in “buy the dip” mode or “sell the rip” mode? Are there key events or data releases that could drive sentiment?
Technical structure: Is the market trending or balanced? Where is fair value? What level is the clear “line in the sand” that separates buyers from sellers?
Scenario planning: Think in terms of “if/then.” If buyers defend a level, expect continuation. If they fail, expect reversal.
Intraday confirmation: Once you have the bigger picture, use order flow to confirm. Watch for tape aggression, footprint absorption, strong volume, or VWAP slope in the direction of your thesis.
Without context, order flow signals are just noise. With context, they become powerful confirmations that let you trade with confidence.
Building an A+ Trade
An A+ trade isn’t about luck, it’s about alignment. The best setups meet five key conditions at once:
Thesis & context: You start with a clear idea of what the market is doing, trending, balancing, reacting to a catalyst, or defending a key theme.
Key zones: Levels that matter, such as institutional price zones, balance extremes, VWAP, or big round numbers.
Aggressive flow: Market orders showing who is in control. Buyers lifting offers? Sellers hammering bids? This confirms direction.
Liquidity & volume: Signs of absorption or participation where you expect it. A strong move usually needs relative volume (RVOL) above 1.5 to back it up.
Risk-to-reward: The entry has to make sense. A trade should offer at least 2R potential, meaning the reward is at least double the risk you’re putting on.
When all five pillars line up, you’ve found what can be called an A+ trade, a setup with the highest probability of success and the best reward relative to the risk you’re taking.
A+ Trade Basic Framework
Case Study: Tesla Setup
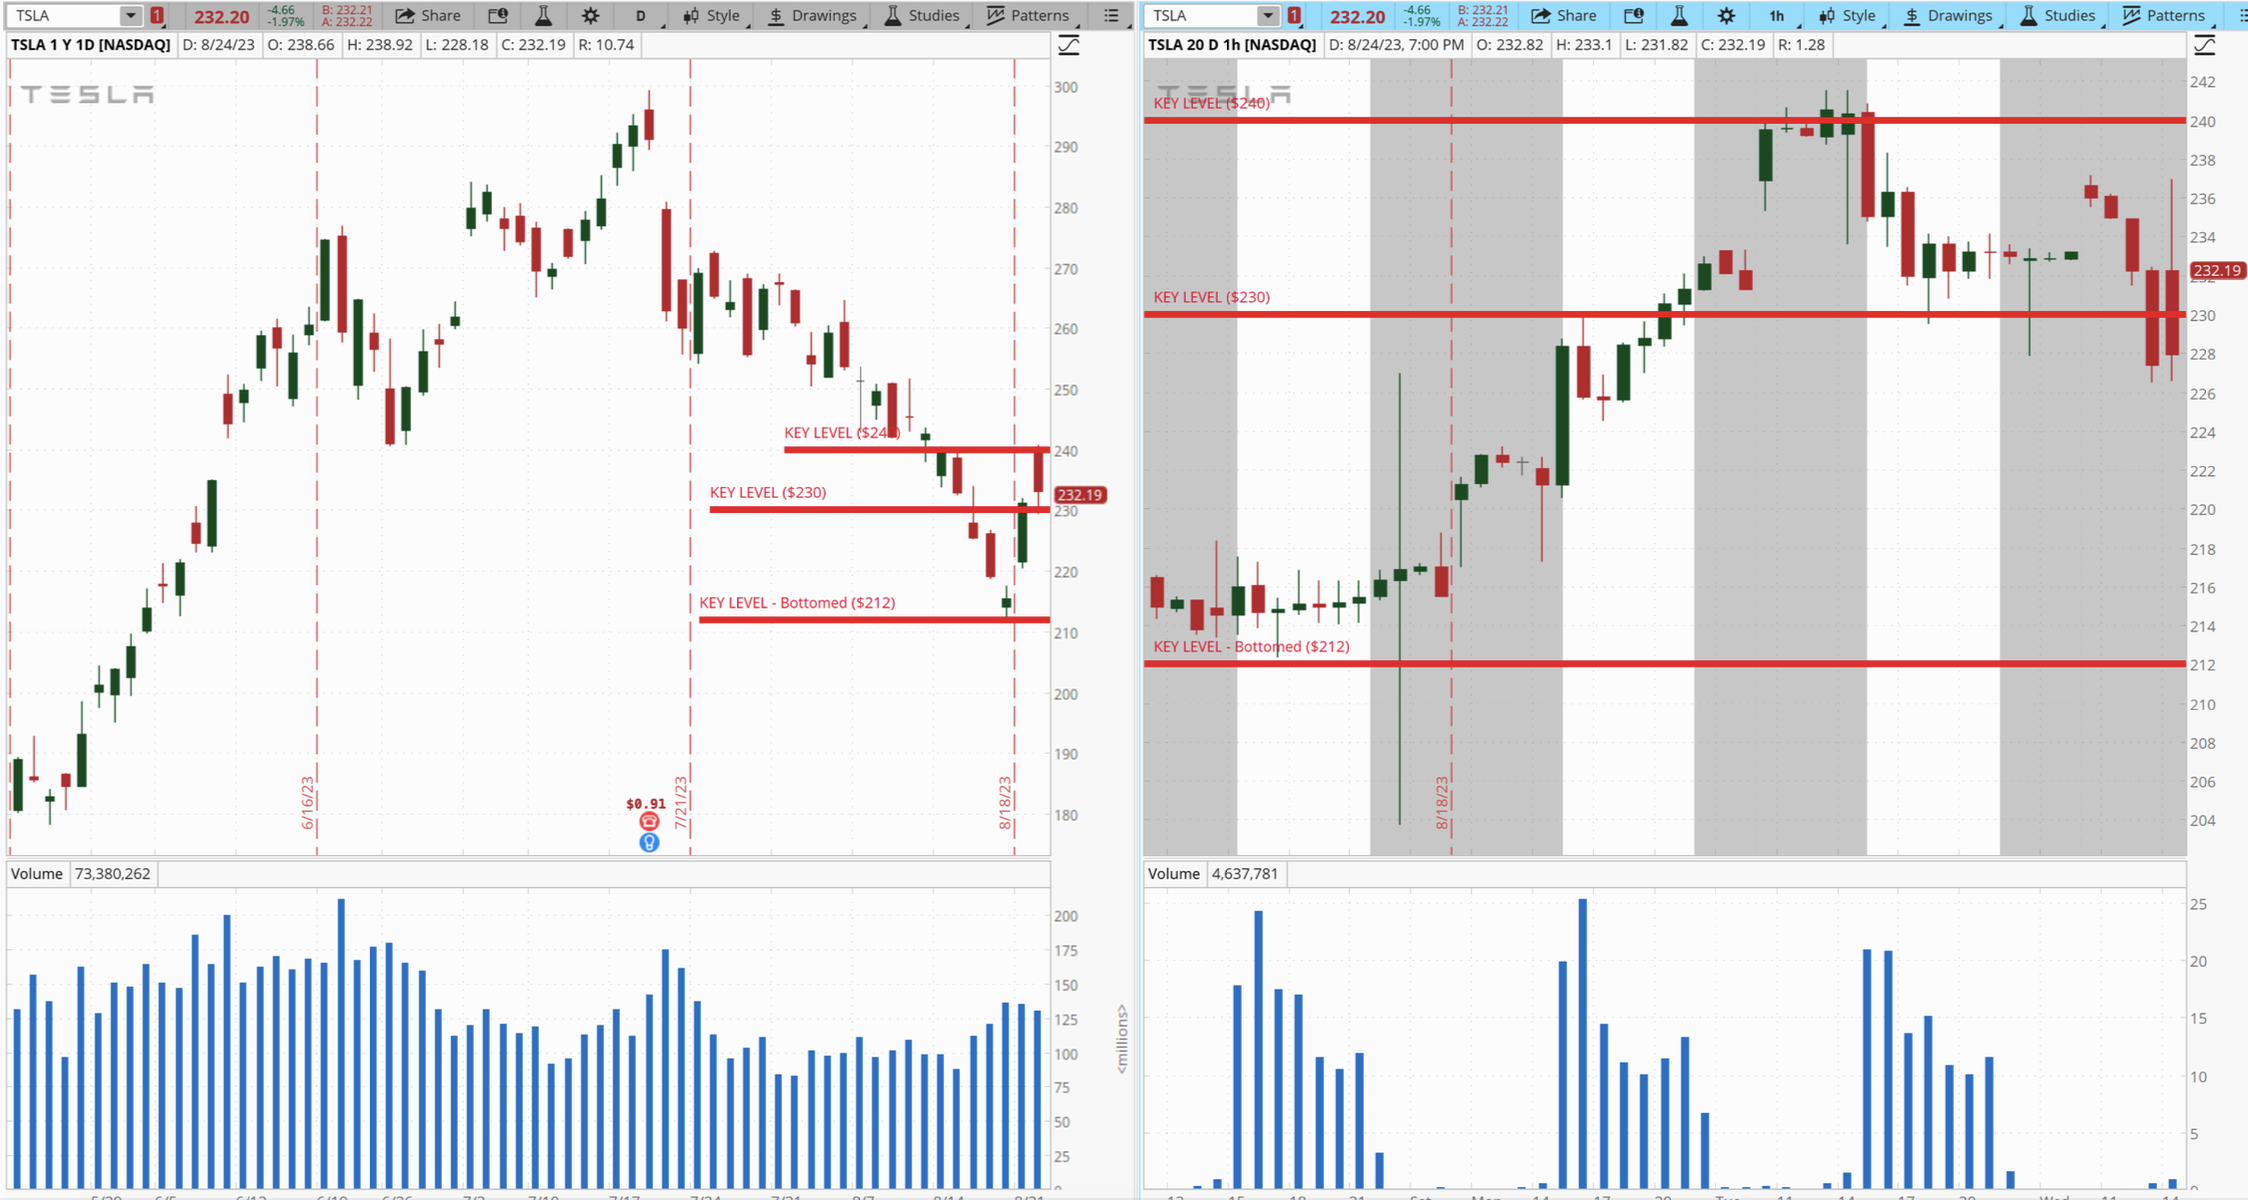
Tesla is a stock that often makes explosive moves, and order flow gives a clear view of where big players are active. One example came after the stock had already bottomed around the $200–210 area and started pushing higher.
On this particular day, Tesla gapped down at the open and slid back toward the $230 zone. At first, it looked like the gap might lead to more downside. Sellers were aggressive, hitting the bids with size and trying to push through $230.
But when you looked at the footprint chart and the tape, something different stood out. Despite all the selling pressure, not a single bid was accepted below $230. Large passive buyers were sitting there, absorbing everything that came their way. The more sellers hit, the more those buyers quietly soaked up.
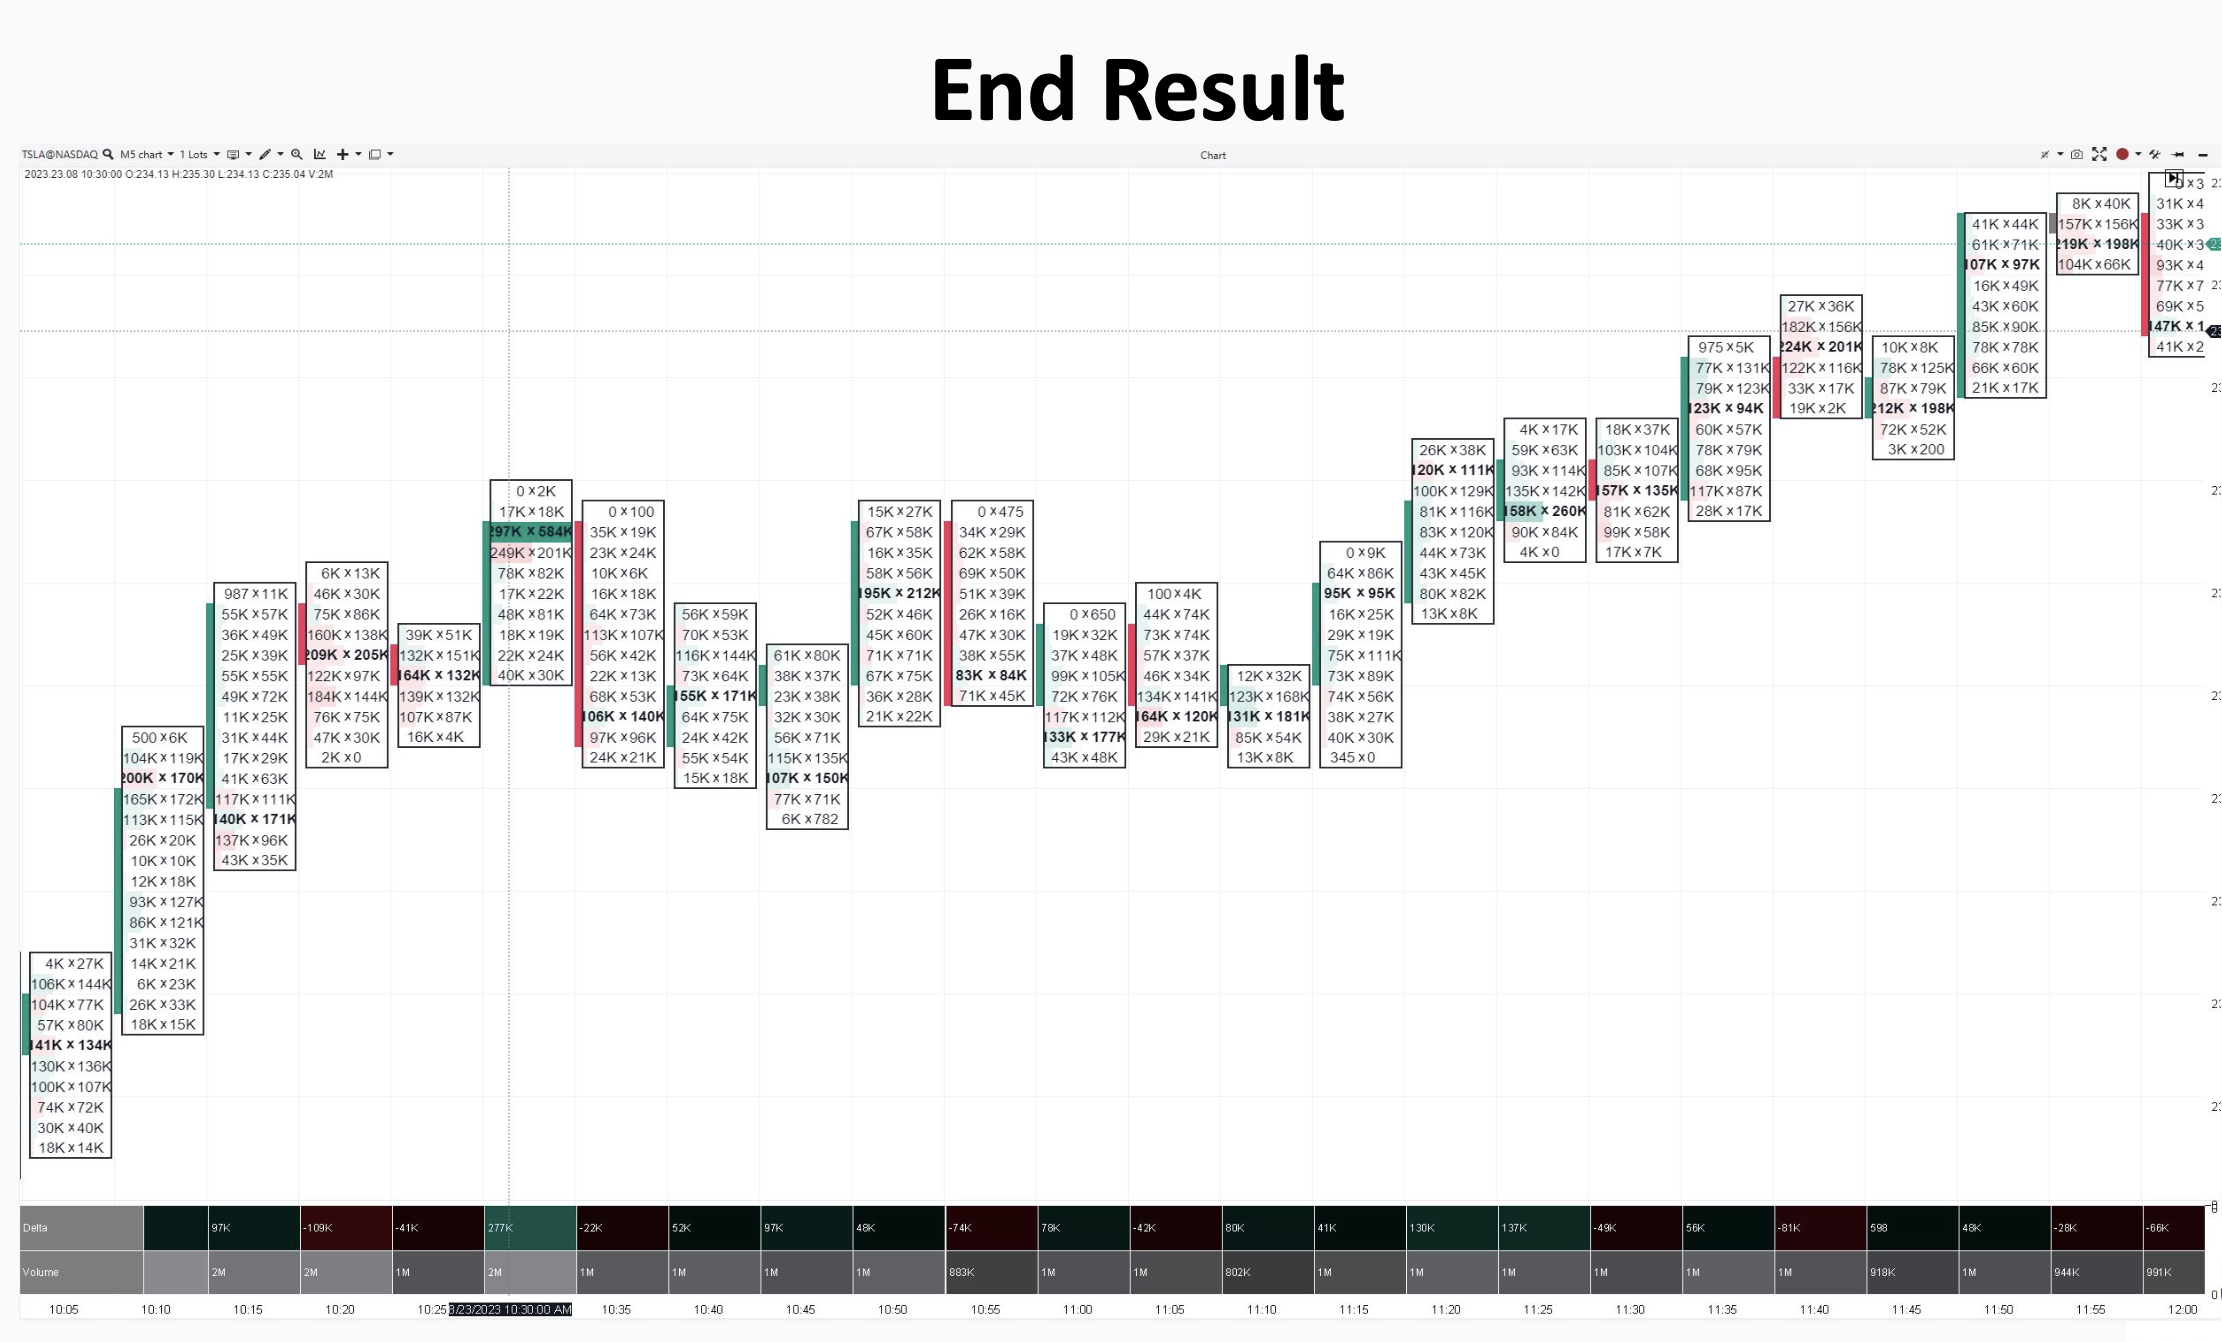
Once the selling dried up, aggressive buyers stepped in, lifted the offers, and drove the price higher. That gap down turned into an opportunity for a reversal, not a breakdown.
Context: Gap down into a key institutional level ($230).
Clue: Heavy selling met with strong passive bids; price held firm.
Result: Tesla bounced sharply from $230 and continued higher.
Setup Type:Absorption – large buyers defending an institutional level, creating the base for a reversal.
Final Thoughts
Big market moves don’t just appear out of nowhere. They happen when the balance between buyers and sellers breaks and one side takes full control.
Order flow helps traders see this shift in real time. By watching how limit orders and market orders interact, and by recognizing setups like absorption, exhaustion, breakouts, and rejections, it becomes easier to spot when a strong move is starting.
The real edge comes from combining order flow with context, knowing the bigger market theme, key zones, volume, and risk-to-reward. When everything lines up, that’s when you get the best trade opportunities.
The traders who improve fastest do not just read order flow, they record it. Journal every trade with the setup type (absorption, exhaustion, breakout, rejection), tag your A+ conditions, and review your setups afterward so you can see which reads actually make you money. That feedback loop is what turns order flow from theory into a repeatable edge.
Frequently Asked Questions
What is order flow trading?
Order flow trading is a method of reading the real-time interaction between aggressive market orders and passive limit orders to anticipate where price is likely to move. Instead of relying only on a candlestick chart, order flow traders watch how buyers and sellers negotiate at key levels, so they can spot the moment balance breaks and a strong directional move begins.
Why do explosive moves happen in the market?
Explosive moves happen when the balance between buyers and sellers breaks down and one side takes full control. Markets normally trade in a fair zone where most activity happens, like the middle of a bell curve. When aggressive buyers keep lifting prices or aggressive sellers keep pushing them lower, price leaves that fair zone and runs quickly toward a new one.
What are the four core order flow setups?
The four core order flow setups are absorption, exhaustion, breakout, and rejection. Absorption is when strong passive buyers soak up all the selling at a level and price bounces. Exhaustion is when buyers fail repeatedly against large sellers and price turns lower. A breakout is when aggressive market orders push through all the resting orders at a level. Rejection is when price touches a level and instantly turns away.
What tools do you need to read order flow?
The main tools are the tape (Level 2 and Time and Sales), footprint charts, and the depth of market or heatmap. The tape shows bids, offers, and trades as they happen. Footprint charts show how much volume traded at the bid and ask at each price. The depth of market and heatmap show where large resting orders sit and how that liquidity changes.
Does order flow trading work for stocks or only futures?
Order flow works for both, but the data is cleaner for futures. Futures like ES or NQ trade through a central exchange, so the order flow data is reliable. Stocks trade across multiple venues, so the data is noisier. The same principles apply to stocks, you just need to read the bigger picture rather than focusing on every individual print.
How do you build an A+ order flow trade?
An A+ trade lines up five conditions at once: a clear thesis and market context, a key zone such as an institutional level or VWAP, aggressive flow showing who is in control, supporting liquidity and volume (often relative volume above 1.5), and a risk-to-reward of at least 2R. When all five align, the setup has the highest probability and the best reward relative to the risk.
Is order flow trading good for beginners?
Order flow can be learned by beginners, but it works best once you understand market context. Reading the tape or footprint without knowing the bigger market theme and key levels often leads to getting chopped up. Beginners should start by identifying the market structure and key zones first, then use order flow to confirm a move in the direction of their thesis.
Frequently Asked Questions
Order flow trading is a method of reading the real-time interaction between aggressive market orders and passive limit orders to anticipate where price is likely to move. Instead of relying only on a candlestick chart, order flow traders watch how buyers and sellers negotiate at key levels, so they can spot the moment balance breaks and a strong directional move begins.
Explosive moves happen when the balance between buyers and sellers breaks down and one side takes full control. Markets normally trade in a fair zone where most activity happens, like the middle of a bell curve. When aggressive buyers keep lifting prices or aggressive sellers keep pushing them lower, price leaves that fair zone and runs quickly toward a new one, which creates the fast, powerful moves you see on the chart.
The four core order flow setups are absorption, exhaustion, breakout, and rejection. Absorption is when strong passive buyers soak up all the selling at a level and price bounces. Exhaustion is when buyers fail repeatedly against large sellers and price turns lower. A breakout is when aggressive market orders push through all the resting orders at a level. Rejection is when price touches a level and instantly turns away.
The main tools are the tape (Level 2 and Time and Sales), footprint charts, and the depth of market or heatmap. The tape shows bids, offers, and trades as they happen. Footprint charts show how much volume traded at the bid and ask at each price. The depth of market and heatmap show where large resting orders sit and how that liquidity changes.
Order flow works for both, but the data is cleaner for futures. Futures like ES or NQ trade through a central exchange, so the order flow data is reliable. Stocks trade across multiple venues, so the data is noisier. The same principles apply to stocks, you just need to read the bigger picture rather than focusing on every individual print.
An A+ trade lines up five conditions at once: a clear thesis and market context, a key zone such as an institutional level or VWAP, aggressive flow showing who is in control, supporting liquidity and volume (often relative volume above 1.5), and a risk-to-reward of at least 2R. When all five align, the setup has the highest probability and the best reward relative to the risk.
Order flow can be learned by beginners, but it works best once you understand market context. Reading the tape or footprint without knowing the bigger market theme and key levels often leads to getting chopped up. Beginners should start by identifying the market structure and key zones first, then use order flow to confirm a move in the direction of their thesis.


.jpg)