Most traders skip journaling because the setup takes too long. This free Google Sheets template gives you pre-built columns for P&L, R-multiples, win rate, and setup tagging, with automatic calculations that work the moment you paste your first trade. We also walk you through exactly when a spreadsheet stops being enough and what to upgrade to.
class SampleComponent extends React.Component {
  // using the experimental public class field syntax below. We can also attach
  // the contextType to the current class
  static contextType = ColorContext;
  render() {
    return <Button color={this.color} />
  }
}
Last Updated: June 2, 2026
A trading journal template is a pre-built spreadsheet that logs every trade you take, automatically calculates your P&L, win rate, and R-multiples, and organizes your performance data so you can review it weekly and identify what's working and what isn't. This free Google Sheets template gives you that structure in under 5 minutes, with no formulas to build and no formatting to set up.
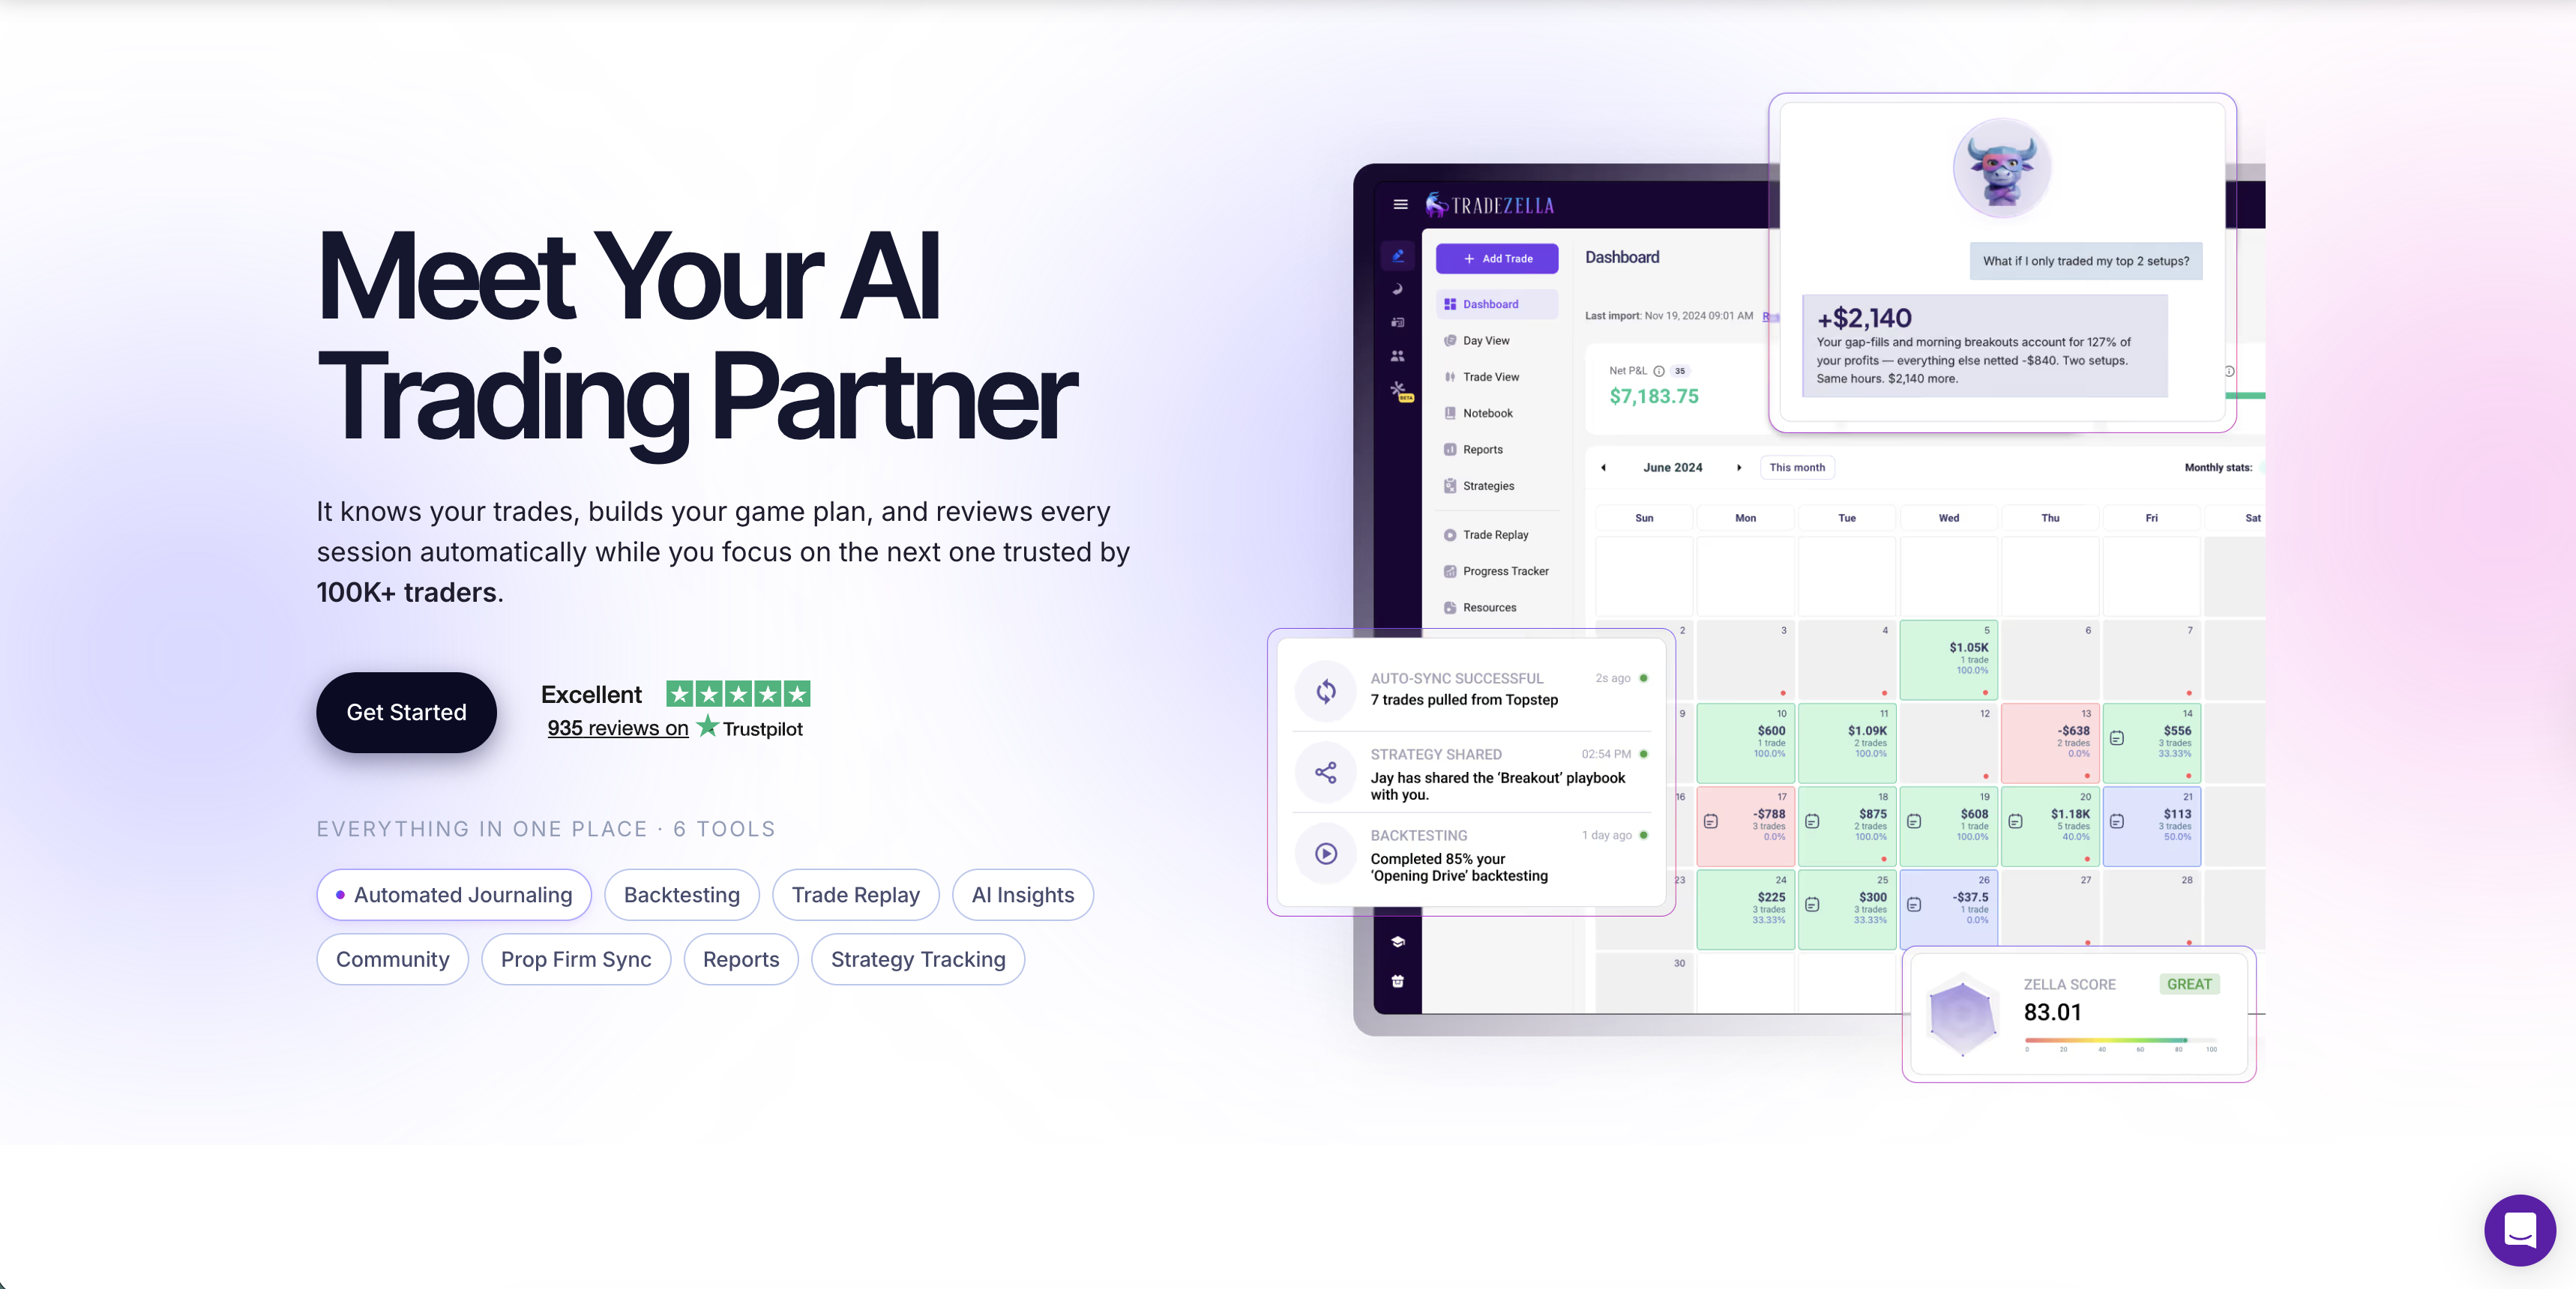
You already know you should be journaling your trades. Every profitable trader will tell you the same thing: tracking your trades is the single biggest edge you can give yourself.
But most traders don't journal. Not because they don't want to, because they don't have a system that's easy enough to actually stick with.
That's why we built a free trading journal template you can start using today. No complicated setup. Just a clean, structured spreadsheet that tracks everything that matters, with automatic calculations for P&L, win rate, and R-multiples.
What's Included in the Template?
The template is a Google Sheets spreadsheet you can copy to your own Drive and start using immediately. Here's what's pre-built:
Core trade data columns: date, ticker/pair, direction (long/short), entry price, stop loss, take profit, exit price, and position size.
Automatic P&L calculations. Enter your entry, exit, and position size, and the dollar P&L calculates itself.
Auto-calculated R-multiples. The template calculates your R on every trade based on your entry and stop distance. This is the metric that tells you whether you're capturing enough reward relative to your risk
Auto-calculated win rate. Your running win rate updates with every trade logged. No manual counting.
Daily, weekly, and monthly performance summaries. Aggregated stats so you can see trends over time.
Notes column. Track your mindset and emotions on each trade. This is where you catch the patterns that don't show up in numbers alone.
Setup/strategy tagging. Tag each trade by setup type (breakout, pullback, VWAP bounce, etc.) so you can compare which setups actually make you money.
Your memory is lying to you. Traders consistently overestimate their wins and underestimate their losses. Without a journal, you're making decisions based on feelings instead of data.
A trading journal gives you four things a broker statement never will:
Objective performance data. No more guessing whether your strategy works. The numbers tell the truth. Your win rate, average R, and P&L by setup type are all calculated automatically in the template.
Pattern recognition. When you review your journal weekly, you start seeing patterns you'd never catch in real time. Maybe you always lose on Mondays. Maybe your win rate doubles when you wait for a pullback.
Emotional awareness. Tracking your mindset alongside your trades reveals how emotions affect decisions. Revenge trading, FOMO entries, and early exits all become visible when you write them down. You can't fix a pattern you can't see.
Accountability. A journal holds you to your own rules. When you have to write down why you took a trade, you think twice about breaking your plan.
What Should You Track in a Trading Journal?
A trading journal should track two layers of data. The first layer is the non-negotiables that every trade needs: date and time, ticker, direction, entry and exit prices, position size, P&L in dollars, R-multiples, and setup name. These are the columns pre-built into the template.
The second layer is the game-changers that most traders skip: pre-trade plan, emotional state before and during and after the trade, chart screenshot at entry, whether you followed your rules, market conditions, and time of day.
The more context you capture, the more useful your reviews become. But don't let perfection kill the habit. Tracking the basics is 10x better than trading blind. Start with the non-negotiables. Add the game-changers once the habit is locked in.
For a deeper breakdown of which metrics matter most at different trading volumes, read our full trading journal vs spreadsheet comparison. It covers the exact tipping points where manual tracking breaks down.
How Do You Use the Free Template?
To use a trading journal, log every trade immediately after execution with your entry, exit, position size, and setup name. Tag each trade by strategy type, add notes on your emotional state and rule adherence, then review your entries weekly to identify patterns in your performance and psychology. The template below automates the math so you can focus on the analysis.
Step 1: Make a Copy
Go to the Trading Journal Template page, open the Google Sheets link, and click File > Make a Copy to save it to your own Google Drive.
Step 2: Log Every Trade
After each trade, fill in these columns: date, ticker/pair, direction (long or short), setup name, entry price, stop loss, take profit, exit price, and position size. The P&L and R-multiple columns calculate automatically.
The notes column is where you capture what no formula can. Write your mindset before the trade, what you saw on the chart, whether you followed your rules, and what you'd do differently. This column is what turns a data table into a learning tool.
Step 3: Tag Your Setups
The Setup column is one of the most powerful features. By consistently tagging each trade (breakout, pullback, VWAP bounce, range fade, etc.), you'll be able to filter by setup over time and answer the most important question: which of my strategies actually makes money?
This is the same principle behind habit tagging. When you tag every trade with both the setup name and any behavioral notes (entered early, moved stop, sized up), you create a searchable record of what you actually did versus what you planned to do.
Step 4: Review Weekly
Set aside 30 minutes every weekend to review:
Overall win rate for the week
Which setups performed best
Your largest loss. Was it a rule break or a normal stop-out?
Emotional patterns. When do you trade poorly?
This weekly review is where the real growth happens. Our trade review framework walks you through the exact process step by step, so you know what to look for and what to change.
Step 5: Track Monthly Stats
The template includes a monthly summary that aggregates your data: total P&L, win rate, average winner vs. loser, best and worst setups, and total number of trades.
After 30+ trades, your monthly stats become meaningful. Before that, the sample size is too small to draw conclusions. Don't change your strategy based on 10 trades. Wait for real data.
What Are the Honest Limitations of a Spreadsheet Journal?
Limitation
Spreadsheet
TradeZella
Impact
Data Entry
Manual, every trade typed by hand
Auto-imports from broker
20-60 min/day wasted at 5-20 trades
Accuracy
One typo breaks P&L calculations
Synced directly, no human error
Especially critical for prop firm accounts
Analytics Depth
Win rate and basic stats only
Profit factor, expectancy, filtered by any dimension
Can't diagnose strategy problems without deep filters
Chart Replay
No visual context, numbers only
Full chart replay at entry and exit
Context disappears without visuals
Scalability
Breaks down at 10+ trades/day
Handles unlimited trades across all markets
Most traders quit journaling within 2 weeks
Time estimates based on manual entry of all required fields. Actual time varies by trading frequency and detail level.
A spreadsheet is a great starting point. It's free, flexible, and builds the journaling habit. But it has real limitations that surface as your trading volume increases:
Manual data entry is tedious. Every trade typed by hand. If you take 5 trades a day, that's roughly 20 minutes of data entry. At 10 trades, you're spending 40 minutes. At 20+ trades per day (common for scalpers), you're looking at over an hour. Most traders quit journaling within 2 weeks because the entry time exceeds their patience.
No automatic broker sync. You manually pull data from your broker and match it to entries. One typo throws off your P&L. This matters especially for prop firm traders, where accurate drawdown tracking is the difference between keeping and losing an account.
Limited analytics. Basic stats like win rate work fine. But performance by time of day, by ticker, by emotional state? That requires formula wizardry most traders don't have. You'll want profit factor and expectancy calculations eventually, and a spreadsheet makes those painful to build and maintain.
No visual chart replay. You can't attach dynamic screenshots or replay trades visually. Context disappears.
It doesn't scale. Hundreds of trades turn a spreadsheet into an unwieldy mess. Finding patterns becomes nearly impossible.
A spreadsheet is training wheels. Perfect for learning the habit. When you're ready for the full breakdown of where spreadsheets break down at each volume level, read our journal vs spreadsheet deep dive.
When Should You Upgrade from a Spreadsheet to Automatic Trading Journal like TradeZella?
The template gets you started. But there's a clear point where a spreadsheet holds you back. Here's what the upgrade path looks like:
Phase 1: Start with the free template. Build the habit. Track every trade. This costs nothing and teaches you what data matters.
Phase 2: Identify your limitations. After 2-4 weeks, you'll notice where the friction is. Manual entry gets old. You'll want deeper analytics. You'll want to filter by setup, time of day, and emotional state without building custom formulas.
Phase 3: Upgrade to TradeZella. When the spreadsheet holds you back, TradeZella picks up exactly where it left off. Your trades import automatically from your broker. Zella AI tags every trade, reviews every session, and journals your entire day without you typing a single note. You go from spending 20+ minutes on manual entry to spending zero.
What TradeZella adds that a spreadsheet can't:
Automatic trade imports. Connect your broker and every trade syncs automatically. No manual entry. No typos. No missed trades.
AI-powered insights. Zella AI surfaces patterns you would never find manually, including your most profitable setups, best times of day, where your strategy breaks down, and behavioral patterns like revenge trading sequences. Ask Zella AI a question about your data and get answers backed by your actual trade history, not generic advice.
Advanced filtering. Want your win rate on breakout trades during the first hour on Tuesdays? TradeZella answers that in seconds.
Visual trade replay. See exactly what the chart looked like at entry and exit. Your journal becomes a learning tool, not just a data table.
Emotional tracking with correlation. Tag your emotional state and see how psychology correlates with performance across hundreds of trades.
Performance dashboards. Interactive dashboards across any time period, setup, ticker, or market condition.
Built for every market. Stocks, options, futures, forex, crypto. TradeZella handles it all.
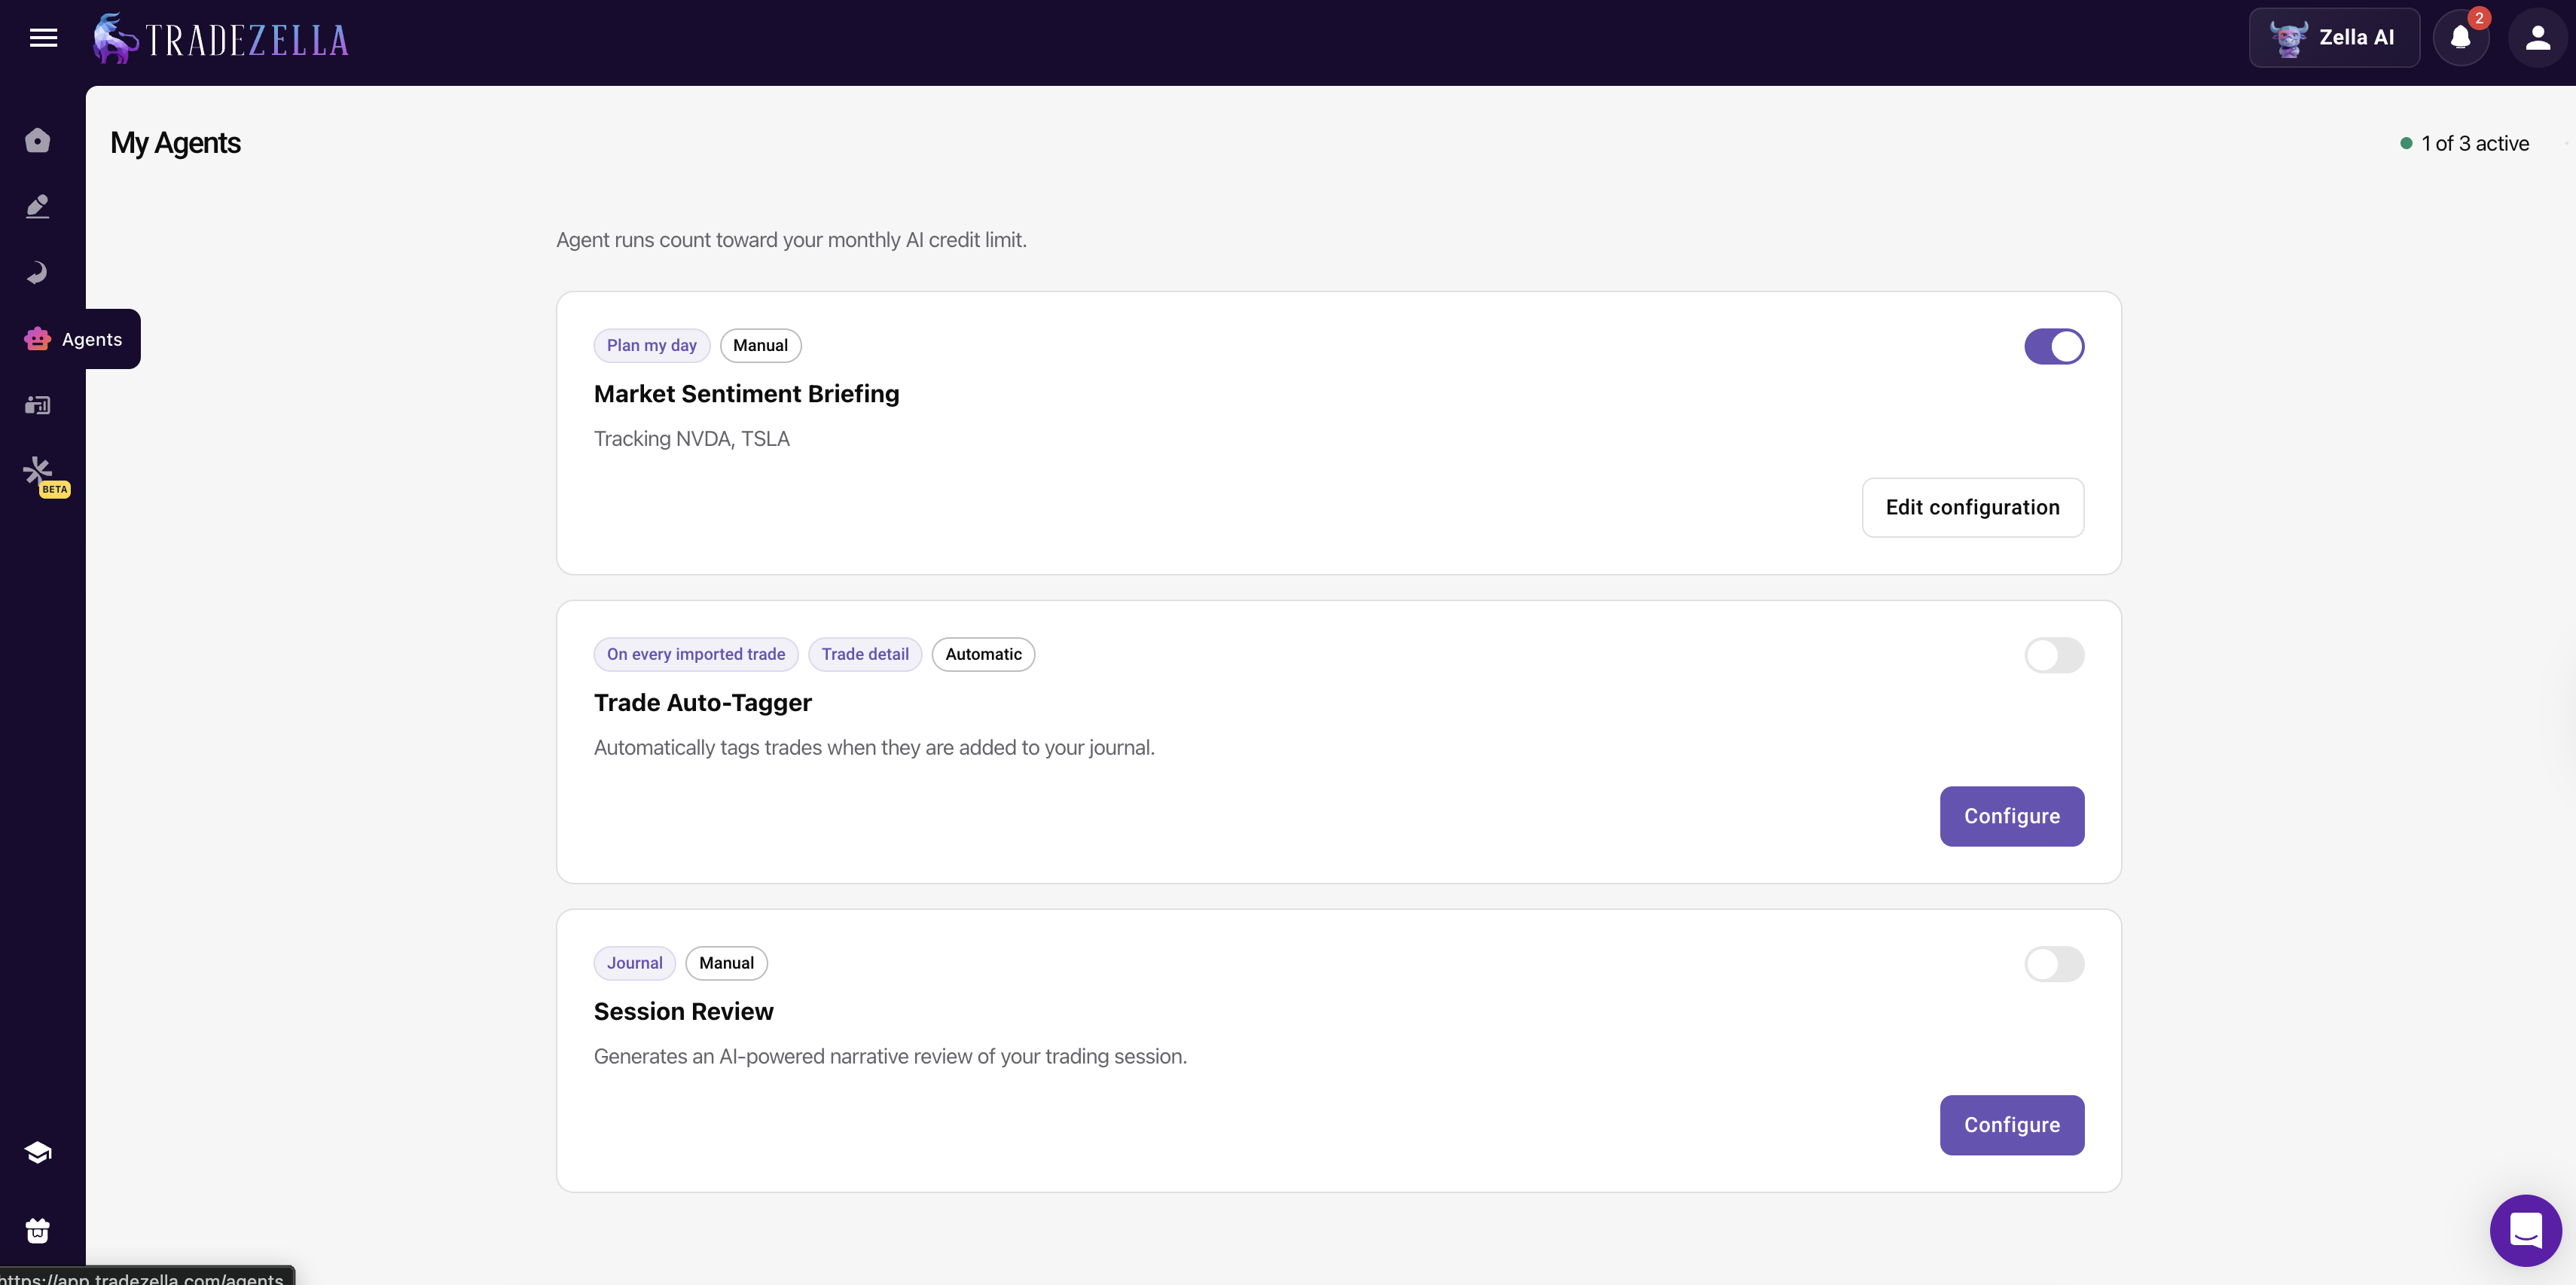
Zella AI: Your AI trading partner that does the work for you
TradeZella includes Zella AI, an AI trading partner that takes action on your data. While a spreadsheet template requires manual entry and notes for every trade, Zella AI handles the heavy lifting automatically:
Auto Trade Tagger. You set up tagging criteria (tag trades that hit 2R, tag by entry timeframe, tag by setup concept). The agent applies tags automatically to every trade based on your rules. No more manually typing setup names into a spreadsheet column.
Session Review. Automatically reviews your trading day after you finish. Compares your morning plan versus your actual results, checks whether you followed your rules, and journals everything for you. The 20 minutes you would spend writing notes in a template? Zella AI handles it in seconds.
Market Sentiment Briefing. Before you trade, Zella AI generates a personalized pre-market plan based on how you trade, your selected assets, and what you look at (economic calendar, higher timeframes, order blocks, supply and demand). The template tracks what happened. Zella AI helps you prepare for what is coming.
TradeZella Agents
Memory. Zella AI remembers your name, risk limits, trading style, and Strategies across sessions. Every interaction makes the next one smarter. A spreadsheet resets every time you open it.
The free template builds the journaling habit. Zella AI takes that habit and automates it.
What Are the Best Tips for Getting Maximum Value from Your Journal?
Journal immediately after the trade. Don't wait. Your memory fades fast. The notes you write 5 minutes after a trade are 10x more useful than what you remember at the end of the day.
Be brutally honest. If you revenge-traded, write it down. Honesty in the journal leads to honesty in your trading.
Focus on process, not P&L. A losing trade that followed your rules is a good trade. A winning trade that broke every rule is a bad trade. Your journal should reinforce this. When you review, check rule adherence first, P&L second.
Review consistently. Schedule a weekly review and treat it as non-negotiable. Use the Trading Checklist to standardize what you look at every session.
Look for patterns over 30+ trades. Small samples are meaningless. Wait for real data before making strategy changes.
Use your journal to prepare. Before market open, review recent trades. What worked? What setups are you watching today? The best traders use their journal as both a rearview mirror and a game plan. Zella AI makes most of these tips automatic. The Auto Trade Tagger applies your tagging rules to every trade the moment it syncs, so nothing gets missed even if you walk away from the screen. The Session Review agent compares your morning plan against your actual results and flags rule breaks you might gloss over when self-reporting. And because Zella AI remembers your risk limits, Strategies, and trading style across sessions, every review builds on the last one. The journal habit still matters, but AI handles the mechanical work so your review time goes toward spotting patterns and making adjustments.
Key Takeaways
The free trading journal template gives you pre-built columns for P&L, R-multiples, win rate, and setup tagging with automatic calculations.
Start by tracking the non-negotiables: date, ticker, direction, entry/exit prices, position size, P&L, R-multiples, and setup name.
Add emotional state and rule adherence tracking once the habit is locked in. These are the game-changers most traders skip.
Review weekly. 30 minutes every weekend is where the real growth happens.
A spreadsheet is the right starting point, but it breaks down at higher volumes. Manual entry, limited analytics, and no broker sync are real limitations.
When the spreadsheet holds you back, TradeZella automates imports, adds AI insights, and gives you the analytics a spreadsheet can't provide.
Zella AI takes the journaling habit further by tagging every trade automatically, reviewing your sessions against your plan, and generating pre-market briefings based on how you trade.
Frequently Asked Questions
What is a trading journal template?
A trading journal template is a pre-built spreadsheet that logs every trade you take, including entry and exit prices, position size, P&L, the strategy or setup used, and notes about your decisions and emotions. The template automatically calculates key metrics like win rate, R-multiples, and total P&L so traders can review performance weekly and identify patterns without building formulas from scratch.
What should I track in a trading journal?
Track two layers of data. The non-negotiables: date, ticker, direction, entry and exit prices, position size, P&L, R-multiples, and setup name. The game-changers most traders skip: pre-trade plan, emotional state, chart screenshot at entry, whether you followed your rules, market conditions, and time of day. Start with the non-negotiables and add the rest once the habit is locked in.
Is a spreadsheet good enough for a trading journal?
A spreadsheet is a great starting point for building the journaling habit. It's free, flexible, and handles basic stats like win rate. But it requires manual entry for every trade, has limited analytics beyond basic stats, and doesn't scale past 5-10 trades per day. Our journal vs spreadsheet comparison breaks down exactly where spreadsheets hit their limits at each trading volume level.
How often should I review my trading journal?
At least once per week. Set aside 30 minutes on the weekend to analyze your trades, check which setups performed best, identify your largest loss and whether it was a rule break or normal stop-out, and look for emotional patterns that correlate with poor performance. Monthly reviews are also valuable once you have 30+ trades logged.
What is the most important thing to track in a trading journal?
Beyond the basic trade data (prices, P&L, position size), the two most impactful things to track are your emotional state and whether you followed your trading plan on each trade. Most trading losses come from rule-breaking, not from bad strategy. Tracking these two data points makes destructive patterns like revenge trading and FOMO entries visible so you can fix them.
What is an R-multiple in trading?
An R-multiple measures how much you gained or lost relative to your initial risk. If you risked $200 and made $400, that's a 2R trade. If you risked $200 and lost $200, that's a -1R. Tracking R-multiples normalizes your performance across different position sizes and setups, so you can compare trades on equal terms. It's considered one of the most important metrics for evaluating trading consistency.
Can I use a trading journal template for futures, forex, and crypto?
Yes. The template works for any market. Enter the ticker or pair, your entry and exit prices, and position size in whatever unit your market uses (shares, contracts, lots, coins). The P&L calculation works the same way regardless of asset class. The setup tagging and emotional tracking columns are also market-agnostic.
Can AI replace manual trade journaling?
AI can automate the most time-consuming parts of trade journaling. TradeZella's Zella AI includes agents that tag every trade automatically based on rules you define, review your trading sessions against your morning plan, and generate pre-market briefings based on how you trade. The mechanical work (data entry, tagging, calculating metrics) is handled by AI, which frees you to focus on the part that actually improves performance: reviewing patterns and adjusting your approach. A spreadsheet template is the right starting point for building the habit. AI takes over the repetitive work once you are ready to scale.