Daily Bias
The daily bias is your idea of which direction the market is more likely to move today or tomorrow, either up (bullish) or down (bearish).
It helps you decide:
Should I be looking to buy or sell today?
How to Determine the Daily Bias
To determine the daily bias, ICT traders look at how the current day’s candle closes in relation to the previous day’s price range, specifically, the previous day’s high and low.
Here’s how to read the market:
Bullish Bias
A bullish bias suggests that the price is more likely to move higher the next day.
There are two main signs:
Close Above Previous Day’s High
If today’s daily candle closes above the previous day’s range (specifically above the high), it signals strength. This suggests that smart money may be aiming for higher prices the following day.
Wick Below, Close Above
If price pierces below the previous day’s low (grabbing sell-side liquidity) but closes back above the low, this can also signal a bullish bias. Price may have cleared liquidity and could now aim for higher targets like the current day’s high or even the previous day’s high.

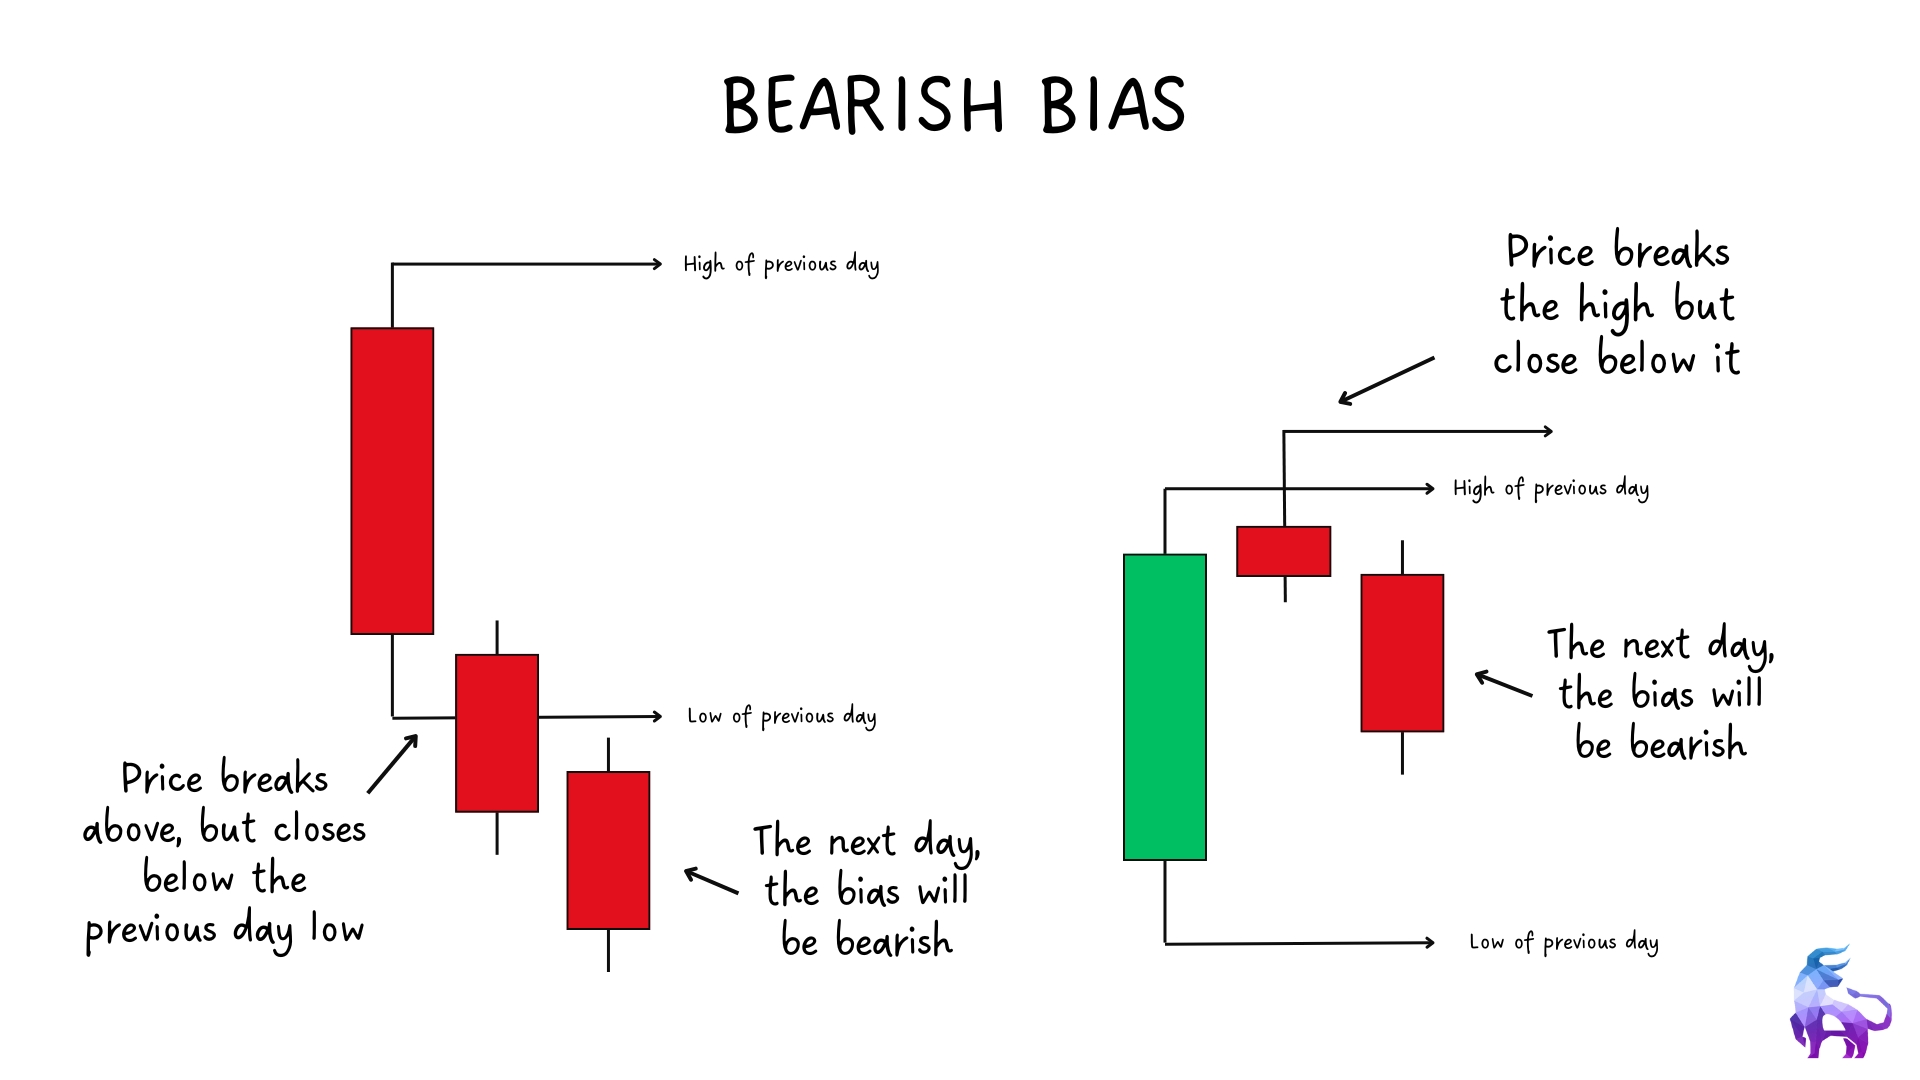
Bearish Bias
A bearish bias suggests that the price is more likely to move lower the next day.
Look for either of these:
Close Below Previous Day’s Low
If today’s candle closes below the previous day’s range (specifically below the low), it shows weakness. Smart money may be targeting lower prices on the next trading day.
Wick Above, Close Below
If price pierces above the previous day’s high (grabbing buy-side liquidity) but closes back below the high, it could signal that the buy-side has been cleared and price is now likely to move lower, possibly toward the current day’s low or further.
Sometimes, the daily bias may not play out cleanly. Price could stay inside the previous day’s range or react to intraday liquidity that shifts the narrative. It’s important to remember that daily bias is a directional framework, not a guaranteed outcome. Always wait for confirmation before entering trades and use proper risk management.
Kill Zones
In ICT trading, Kill Zones refer to specific times during the trading day when smart money is most active. These windows of time are important because they represent periods of high liquidity, strong price movement, and increased volatility — the perfect conditions for high-probability trade setups.
Smart money doesn’t trade all day long. They operate during the most efficient times, when their large orders can be executed with minimal slippage and maximum impact.
ICT traders use Kill Zones to align their trading with these periods, focusing only when the market is most likely to offer real opportunities.
Why Kill Zones Matter?
Most of the time, the market ranges, consolidates, or moves without any real intent. But during Kill Zones, you’ll often see:
- Clean liquidity grabs
- Order block reactions
- Fair value gap setups
- Breaks in market structure
This is because major market participants, such as banks and institutions, are actively placing and managing positions. Kill Zones help ICT traders avoid low-probability trades and focus only on the times when the price is likely to make meaningful moves.
Forex Kill Zones (EST)
These are the main Kill Zones for Forex trading, based on Eastern Standard Time (EST):
Asia Session
Time: 8:00 PM – 12:00 AM
This is the start of the trading day. While price often moves slowly, it forms the range that smart money may later target for liquidity during the London session.
London Kill Zone
Time: 2:00 AM – 5:00 AM
This is when the London session opens, and volume starts to pick up.
During this time, the price often:
- Grabs liquidity above or below the Asian range
- Sets the high or low of the day
- Begins the delivery of the day’s move
New York AM Kill Zone
Time: 7:00 AM – 10:00 AM
This is one of the most important Kill Zones. It includes the New York session open and overlaps with the end of the London session.
During this time, the price often:
- Makes sharp reversals
- Runs liquidity on one side and delivers in the opposite direction
- Shows clean ICT setups like FVGs and order blocks
London Close Kill Zone
Time: 10:00 AM – 12:00 PM
This marks the end of the London session.
During this time, traders may:
- Take profits
- Close positions
- Trigger reversals of earlier moves
This zone is often used for managing trades rather than entering new ones.
Indices Kill Zones (EST)
If you’re trading indices like the S&P 500 (ES) or NASDAQ (NQ), the Kill Zones shift slightly.
Asia Session
Time: 8:00 PM – 12:00 AM
This session is less relevant for indices but can still form an early structure.
London Kill Zone
Time: 2:00 AM – 5:00 AM
Low-volume session for indices, but still useful for observing how price interacts with liquidity formed in Asia.
New York AM Kill Zone
Time: 8:30 AM – 11:00 AM
This is the most important Kill Zone for indices. It includes the New York Stock Exchange open at 9:30 AM, where volume surges and large institutional orders hit the market.
Most intraday moves in indices begin or complete during this time.
New York PM Kill Zone
Time: 1:30 PM – 4:00 PM
This is the afternoon session, when the price may:
- Continue the morning move
- Reverse into the close
- Hit end-of-day liquidity levels
It’s useful for trade management or for experienced traders looking to fade or follow intraday direction.
Kill Zones don’t predict direction on their own. Instead, they tell you when the market is likely to move with purpose. The best trades often happen when your analysis (liquidity, structure, OBs, FVGs) aligns with the right Kill Zone window.
By focusing your attention on these specific times, you reduce noise and increase your odds of trading with smart money.
Key Takeaways
- Daily Bias helps you decide whether to focus on buys or sells. It’s based on how today’s candle closes compared to the previous day’s high and low.
- A bullish bias forms when price closes above the previous high or sweeps the low and closes back inside the range.
- A bearish bias forms when price closes below the previous low or sweeps the high and closes back inside.
- Use bias as a directional guide — it’s not always perfect. Always confirm with structure, liquidity, and entry models.
- Kill Zones are key times during the day when smart money is most active. These are when most valid ICT setups form.
- Focus on trading when the market is most likely to move, not all day. Timing + context improves win rate.

.png)
.png)
