Volume Profile is a market analysis tool that shows where the most buying and selling has happened at different price levels. Unlike traditional volume indicators that measure volume over time, the Volume Profile organizes volume by price, giving traders a clearer picture of where the market finds value and where it doesn’t.
Instead of just watching price movement, traders use Volume Profile to see the hidden layers of the market—where buyers and sellers have been most active, where price is likely to react, and which levels big traders have positioned themselves at.
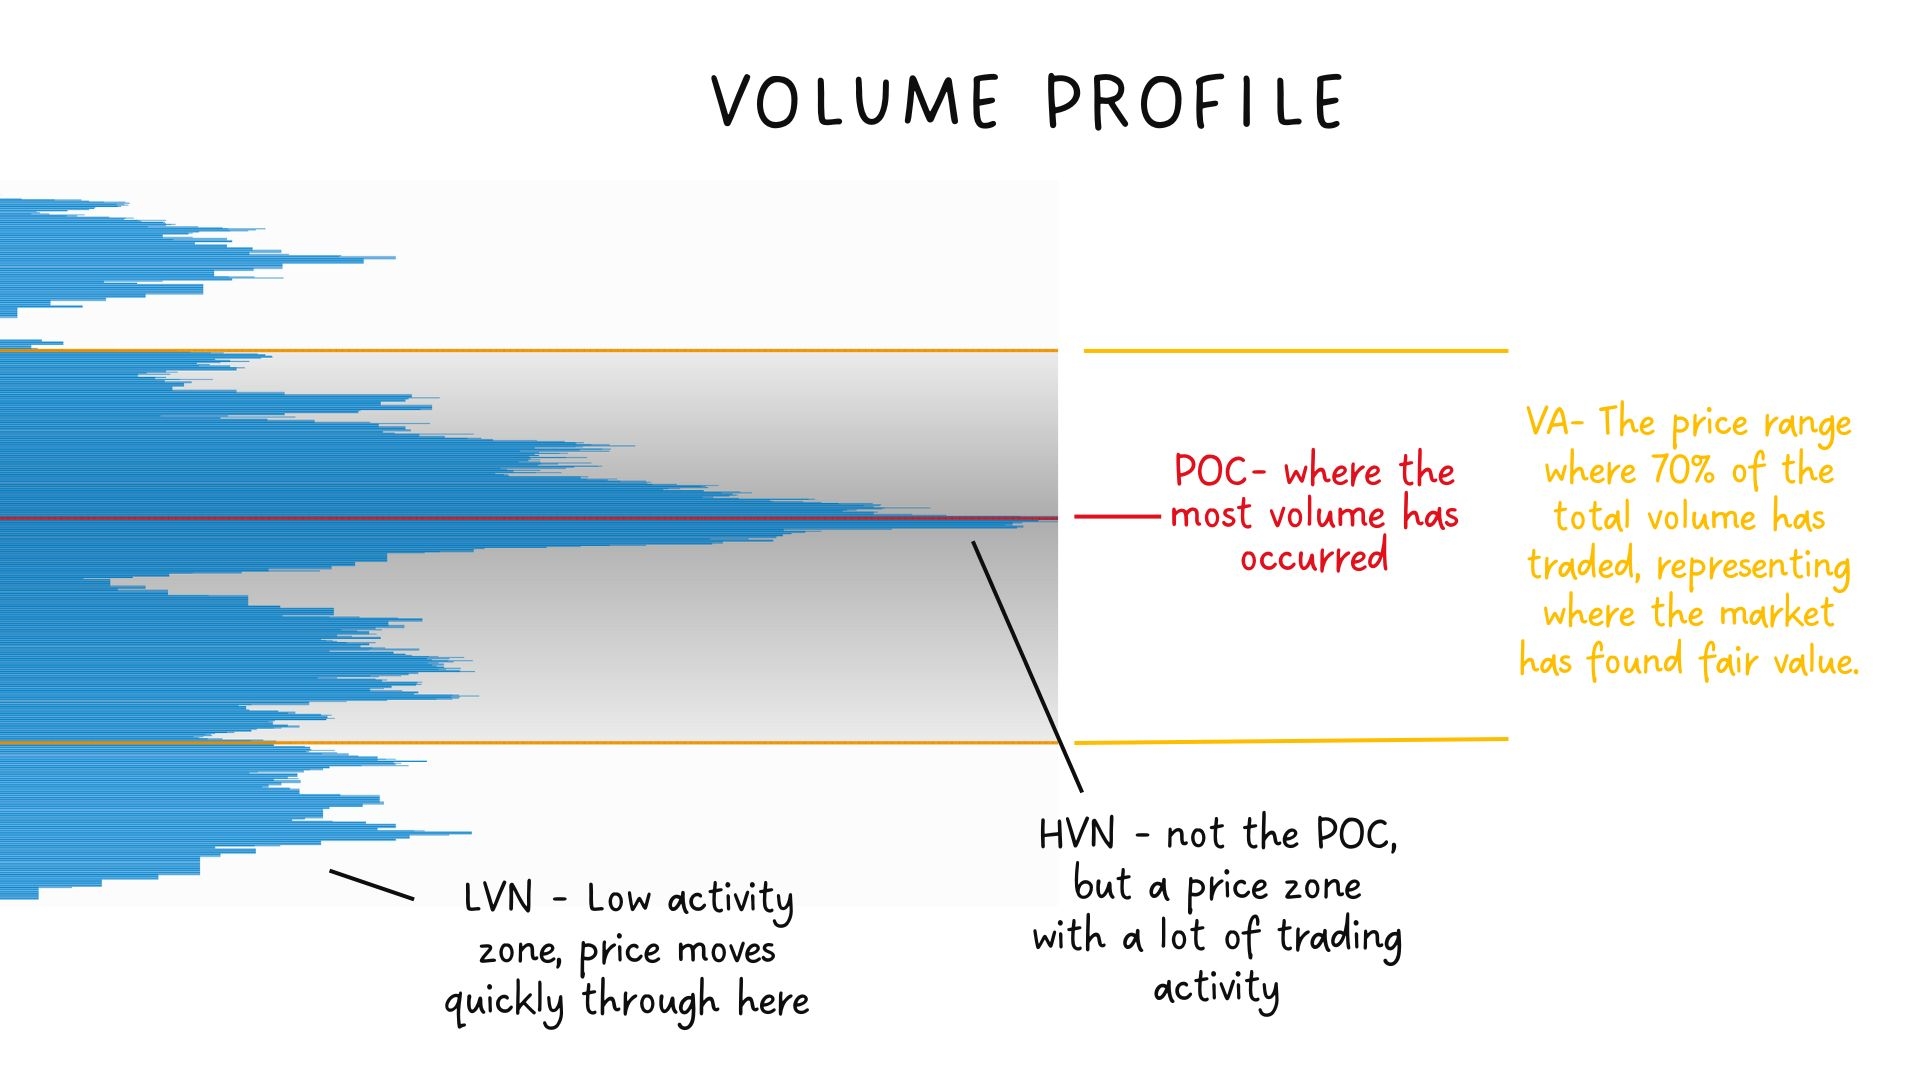
That's how the Volume profile looks on the chart.

Now, you might be wondering what all these lines mean on the chart.
No worries..
We’ll break it down step by step in the simplest way so you can read and understand the Volume Profile like a pro.
How Volume Profile Works
Volume Profile appears as a horizontal bar chart on the side of the price chart, showing the total trading volume at each price level. The market creates patterns of high and low activity, giving traders important clues about price behavior.
Key parts of Volume Profile:
Point of Control (POC): The price level where the most trading happened. This is where buyers and sellers were most active.
High Volume Nodes (HVN): Areas where a lot of trading takes place. These price levels act as strong support or resistance.
Low Volume Nodes (LVN): Areas where very little trading happened. Price tends to move quickly through these levels since there was little interest.
Value Area (VA): The range where 70% of all trading activity took place. This shows where the market considered the price to be fair.
Let's make it easier and see how it helps us
Understanding Volume Profile in Depth
Now that we’ve covered the basics let’s go deeper into how each part of the Volume Profile affects price movement and how traders use these levels to make better decisions.
Point of Control (POC)
Point of Control (POC) – The Most Traded Price
The Point of Control (POC) is the price level where the most trading happened. It represents the area where buyers and sellers were most active, making it an important reference point.
How Price Reacts to the POC:
Acts as a Magnet – Price often returns to the POC because it’s where the market found balance.
Support and Resistance – If the price moves away from the POC and comes back, it may find support or resistance.
Breakout Confirmation – If the price moves strongly above or below the POC and stays there, it may signal a new trend.
See the image below.

When the price is near the POC, the market is usually balanced. Strong moves away from it suggest that buyers or sellers are in control.
High Volume Nodes (HVN)
High Volume Nodes (HVN) – Areas of Stability
High Volume Nodes (HVNs) are price levels where a lot of trading took place. These areas show strong interest from buyers and sellers, making them important for identifying key price levels.
How Price Reacts to HVNs:
Price Slows Down – Since a lot of trading happened here, the price tends to pause or consolidate.
Acts as Support and Resistance – If price approaches an HVN from above, it may act as support. If the price comes from below, it may act as resistance.
Continuation Zones in Trends – In a strong trend, the price may pull back to an HVN before continuing in the same direction.
See the image below

HVNs are areas where the price is comfortable. Since traders have already agreed on value here, price often moves slowly when it returns to these zones.
Low-Volume Nodes (LVN)
Low-Volume Nodes (LVN) – Fast Price Moves
Low Volume Nodes (LVNs) are price levels where very little trading happened. These areas usually mean that traders didn’t see much value at those prices, so price moves through them quickly.
How Price Reacts to LVNs:
Fast Moves – Price often moves quickly through LVNs because there isn’t much interest in trading at those levels.
Breakout Confirmation – If the price enters an LVN and keeps moving, it is likely to continue to the next high-volume area.
Weak Support and Resistance – Unlike HVNs, LVNs do not offer strong price stability.
See the image below

LVNs act like gaps in the market. Since there wasn’t much activity here before, the price doesn’t have many obstacles when it moves through them.
Value Area (VAH & VAL)
Value Area (VAH & VAL) – Where Most Trading Happens
The Value Area (VA) is the range where 70% of all trading volume takes place. It includes:
Value Area High (VAH) – The highest price level inside the value area. It can act as resistance.
Value Area Low (VAL) – The lowest price level inside the value area. It can act as support.
How Price Reacts to the Value Area:
Inside the Value Area – If the price is within the value area, it is in balance and may continue to move sideways.
Breaking Above VAH – If the price moves above VAH and stays there, it may continue to rise.
Breaking Below VAL – If the price moves below VAL and stays there, it may continue to fall.

If the price moves outside the value area and quickly returns, it suggests that traders do not accept the higher or lower prices, and the price may move back to the POC.
How to Use Volume Profile in Trading
Now that you understand how each part of the Volume Profile works, here’s how to apply it in trading:
- Watch HVNs and LVNs – Use HVNs for support and resistance and LVNs for breakout trades.
- Use the POC as a reference. If the price is trending, a pullback to the POC can be a good place to look for a trade.
- Observe how price reacts at the Value Area – If price stays inside, it may continue ranging. If it moves outside and holds, a new trend may begin.
By using the Volume Profile, traders can understand where price is likely to slow down, move quickly, or reverse. This helps in making better trading decisions based on real market activity rather than guessing.
Key Takeaways
- Volume Profile is a tool that shows how much trading occurred at each price level rather than over time. It helps traders understand where the market considers price to be fair or unfair.
- The Volume Profile appears as a horizontal histogram alongside the price chart, showing high and low interest at different prices.
- Point of Control (POC) is the price level with the highest volume. It acts as a magnet for price, often becoming a key support or resistance zone.
- High Volume Nodes (HVNs) are areas where a lot of trading occurred. These levels create strong support or resistance and are commonly revisited by price.
- Low Volume Nodes (LVNs) are areas with very little trading activity. Price tends to move quickly through these zones because traders showed little interest in them.
- Value Area (VA) represents the range where 70 percent of all volume was traded. It includes:
- Value Area High (VAH) which can act as resistance.
- Value Area Low (VAL) which can act as support.
- Value Area High (VAH) which can act as resistance.
- Price inside the value area suggests balance or consolidation. Moves outside the value area may indicate trend development, especially if price holds outside of VAH or VAL.
- Volume Profile helps traders:
- Identify key levels where price may react.
- Understand where liquidity is concentrated.
- Spot potential reversal, continuation, or breakout zones.
- Identify key levels where price may react.
Using Volume Profile allows traders to make decisions based on real trading activity instead of relying only on indicators or patterns. It helps reveal the structure beneath the surface of price action.


