Built For
Instruments: Futures
Trading Style: Day Trading
Strategy Overview
This is built around the idea that markets move through three repeating phases: Accumulation, Manipulation, and Distribution (AMD). The focus is to observe how price builds liquidity (Accumulation), how it sweeps stops to trap traders (Manipulation), and then to enter trades only when the real move confirms itself in the Distribution phase, not during the Manipulation sweep itself.
The main goal is to protect trading capital and mental energy by avoiding low-quality, range-bound conditions and participating only when the market provides clear, high-probability directional moves during the Distribution phase. By recognizing these phases and aligning trades with clean market structure, this approach helps traders stay on the right side of liquidity, focus on strong risk-to-reward setups, and maintain discipline across different market environments.
This approach filters out chop and indecision by using major news events and a clear structure to decide when to stand aside and when to engage.
The best setups appear when price sweeps liquidity just before a big move, often around releases like CPI, FOMC, or NFP, and then confirms direction with clear displacement on a higher timeframe and a valid retracement on the lower timeframe. If no clean structure or catalyst is present, the safest trade is no trade.
Core concept
Accumulation: Price moves sideways, builds liquidity, and traps traders in chop. This phase is difficult to trade and often leads to stop-outs.
Manipulation: A sharp move that sweeps liquidity above or below a range. This move traps traders on the wrong side of the market and sets up the real directional leg. Manipulation is harder to trade directly — the focus is to wait for confirmation that it has happened.
Distribution: The cleanest phase to trade. After Manipulation sweeps liquidity, price breaks with intent and trends toward a clear target, such as equal highs or lows or a higher timeframe imbalance. This phase offers strong follow-through and higher reward-to-risk setups.
.jpg)
Displacement:
A valid setup requires clear displacement — a strong break of a swing high or low that leaves a fair value gap behind. If price respects that gap on a retrace, the move is valid.
Timeframe Alignment:
Use higher timeframes (1H, 4H, Daily) to spot the big picture: the draw on liquidity, key levels, and major FVGs.
Use lower timeframes (1m, 5m, 15m) to confirm displacement, find fair value gaps, and refine entries. If the higher timeframe is unclear, do not force a setup on a lower timeframe.
High vs. Low Probability Days
Low Probability Days:
- No major high-impact news.
- Bank holidays or the day after a holiday.
- The day before big news like CPI, FOMC, or NFP.
- The day after a large move that already tapped a major target.
- Price has jagged highs and lows with no clear direction.
High Probability Days:
- Major scheduled news: CPI, NFP, GDP, FOMC, PPI.
- Strong sweep of liquidity clearing obvious stops.
- Clean displacement and fair value gaps are visible on higher timeframes.
- High-probability setups usually appear during the New York session after the news, not during the spike.
Strategy Rules
Check the Economic Calendar
Look for high-impact news that could drive clean moves.
Check Market Correlation
Make sure related markets (e.g., NASDAQ and S&P) are aligned. If they diverge heavily, conditions are lower in probability.
Identify the Draw on Liquidity
There must be a clear target: equal highs/lows, an unfilled fair value gap, or a clean swing point. If there’s no obvious destination, do not trade.
Look for Displacement
Wait for price to break a key high or low with force, leaving a fair value gap behind. This shows the market has intent.
Entry and Risk Rules
- Enter on the retrace into the valid fair value gap.
- Take partial profits at logical targets (swing levels or next FVG).
- Trail stops to protect profits when the price confirms the move.
- If there’s no retracement, skip the trade — never chase.
Execution Rules
- Limit yourself to two trades per session. If you take two losses, step away for the day.
- Size down on days before major news or during known accumulation phases.
- Respect the “macro windows” — strong moves often happen around 9:50–10:10 and 10:50–11:10 Eastern Time.
- If conditions show no clear bias or structure, stand aside.
- Focus on discipline: sometimes sitting out protects more profit than forcing a trade.
Pros and Cons of the Strategy
This Strategy is designed to deliver high-quality, repeatable setups — but like any trading strategy, there are key things to understand before using it.
Note: The cons listed here aren’t disadvantages. They are things to be aware of — important characteristics that require patience, discipline, and proper management to make the model work effectively.
Pros
- Provides a simple daily filter to separate good and bad days.
- Helps avoid chop and wasted trades in low-quality conditions.
- Makes it easier to wait for clean, strong moves with clear targets.
- Builds discipline and patience — no more forcing trades every day.
- Gives more confidence to hold for bigger wins when the structure is right.
Cons (Things to Be Aware Of and Manage)
- Some big moves won’t pull back — easy to miss trades.
- Waiting through slow days can test patience.
- Missed setups can cause FOMO if not managed.
- Setups can still fail — stops and risk rules matter.
- Discipline is non-negotiable; the plan only works if followed.
Trade Breakdown
Example Trade: CPI Short
Context
- CPI news released at 8:30 AM ET
- Futures: Nasdaq (NQ)
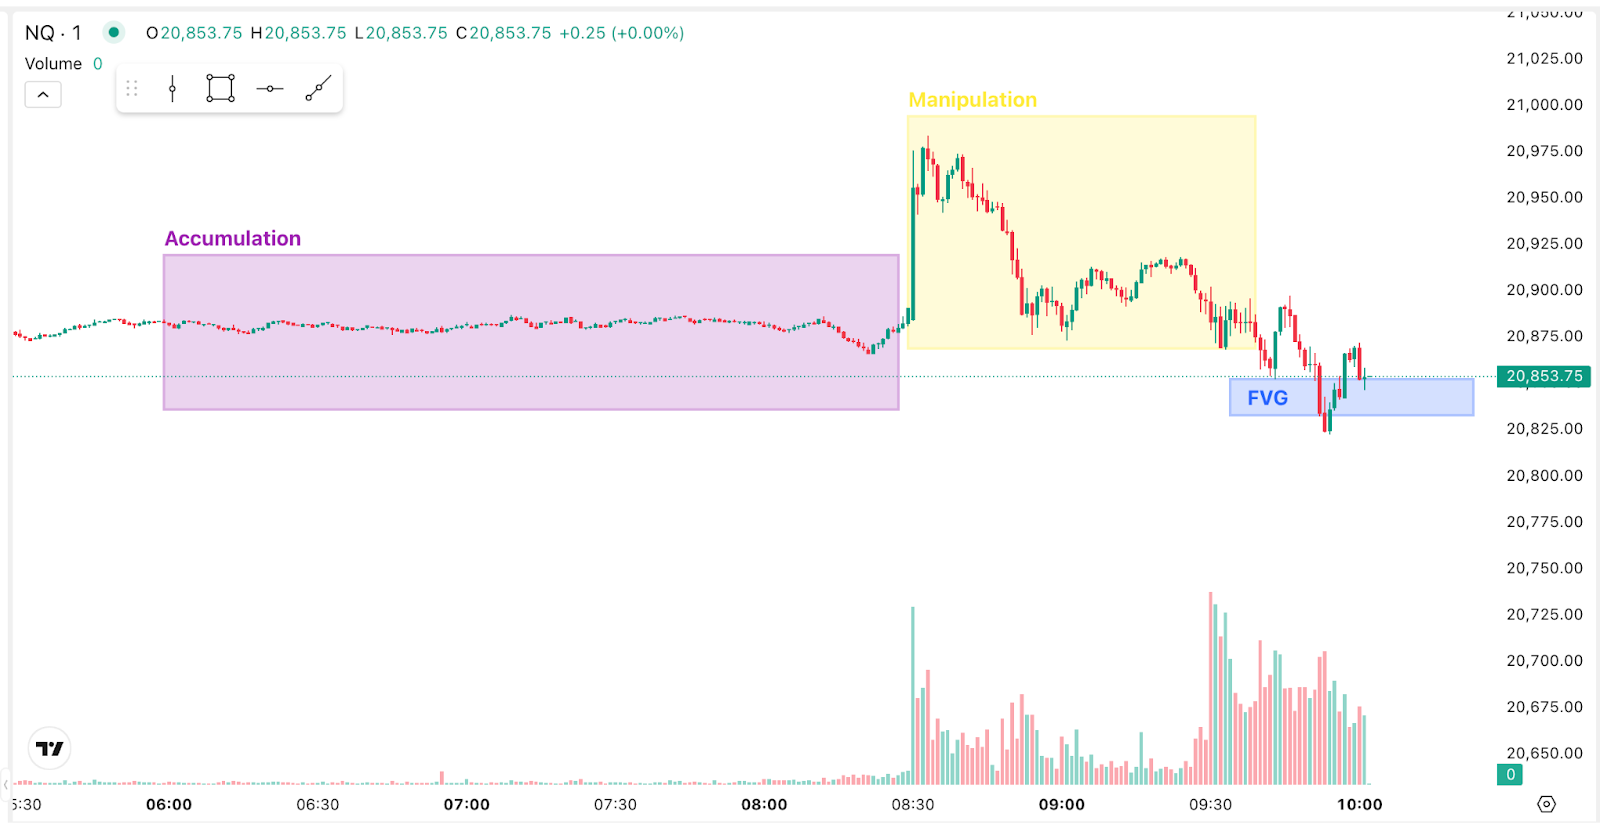
Accumulation
Price ranged sideways before the news, building liquidity above and below the pre-market range.
Manipulation
At the news release, the price spiked up sharply, sweeping stops above the range and trapping breakout buyers.
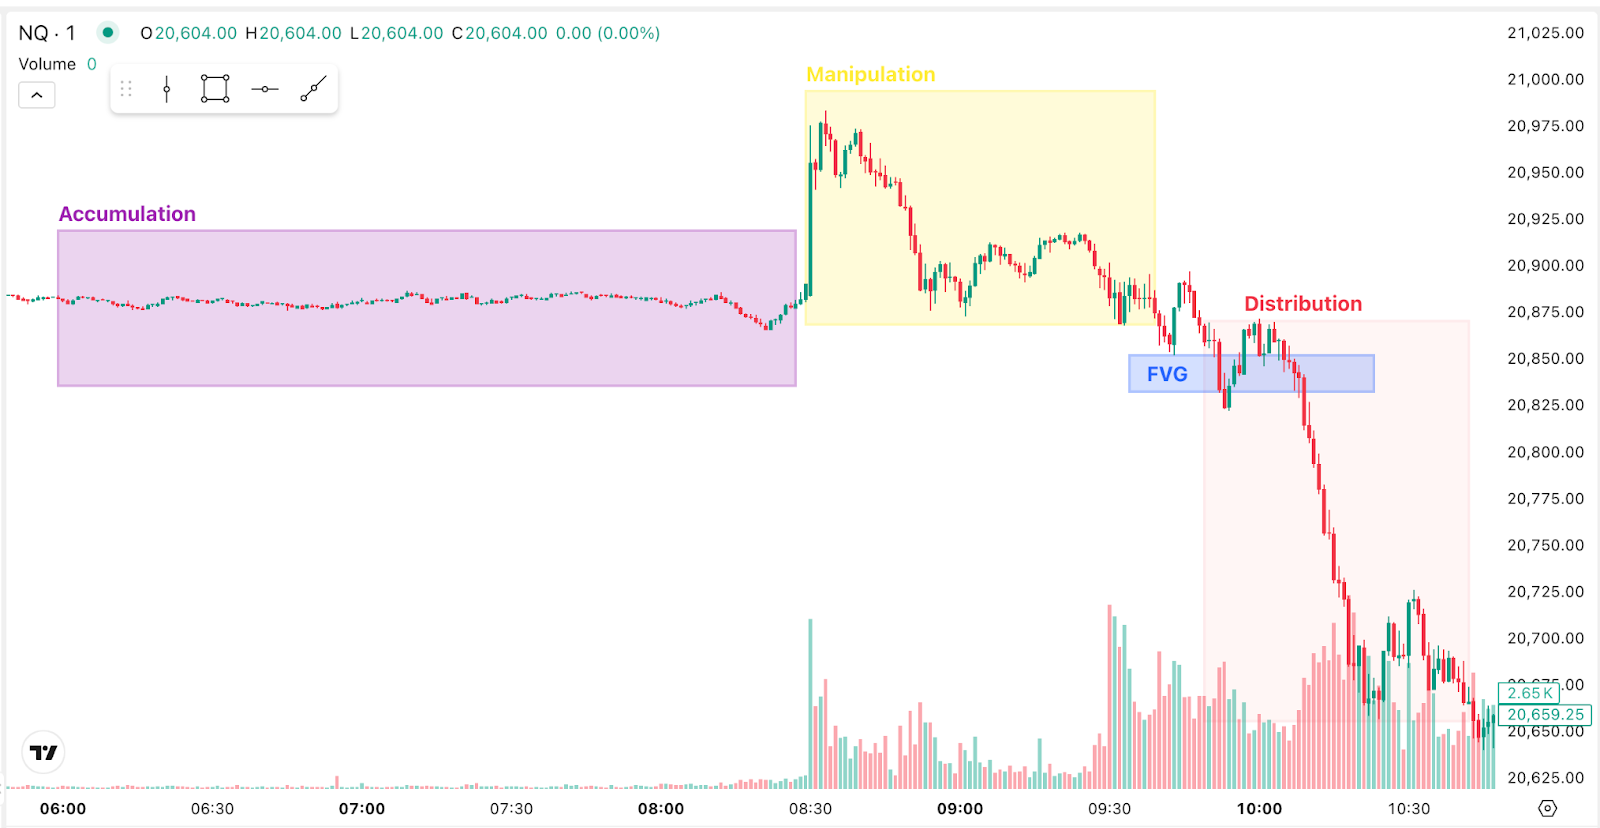
Distribution
After the spike, the price broke below a key pre-market swing low with strong momentum, leaving a bearish fair value gap. This confirmed that the real move was lower.
Execution
- Entered short on the retracement into the fair value gap.
- Stop loss placed above the high of the manipulation spike.
- Target: pre-market lows and equal lows under the range.
- The partial profit taken.
- Stop moved to protect gains as the price continued lower.
Result
A clean short trade in the Distribution phase: clear range, Manipulation sweep, confirmed break, and precise retrace entry. The move delivered around 100 points on Nasdaq futures within minutes
How to Backtest This AMD Model
You can test this AMD model before risking real money using TradeZella's backtesting. Load 11+ years of historical data, use the 1H, 4H, and Daily charts to map the draw on liquidity and key levels, then drop to the 1-minute, 5-minute, or 15-minute charts and replay the session bar by bar. Identify the accumulation range, wait for the manipulation sweep to trap traders, then look for displacement that breaks a key high or low and leaves a fair value gap behind. Enter on the retrace into that gap with automatic position sizing, place your stop beyond the manipulation extreme, and trail it as price confirms the distribution move toward equal highs or lows or a higher timeframe imbalance. Every backtested trade gets logged automatically with your entry, exit, position size, and P&L. Add notes on the phase and catalyst, tag mistakes, and review the session the same way you would a live trading day. After 30 to 50 trades, you can see your win rate, profit factor, and expectancy on this specific setup, giving you a real picture of how it is likely to perform in live market conditions before you risk a dollar.
When you start trading live, import your live trades into TradeZella, the AI trading journal that does the journaling for you. Your backtest results and live results live in the same platform, so you always know how the strategy performs in testing vs how it performs with real money, without switching between tools or maintaining separate spreadsheets.
TradeZella is also introducing automated no-code backtesting, where you define your rules and run the backtest, and then it shows you how the strategy would have performed over years of historical data without you needing to step through a single chart.
Start Backtesting This Strategy Using TradeZella
Frequently Asked Questions
What is the AMD model?
The AMD model is a day trading strategy built around the idea that markets move through three repeating phases: Accumulation, Manipulation, and Distribution. The approach is to watch price build liquidity in accumulation, sweep stops to trap traders in manipulation, and then enter only when the real move confirms in the distribution phase. It filters out chop by trading mainly around major news events with clean structure, and when no clear catalyst or structure is present, the safest trade is no trade.
What are the Accumulation, Manipulation, and Distribution phases?
Accumulation is when price moves sideways, builds liquidity, and traps traders in chop, which is difficult to trade. Manipulation is a sharp move that sweeps liquidity above or below the range, trapping traders on the wrong side and setting up the real leg. Distribution is the cleanest phase to trade: after the sweep, price breaks with intent and trends toward a clear target like equal highs or lows or a higher timeframe imbalance, offering strong follow-through and better reward-to-risk.
What is displacement and a fair value gap?
Displacement is a strong break of a swing high or low that shows the market is moving with intent and leaves a fair value gap behind it. A fair value gap is the imbalance created by that fast move. A valid AMD setup requires clear displacement, and if price respects the fair value gap on a retrace, the move is considered valid and becomes the entry. If there is no retracement into the gap, you skip the trade rather than chase.
What makes a high-probability vs low-probability day?
High-probability days have major scheduled news like CPI, NFP, GDP, FOMC, or PPI, a strong liquidity sweep clearing obvious stops, and clean displacement and fair value gaps visible on higher timeframes, with the best setups usually appearing in the New York session after the news rather than during the spike. Low-probability days have no major news, fall on or around holidays, sit the day before big releases, or show jagged highs and lows with no clear direction. On those days the model says to size down or stand aside.
What instruments and timeframes does this strategy use?
The AMD model is built for futures, often index futures like the Nasdaq (NQ), where news-driven liquidity sweeps and displacement are clear and consistent. It uses higher timeframes, the 1-hour, 4-hour, and Daily, to spot the draw on liquidity, key levels, and major fair value gaps, and lower timeframes, the 1-minute, 5-minute, and 15-minute, to confirm displacement and refine entries. If the higher timeframe is unclear, you do not force a setup on a lower timeframe.
Can I backtest the AMD model?
Yes. You can test this strategy using TradeZella's backtesting with 11+ years of historical futures data. Replay the session bar by bar, map the draw on liquidity on the higher timeframes, identify the accumulation range, wait for the manipulation sweep and displacement, then enter on the retrace into the fair value gap. Every trade logs automatically with entry, exit, position size, and P&L. Add notes on the phase and catalyst, tag mistakes, and review the session the same way you would a live trading day. After 30 to 50 trades you can see your win rate, profit factor, and expectancy on this specific setup before risking real money.
What is TradeZella backtesting?
TradeZella backtesting lets you replay 11+ years of historical market data across forex, futures, stocks, and crypto and place trades as if you were trading live. Set up your timeframes the way you trade, use automatic position sizing, drag your stop and target directly on the chart, and every trade gets logged automatically with your entry, exit, position size, and P&L. TradeZella is also introducing automated no-code backtesting, where you define your strategy rules in plain English and the engine runs them across years of historical data, showing every individual trade executed with the results without you needing to do anything.