


Built For
Instruments: Stocks/Options
Trading Style: Day Trading
Strategy Overview
This Strategy is built around one simple idea: stocks that go up like a rocket almost always come back down. The First Red Day setup focuses on finding a stock that has run up big for multiple days in a row and then catches the first day it closes red. That’s the day when momentum shifts, late buyers get stuck, and the drop can be fast and big.
This setup is repeatable because people always get greedy and chase at the top. This Strategy breaks down exactly when and how to take advantage of that.
What This Setup Looks For
- A stock that moves up big for at least three days in a row. The bigger and faster the move, the better.
- A parabolic move, not just a slow trend up.
- The first day, it goes red compared to the previous day’s close.
- The cleanest setups gap up on the last day, push higher, then break red intraday.
- Sometimes the stock gaps down on the First Red Day instead — in that case, look for a bounce that fails near the previous close.
Strategy Rules
Confirm the Run
Look for a clear multi-day move. One green day is not enough. Two days is not enough. Three or more strong days, ideally with each day stronger than the last, is what you want. The run should look extended, stretched, with hype behind it.
Do Not Anticipate
Do not short too early just because you think it should come down. Many people lose by guessing. The key is waiting for confirmation — the stock must go red.
Mark the Previous Day’s Close
Draw a line at the previous day’s close. This is your key level. The trade does not start until the price goes under that line.
Plan for Two Ways It Can Set Up
- If it gaps up, best case. If it pushes higher at the open and then starts to fade, wait for it to break under the previous close. That’s the entry.
- If it gaps down, watch for a bounce back toward the previous close. If that bounce fails and price rejects that level, that’s your entry.
Starter and Add
Some traders use a small starter position if they see weakness setting up. But the main size is only added when the price confirms the break below red to green.
Stop Loss
Your entire idea depends on the stock going red and staying red. If the price reclaims the previous day’s close and holds above it, the setup is invalid. Cut the trade immediately
Take Partial Profits
As the stock drops, lock in gains by covering portions of your position into the weakness. Taking profits into the flush reduces stress and protects you if the stock bounces. If a bounce comes but the price stays under the previous close, you can re-enter or add size when the bounce fails.
Hold a Position
If the move is clear and momentum is broken, hold a small portion of the trade to catch any further drop. Once these overextended moves roll over, they often stay weak for days or weeks. Keeping a position lets you stay in the move without putting on more risk.
Why It Works
- Greed traps late buyers. Everyone thinks it will keep going forever.
- When momentum stalls, everyone who bought late wants out at once.
- Many stocks do dilutive offerings when extended, which adds selling.
- The panic builds on itself — the faster it drops, the more people sell.
- This setup keeps working because people always get greedy.
Pros and Cons of the Strategy
This Strategy is designed to deliver high-quality, repeatable setups — but like any trading strategy, there are key things to understand before using it.
Note: The cons listed here aren’t disadvantages. They are things to be aware of — important characteristics that require patience, discipline, and proper management to make the strategy work effectively.
Pros
- Easy to Spot: The setup is easy to find. You just look for a stock that is up big for multiple days and wait for the first red day.
- Easy to Execute: There is a clear signal. You wait for the stock to trade below the previous day’s close. You don’t have to overthink or guess. You have the red-to-green line — that’s it.
- High Profit Potential:When the drop starts, it can move fast. A stock that runs up for days can give back a big chunk in one day. There’s a lot of room to make solid money if you catch it right.
- Works in Any Market: Human nature does not change. Greed repeats over and over. It works whether the market is up, down, or sideways. People always chase big moves.
- Clear Rules: You know when you’re right and you know when you’re wrong. If the stock goes red and stays red, you have a valid setup.
- Scalable: You can trade this with shares or with options if the stock has liquid options. With options, the return can be even bigger when the timing is right.
Cons
- Requires Patience: It does not happen every day. Sometimes you wait weeks or months for a clean setup. If you try to force it on small moves, you get chopped up.
- Easy to Jump Too Early: Many traders anticipate the top instead of waiting for the break. If you get in too soon and the stock keeps going, you lose or get squeezed out.
- Can Be Hard to Hold: The drop can bounce. If you do not take some off, you might panic when the price bounces back. Many traders cover too soon and miss the big part.
- Emotion Can Ruin It: If you miss it, you can get FOMO. If you mess up the first one, you might try to force the next trade. It is easy to break your plan if you are not patient.
- Must Respect the Stop: If the stock reclaims the red-to-green level and holds, you have to get out. Some traders hold and hope, then the loss grows fast.
- Gap Downs Have Less Room: If it gaps down instead of up, it can still work, but sometimes you don’t get as much range if you wait too long.
- Position Sizing Matters: If you go too big too soon, you might not be able to add size when it comes. The real edge is being able to scale in at the right spot.
Trade Breakdown
Trade Example — SMCI
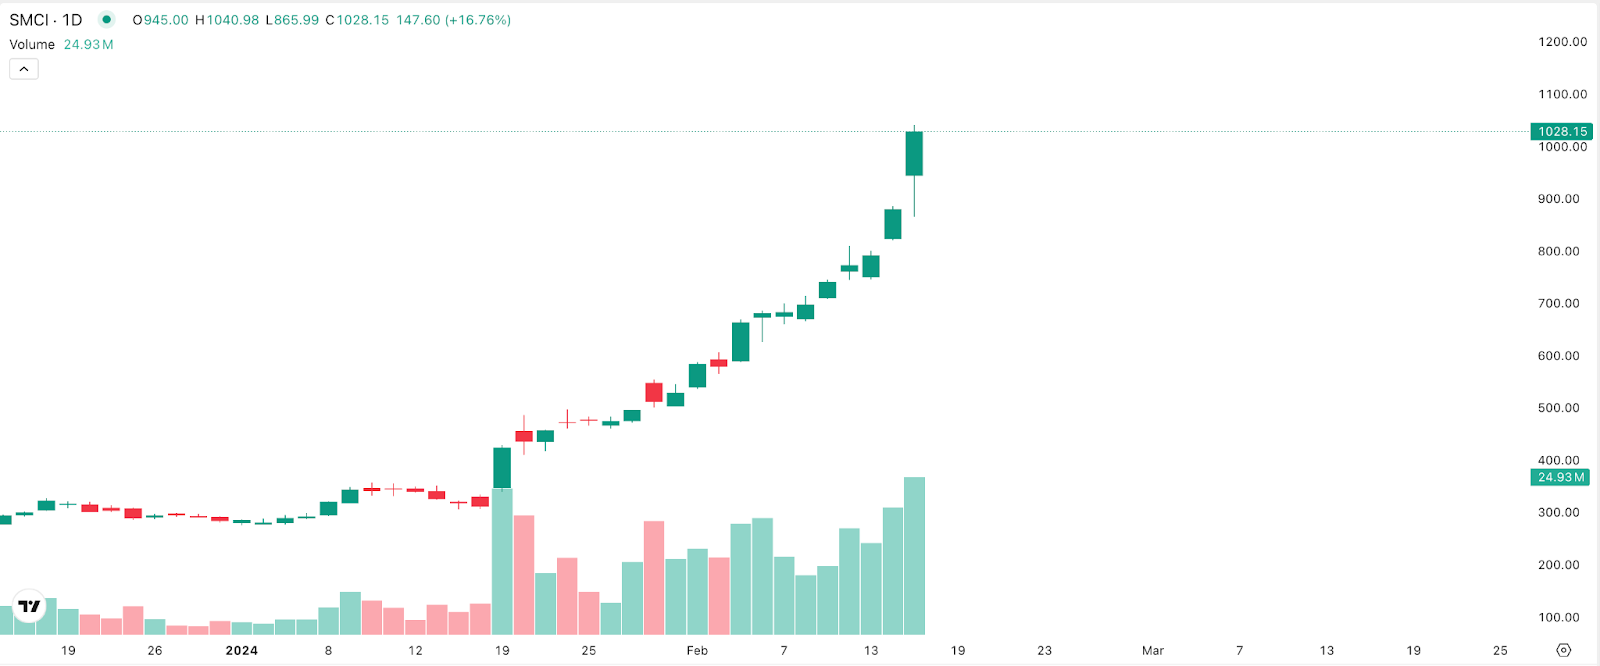
Context: Big multi-day run with strong green days in a row. Stock gapped up again after multiple days of extension.
Plan: Wait for the stock to break below the previous day’s close. Mark the red-to-green line as the key level.
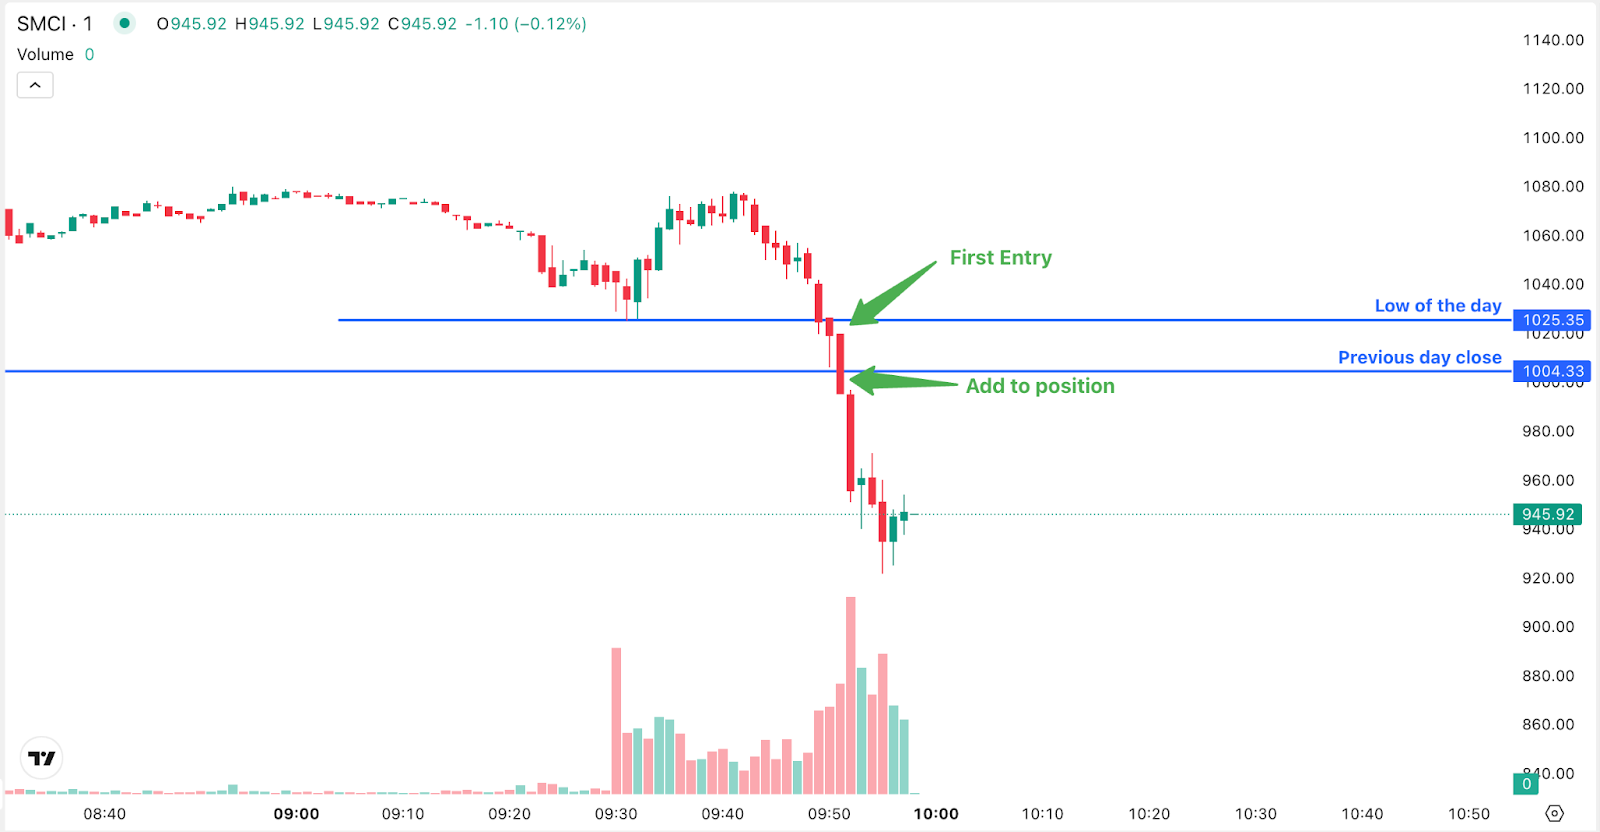
Entry:
- Opened with a small position when the stock broke below the low of day early.
- Added main size when the stock broke below the previous day’s close to confirm the First Red Day.
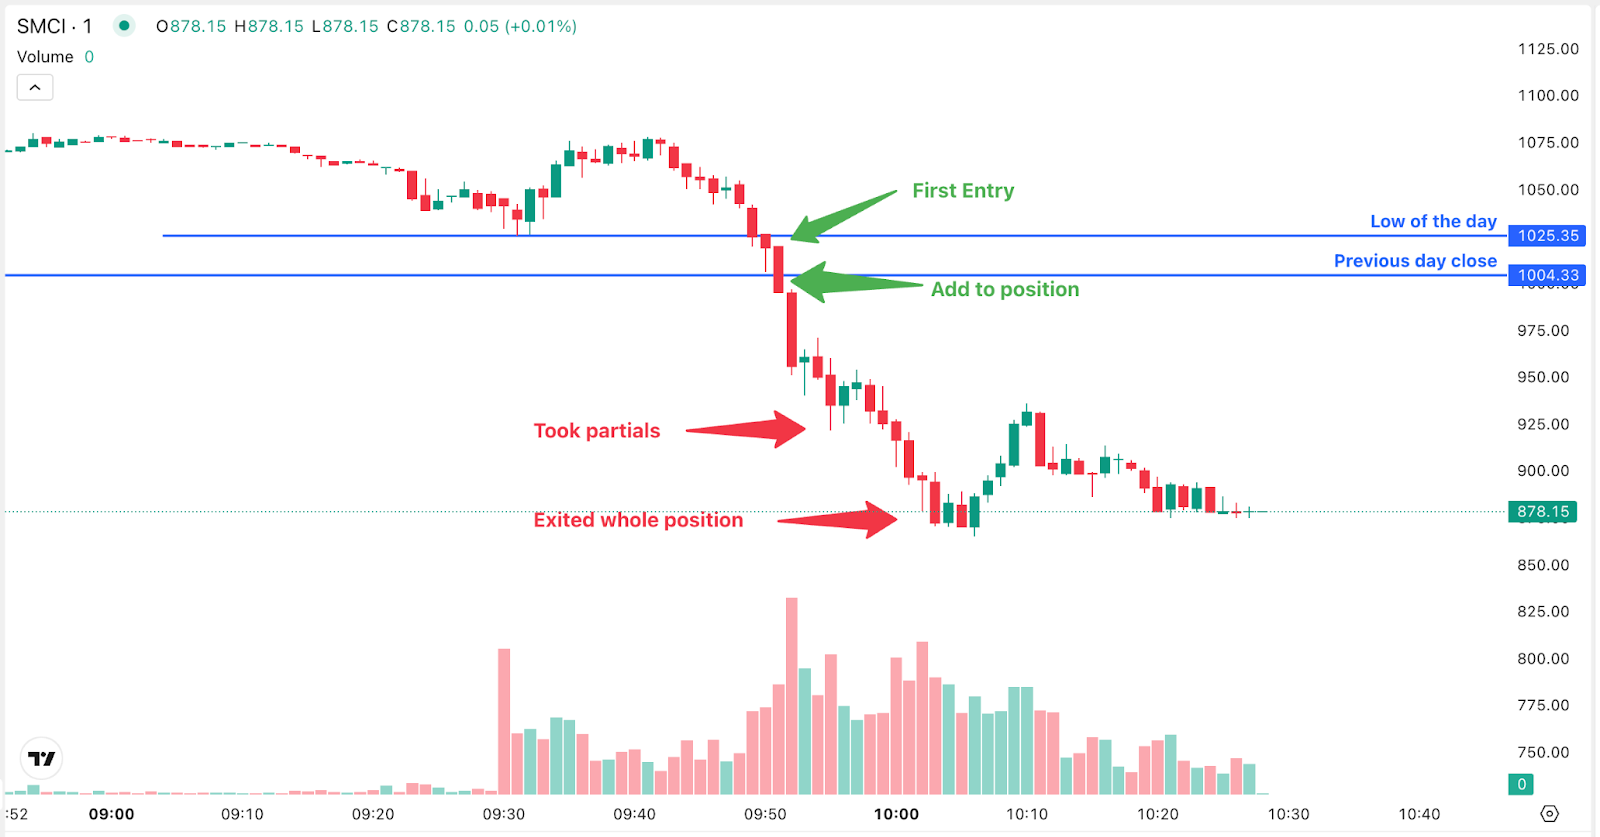
Move: After breaking the red-to-green line, the price dropped about $30 per share quickly. Partial were taken into the drop to lock in profit.
Details:
The stock opened with a gap up and showed strength at first.
- The early sign of weakness was the break below the day’s low — the first starter entry.
- The confirmation entry came when it broke under the previous close — the main signal for this setup.
Result: Profit locked in around $50,000 on this trade.
How to Backtest This First Red Day Strategy
You can test this First Red Day strategy before risking real money using TradeZella's backtesting. Load 11+ years of historical data, set up your daily and intraday charts the way you trade live, and replay sessions bar by bar. Find a stock that has run up parabolically for three or more days, mark the previous day's close as your red-to-green line, then wait for price to break below it to confirm the first red day. Take a small starter on the early break of the day's low if you see weakness, add your main size when price breaks below the previous close, place your stop above that level, and cover into the flush. Use automatic position sizing and drag your stop and target directly on the chart. Every backtested trade gets logged automatically with your entry, exit, position size, and P&L. Add notes on what you saw, tag mistakes, and review the session the same way you would a live trading day. After 30 to 50 trades, you can see your win rate, profit factor, and expectancy on this specific setup, giving you a real picture of how it is likely to perform in live market conditions before you risk a dollar.
When you start trading live, import your live trades into TradeZella, the AI trading journal that does the journaling for you. Your backtest results and live results live in the same platform, so you always know how the strategy performs in testing vs how it performs with real money, without switching between tools or maintaining separate spreadsheets.
TradeZella is also introducing automated no-code backtesting, where you define your rules and run the backtest, and then it shows you how the strategy would have performed over years of historical data without you needing to step through a single chart.
Start Backtesting This Strategy Using TradeZella
Frequently Asked Questions
What is the First Red Day strategy?
The First Red Day strategy is a short setup that targets overextended stocks that have run up for several days and finally close red, signaling a momentum shift. The idea is simple: stocks that go up like a rocket almost always come back down. You wait for the first day a parabolic runner trades below the prior day's close, which traps late buyers and often leads to a fast, sharp drop. It is repeatable because traders always get greedy and chase at the top.
What is the red-to-green line?
The red-to-green line is the previous day's closing price, and it is the key level for this setup. You draw a line at that close, and the trade does not start until price trades under it. As long as price holds below the line, the stock is red on the day and the setup is valid. If price reclaims that level and holds above it, the idea is invalid and you cut the trade immediately.
How do you enter the First Red Day setup?
There are two ways it sets up. If the stock gaps up, the best case, you wait for it to push higher at the open, start to fade, and break below the previous close, and that break is your entry. If it gaps down instead, you watch for a bounce back toward the previous close, and if that bounce fails and rejects the level, that is your entry. Some traders take a small starter on early weakness, but the main size is only added once price confirms the break below the red-to-green line.
What makes a valid First Red Day setup?
You want a clear, extended move, not a slow trend. One or two green days is not enough; look for three or more strong days in a row, ideally each stronger than the last, with a parabolic, hyped-up move. The cleanest setups gap up on the last day, push higher, then break red intraday. The most important rule is not to anticipate the top: you wait for the stock to actually go red before taking the trade.
What instruments does this strategy use?
This is a day trading short strategy for stocks, and it can also be traded with options when the stock has liquid options, where the return can be even bigger with the right timing. It works in any market because human nature does not change and greed repeats over and over. The best candidates are parabolic, overextended runners, which often stay weak for days or weeks once they roll over, sometimes helped by dilutive offerings while the stock is extended.
Can I backtest the First Red Day strategy?
Yes. You can test this strategy using TradeZella's backtesting with 11+ years of historical data. Replay sessions bar by bar, find a multi-day parabolic runner, mark the previous day's close as your red-to-green line, and take the short once price breaks and holds below it. Every trade logs automatically with entry, exit, position size, and P&L. Add notes, tag mistakes, and review the session the same way you would a live trading day. After 30 to 50 trades you can see your win rate, profit factor, and expectancy on this specific setup before risking real money.
What is TradeZella backtesting?
TradeZella backtesting lets you replay 11+ years of historical market data across forex, futures, stocks, and crypto and place trades as if you were trading live. Set up your timeframes the way you trade, use automatic position sizing, drag your stop and target directly on the chart, and every trade gets logged automatically with your entry, exit, position size, and P&L. TradeZella is also introducing automated no-code backtesting, where you define your strategy rules in plain English and the engine runs them across years of historical data, showing every individual trade executed with the results without you needing to do anything.