Built For
Instruments: Forex/Futures/Crypto
Trading Style: Swing Trading
Playbook Overview
This playbook is built around a simple, top-down price action framework designed to help you find high-probability trades by following the trend and entering at the most optimal time, during a pullback into a key area of interest.
The core idea is this: price moves in swings, and when a break of structure (BOS) occurs on the higher timeframe (HTF), the market often pulls back into the zone that caused that move, known as a Point of Interest (POI). That’s where this strategy helps you step in and catch the next leg of the trend.
We start by identifying a clean market structure break on the higher timeframe, such as the daily or weekly chart. From there, we mark out the POI that led to the break, typically an Order Block (OB) or Breaker Block. This POI becomes the zone where we expect the next higher low (in an uptrend) or lower high (in a downtrend) to form.
Once price pulls into the POI, we drop to the lower timeframe (like H1 or M15) and wait for a confirmation entry, often using a breaker setup — a failed move that sweeps liquidity and then reclaims structure. This entry method gives us clear risk and validation levels, with stops placed below or above the liquidity sweep.
The goal is simple:
- In an uptrend, buy the higher low that forms inside the Point of Interest (POI).
- In a downtrend, sell the lower high within the Point of Interest (POI).
This approach keeps you trading in the direction of the higher timeframe, while entering at a discount (for longs) or premium (for shorts) — where smart money is most likely active.
It’s designed to work across all markets (crypto, forex, futures) and timeframes using a top-down approach with two or more timeframes.
By combining structure, liquidity, and timing into one simple process, this framework removes the noise and keeps you focused on the highest probability part of the move: the pullback into the POI where the next expansion is likely to begin.
Playbook Criteria
This setup is only valid when all the following conditions are met:
Timeframes
Use two timeframes:
- High Timeframe (HTF) – for trend, bias, and range (Weekly, Daily, H12, H4)
- Low Timeframe (LTF) – for execution and entry setup (H1, M15, M5)
Examples:
- HTF: Daily → LTF: H1
- HTF: H4 → LTF: M15
Top-Down Analysis: Define the Trend
- Identify the high time frame (HTF) trend (e.g., weekly/daily).
- Use the HTF swing structure to confirm if the price is in an uptrend or a downtrend.
- Must see a clear market structure break (MSB) to define the new trading range.
Mark the HTF Range
- From the last significant swing low to swing high (in an uptrend) or swing high to swing low (in a downtrend).
- Mark the 50% line (midpoint) to distinguish between premium and discount.
- In an uptrend, we want to buy at a discount (lower half of the range).
- In a downtrend, we want to sell in the premium (upper half of the range).
Identify the Point of Interest (POI)
- Use the HTF to mark:
- Order Block (OB).
- It can also be a Breaker Block or Fair Value Gap.
- This is where you’ll look for trades when the price pulls back.
Look for Entry on Lower Timeframe (LTF)
- Drop to your execution timeframe (e.g., H1 or M15).
- Inside the POI, wait for:
- Engineered liquidity (a swing low or high).
- A stop run (sweep of that liquidity).
- A market structure break in the opposite direction (a breaker setup).
Trade Execution
- Enter on the breaker block after the MSB on LTF.
Stop-Loss:
- Below the low that got swept (for longs) or above the high (for shorts).
Target:
- The next HTF external liquidity is the previous swing high (for longs) or swing low (for shorts).
Risk/Reward
- Must be at least 2:1 RR to qualify.
- Only take setups that meet or exceed this risk-to-reward requirement.
- Adjust position size dynamically based on confidence and confluence.

Pros and Cons of the Strategy
This model is designed to deliver high-quality, repeatable setups — but like any trading method, there are key things to understand before using it.
Note: The cons listed here aren’t disadvantages. They are things to be aware of — important characteristics that require patience, discipline, and proper management to make the model work effectively.
Pros
- Simple & Clear: Easy to understand.
- Mechanical Framework: Step-by-step process using MSB, range, POI, and lower timeframe confirmation.
- All-in-One System: Combines market structure, liquidity, order blocks, and bias into one flow.
- Works on Any Market/Timeframe: Used for crypto, forex, futures, and commodities. It is scalable across timeframes.
- Clean Charts: Visually tidy and easy to mark up.
Cons (Things to Be Aware Of and Manage)
- Not Fully Mechanical: Entries need some discretion, especially around breakers and confirmation.
- Requires Chart Time: Needs backtesting and live practice — can’t rely on hindsight examples alone.
Needs Adaptation: Traders must eventually personalize it for their style, assets, and timeframe.
Trade Breakdown
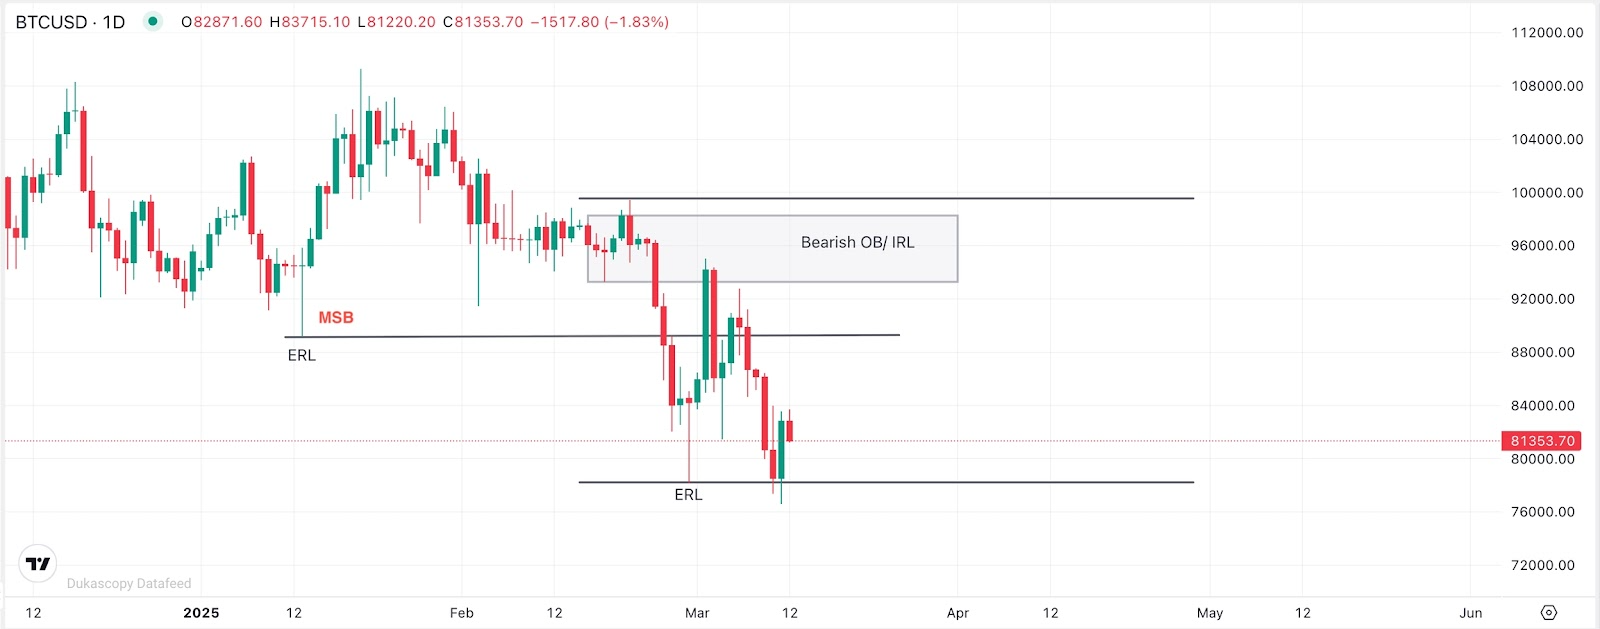
Trade Example 1 Bitcoin Short Trade ( 1D HTF + 30m LTF)
High Time Frame (HTF) – 1-Day Chart
- Bias: Bearish
- Market Structure Break (MSB): Price broke below a key swing low, confirming a bearish structure.
- Range: From swing high to the new swing low after the MSB.
- POI: A bearish Order Block — the last up candle before the move that broke structure.
- Price retraced into this POI, which was in the premium area of the range.

Lower Time Frame (LTF) – 30-Minute Chart
Inside the 1D OB, on the 30m chart:
- Price ran a swing high, grabbing liquidity (engineered liquidity sweep).
- Entry was taken on the retest.
- Stop: Above the high that was swept.
- Target: The next external liquidity level, which was a lower low from the HTF.

Results
- The short played out perfectly.
- Strong bearish displacement confirmed the move — a large fair value gap formed, showing institutional order flow.
- Price dropped aggressively from the entry, fully reaching the target.
Trade Example 2 Solana Long Trade (HTF + LTF confirmation)
High Time Frame (HTF) – Weekly Chart
- Bias: Bullish
- Market Structure Break (MSB): Price broke above a previous swing high, confirming a bullish leg.
- Range: From the most recent swing low to the new swing high.
- Discount Zone: Bottom 50% of the range.
- POI: A bullish Order Block — the last down candle.
- Price retraced into this OB, landing in the discount zone.

Lower Time Frame (LTF) – H12
Inside the weekly OB:
- Price came back into the OB and started building up liquidity — multiple swing lows formed inside the zone.
- One more low formed, and then it got swept — that was the liquidity grab.
- Entry was taken on the retest.
- Stop: Below the low that was swept.
- Target: The next external liquidity, which was the swing high on Solana.Result:

Results
- A strong bullish move followed the entry.
- A large fair value gap formed after the entry, showing strong momentum and confirming that the move was likely institutionally supported.
- Price continued to rally and eventually traded all the way back to its all-time high — that was the target.