


Built For
Instruments: Futures/Forex
Trading Style: Swing Trading
Strategy Overview
This strategy is designed to capture high risk-to-reward trades by trading only during the London session, when momentum and volatility tend to align. It follows a clear, structured model that uses stacked EMAs, fair value gaps (FVGs), and time-based entry conditions to identify precise, high-probability setups.
The strategy is centered around a specific entry formation known as the “Trident Pattern”, which combines a clean FVG with a doji candle wick into the FVG’s midpoint, followed by a confirmation candle. The trade is executed only when all conditions are met, including strict trend alignment using multiple EMAs and confirmation from higher timeframe bias.
While it favors long setups on naturally bullish assets like Gold or the Nasdaq, the model is directional and can be applied to both longs and shorts. The focus is on quality over quantity, waiting patiently for ideal setups during a narrow trading window and maximizing reward through trend continuation on the daily chart.
Strategy Rules
Time of Day: The London Kill Zone
- Only trades between 3:00 AM and 6:30 AM New York time.
- Entries must occur inside this window. This kill zone gives the highest probability entries, based on years of backtesting.
Timeframes Used
- 30-minute chart is the only chart used to find the entry.
- The daily chart is used for overall bias and to target take-profit levels.
Indicators
The strategy uses a set of EMAs to define trend structure and momentum clarity:
- 5 EMA
- 9 EMA
- 13 (or 15) EMA
- 21 EMA
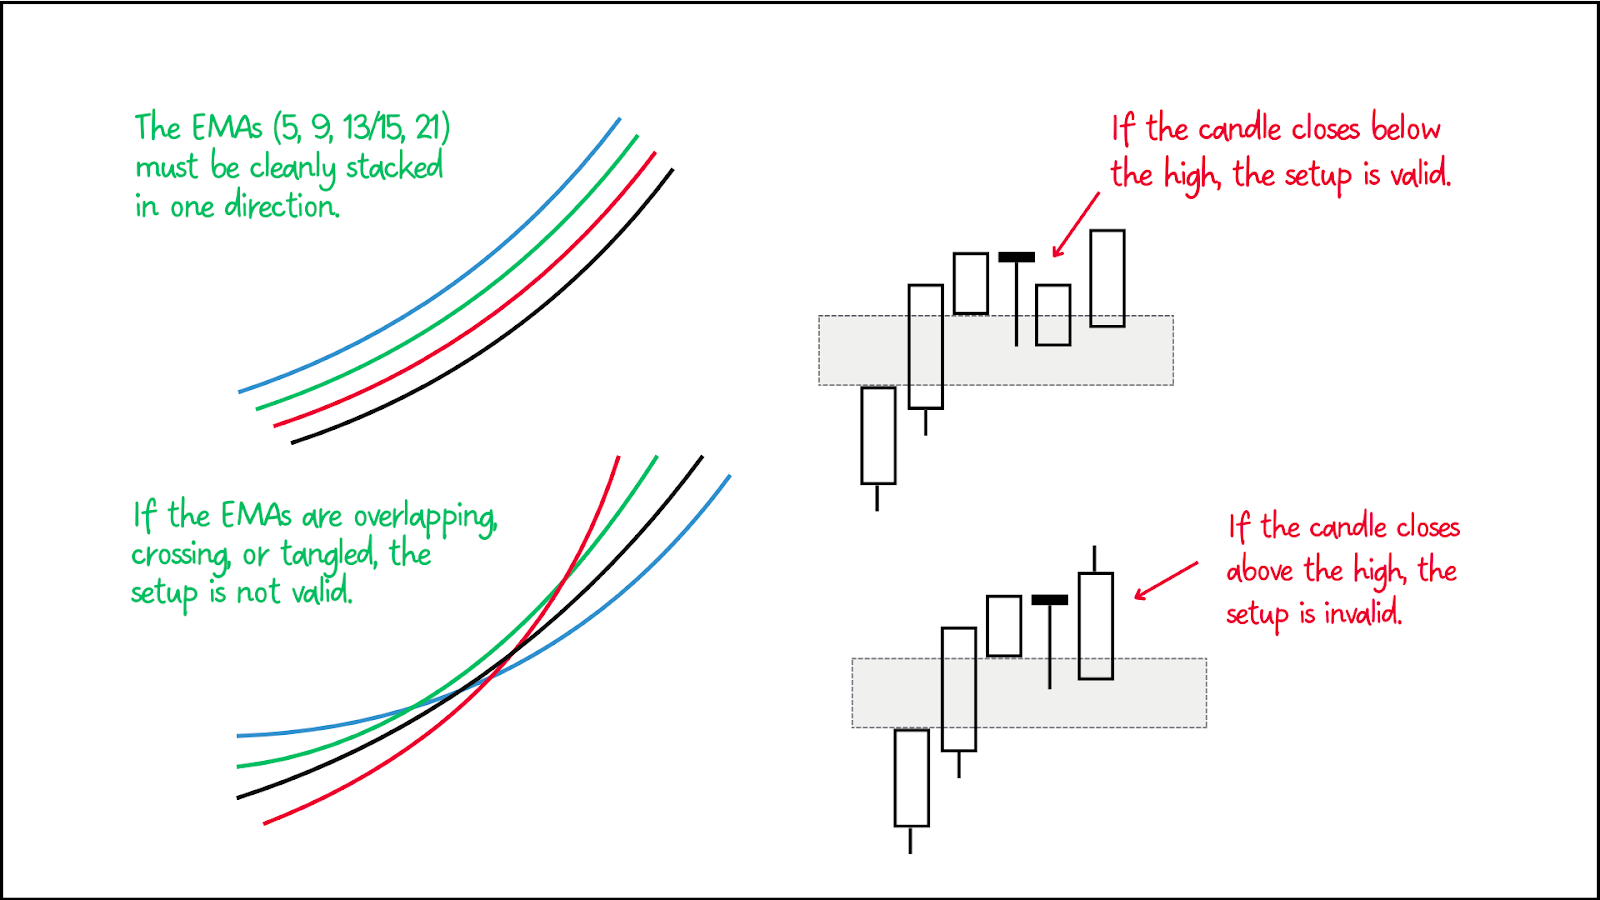
These EMAs must be clearly stacked in the direction of the trade. If they are crossing or tangled, the setup is invalid.
- 200 EMA: for trend bias
- Above 200 EMA → only take longs
- Below 200 EMA → only take shorts
- Bull Trading Candle Strength Indicator:
- Green candle = strong bullish
- Blue = mild bullish
- Red = strong bearish
- Black = mild bearish
Helps confirm momentum on the daily chart
Entry Criteria – The Trident Pattern
Once you’re inside the London Kill Zone, here’s exactly what you look for:
Fair Value Gap Forms
Look for a 3-candle FVG to form on the 30M chart
- Must occur between 2:30 and 4:00 AM
- Ignore FVGs outside the kill zone
Identify the 50% Level (Consequent Encroachment)
Mark the midpoint of the FVG. This is where you want to see a reaction.
Wait for the Trident Candle
- A small-bodied doji candle must form next.
- The candle must wick into the FVG 50% zone.
- This wick shows that sellers tried to push the price down, but buyers were strong enough to bring it back.
Confirm with Next Candle
The candle after the doji must close below the doji high. If it closes above the doji high, the trade is invalid.
Enter the Trade
You can enter the market on that confirmation candle or place a limit at the FVG 50% if you’re early
Stop Loss:
- Below the low of the candle that forms FVG
- On Gold, a hard stop isn’t used. This approach is based on backtesting, which showed that Gold often makes deep liquidity wicks before running. Using a closing candle filter prevents getting stopped out prematurely.
Take Profit & Trade Management
- Use the daily structure to guide your take-profit decisions.
- The idea is to ride the trend for as long as it remains intact.
Consider closing the trade if:
- The EMAs begin to reverse direction, signaling a potential shift in trend.
- A significant bearish candlestick appears that invalidates the current structure.
Valid Pairs
- USDJPY
- EURUSD
- GBPUSD
- NZDUSD
- USDCAD
- Gold (XAUUSD)
Pros and Cons of the Strategy
This model is designed to deliver high-quality, repeatable setups, but like any trading method, there are key things to understand before using it.
Note: The cons listed here aren’t disadvantages. They are things to be aware of — important characteristics that require patience, discipline, and proper management to make the model work effectively.
Pros
- High Risk-to-Reward: Designed to capture large moves relative to risk, offering strong reward potential on each trade.
- High Win Rate: Around 90% when all rules are followed.
- Clear, Simple Rules: No overcomplication, just trend, time, and pattern.
- No Overtrading: Only trades 3.5 hours per day max.
- Works best with Trending Markets: Especially strong on Gold and Nasdaq.
Cons (Things to Be Aware Of and Manage)
- Patience Required: Setup may only appear a handful of times per year.
- Small Time Window: You must be awake and ready during London hours.
- PNL Fluctuations: Price may go +10R and pull back to +5R before running again.
- Needs a Fully Balanced Prop Firm: Hybrid drawdown models can ruin trades due to equity resets.
- Not for Everyone’s Psychology: If you can’t sit on your hands, you’ll ruin the edge.
Trade Breakdown
Asset: USDJPY
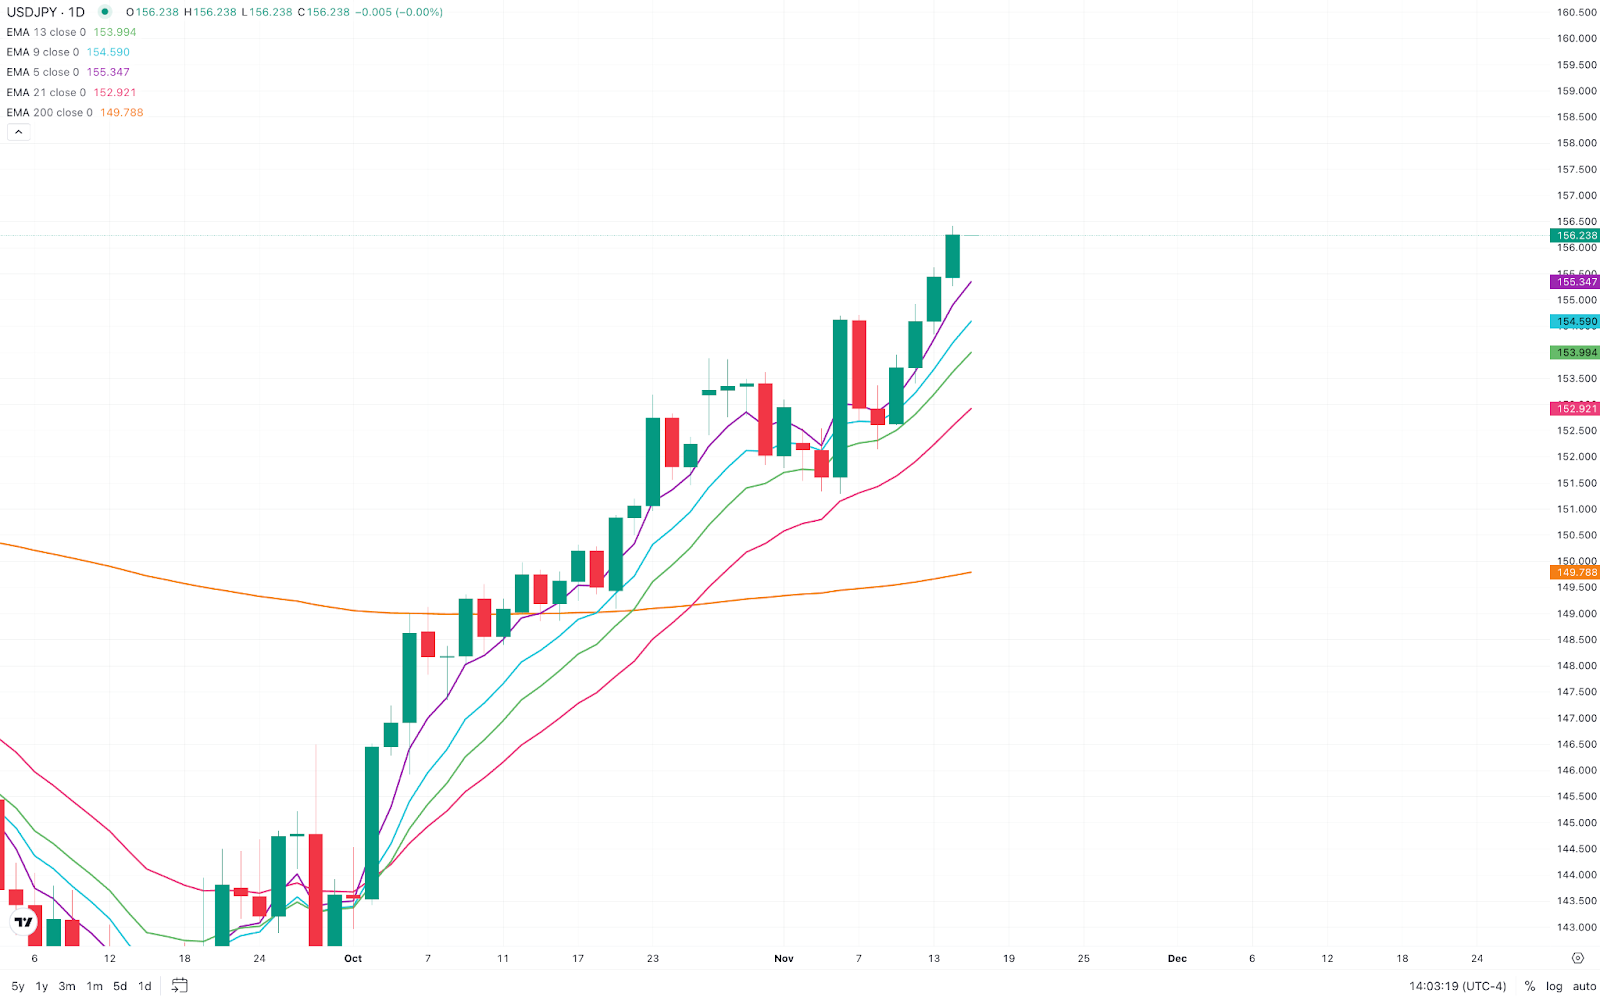
Timeframe Context
- Price is trading above the 200 EMA, confirming a bullish market bias.
- All EMAs (5, 9, 13, 21) are cleanly stacked, showing strong upward momentum.
- The overall structure on a daily basis is aligned to the upside, giving full confirmation to only look for long setups.
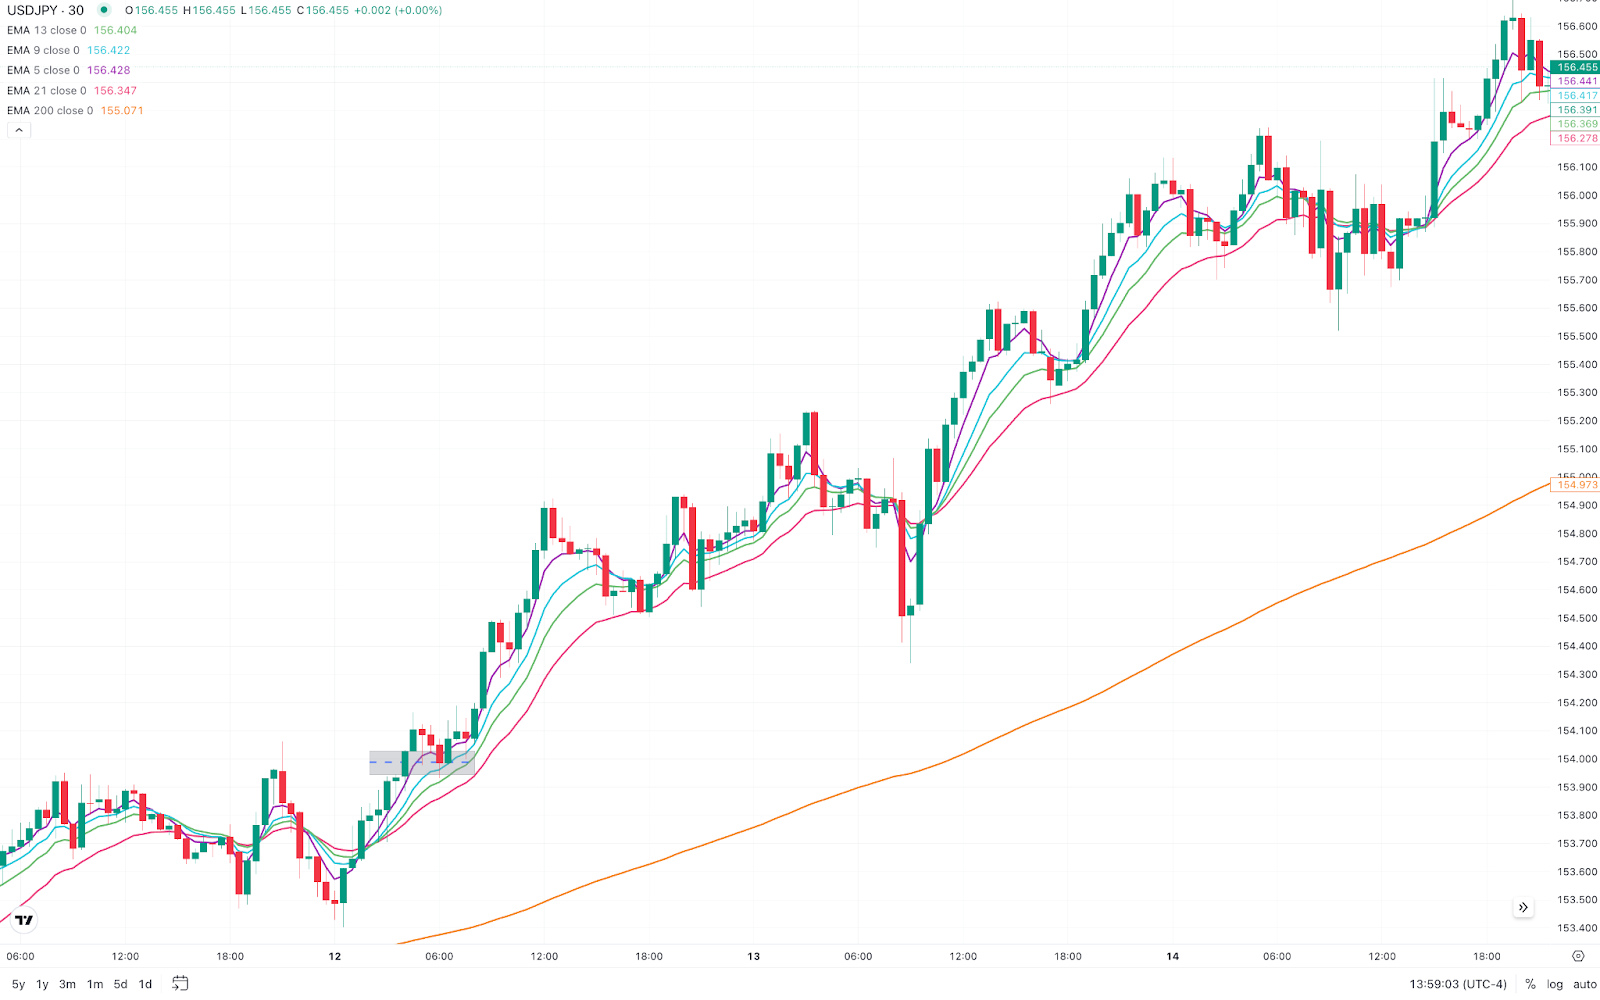
Kill Zone Confirmation
- Time of setup: 4:00 AM New York Time, inside the London Kill Zone.
Fair Value Gap Formation
- A clean 3-candle Fair Value Gap (FVG) formed on the 30-minute chart.
Trident Pattern Validation
- A doji candle formed immediately after the FVG, with a wick into the FVG’s 50% level (consequent encroachment).
- This wick showed seller aggression was absorbed by buyers, confirming a high-probability reversal area.
- The candle that followed closed below the doji’s high, validating the Trident pattern.
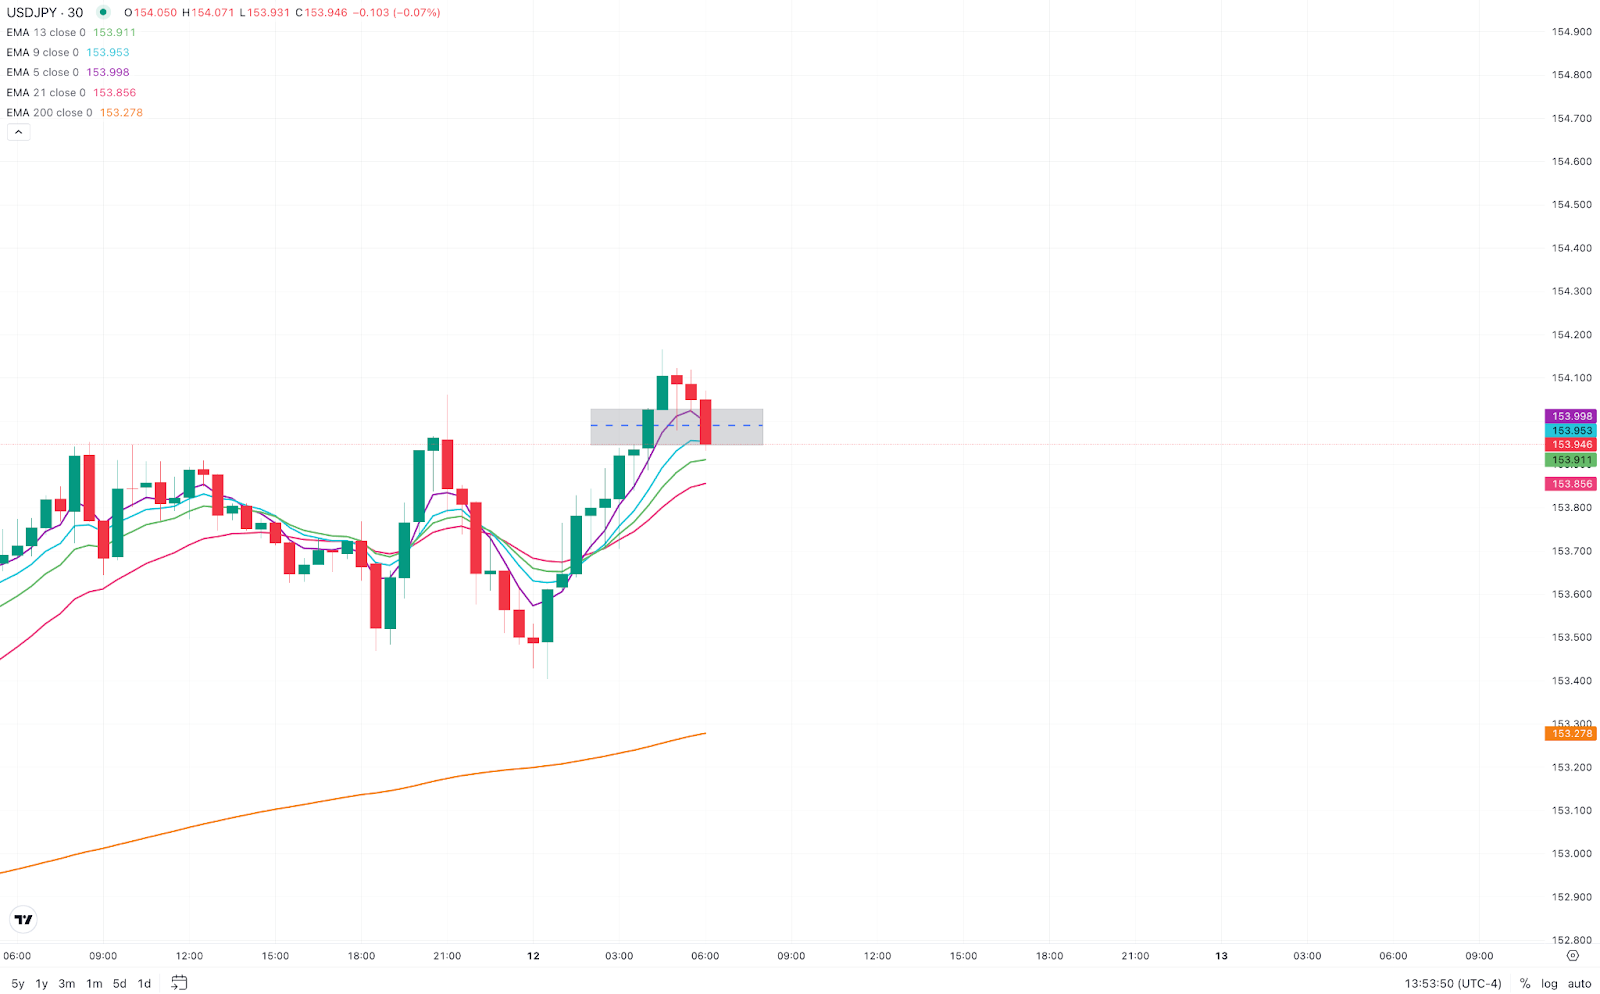
Entry, Stop Loss, and Risk Parameters
- Entry: Immediately after the confirmation candle closed.
- Stop Loss: Just below the FVG candle's low.
- Target: Managed using the daily chart trend — held as long as EMAs remained stacked.
Daily chart

.png)

