


Built For
Instruments: Forex
Trading Style: Swing Trading
Strategy Overview
This strategy is built around one simple idea:
Markets spend most of their time moving sideways between support and resistance. The best trades come from understanding where you are in that sideways structure, and then trading a very specific “pocket” of price action after a trendline break at a key level.
Ali splits the market into three main conditions:
- Against the Trend – aggressive counter-trend trades directly off extended key levels.
- With the Trend – classic trend continuation trades once a new trend is clearly established.
- Trendline Break Condition (The Pocket) – the small window after price reacts from a key level, breaks the trendline, and confirms a shift in momentum, before it becomes a fully established trend.
This Strategy focuses on Condition 3 – the Trendline Break Pocket.
You are not trying to catch every bounce at support/resistance, or every pullback in a trend.
What You Trade
You only take a trade when all of the following are true:
Price has reached a higher-timeframe key level: (a support or resistance zone identified using the Frequency & Proximity method)
A properly defined trendline has been broken: (drawn from the most recent swing that created the last higher high or lower low)
The last swing in the old direction has been broken: This confirms a real momentum shift, not just noise.
A controlled entry form: Either
- A pullback into the 21-period moving average, or
- A small consolidation below/above the broken structure that you can break out of
When these occur together, the market is in the Trendline Break Pocket and ready for execution. The base model targets 2R (2:1 reward:risk).
Historical tracking of this setup shows a realistic ~58% win rate at 2:1 when executed consistently.
Building Key Levels – Frequency & Proximity Method
Many traders draw random lines and call them “zones”. This method forces structure.
Frequency
Ask: How often has the price respected this area recently?
- Multiple highs rejecting a similar price area → potential resistance zone.
- Multiple lows holding a similar area → potential support zone.
Example: Two clean hits at the top, three hits at the bottom → both are “key” zones.
Proximity
Ask: What has happened most recently at this level?
- If the recent price has tagged and respected it → strong, active zone.
- If the recent price has broken through and chopped around it → weaker, “messy” zone.
Based on this, treat zones as:
Key Levels:
- Good frequency + recently respected.
- Main places for Trendline Break setups.
Proceed With Caution Levels:
Only one clean reaction, or recent breaks through. Can be used, but with lower confidence.
Mid-range areas that have been broken through repeatedly are largely ignored.
Market Conditions Framework
Before looking for entries, you must know which condition the market is in.
Against the Trend Condition
Price is extended into a key level. Good location for aggressive counter-trend trades, but not the focus of this strategy.
With the Trend Condition
Price has already broken out of the pocket and is forming a full trend structure. Not used in this playbook.
Trendline Break Condition (The Pocket)
This is the core of the strategy. The Pocket forms when all three occur:
- Price hits the key level
- Trendline is broken
- Last swing is broken (momentum shift)
Only then does the market qualify for a Trendline Break setup.
Strategy Rules
A major reason most traders fail with trendlines is inconsistency. This strategy uses a defined, repeatable way to draw them.
How to Draw the Correct Trendline
Identify the “Price Action Momentum Point.” This is the swing that created the most recent higher high or lower low.
Prioritize Recent Structure
If price steepens:
- Ignore the older swing
- Use the more recent one that created the structure
This keeps the trendline aligned with current momentum.
Trendline Is NOT an Entry
Breaking the trendline does not trigger a trade. It simply shifts the market into the Pocket condition.
Overshoot Rule
Price must hit the key level. But the reaction can include one overshoot (a deeper wick or push).
However, if the price overshoots the level twice, the setup is void.
Two pushes = the level is not clean, the structure is unstable, and momentum has not genuinely shifted. This rule protects you from sloppy, low-quality conditions.
Momentum Shift Confirmation
After breaking the trendline, the price must break the final swing of the previous trend:
- Last lower high in a downtrend
- Last higher low in an uptrend
This confirms that control has shifted.
No swing break = no trade.
This removes 90% of the “fake trendline breaks” that retail traders get trapped in.
Entry Rules
After confirming the Pocket, you wait for the price to give one of two valid entries.
There are only two.
Entry Type 1 – Pullback to the 21 EMA (Core Entry)
Requirements:
- Price pulls back into the 21 EMA
- The EMA is touched
- Entry order is placed at the EMA
- Stop-loss is set using the 2R structure
- Target = previous high/low created after the momentum break
This is the primary entry of the Strategy.
Entry Type 2 – Breakout from Consolidation
Used when the price does not return fully to the EMA.
Requirements:
- Consolidation forms after the last swing break
- Consolidation must be formed on the correct side:
- Below the broken structure for shorts
- Above the broken structure for longs
- At least:
- Two highs
- Two lows
- Breakout entry above/below the consolidation
If either of these criteria is missing, skip the setup.
Stop-Loss & Target Rules
This strategy uses a simple and systematic risk framework.
Target = the high/low formed after momentum break
Stop = half the distance to the target
Clean-Air Requirement
Before entering, look left. You must have clean air (no major level, zone, or structure blocking your 2R target). If nearby structure would interfere: Skip the trade.
This rule filters out many valid-looking setups that don’t have enough room to breathe.
Filters (Optional Extensions)
After mastering the base model, you may incorporate filters to justify extending targets beyond 2R. These filters do not increase win rate.
They only signal when a successful trade may travel further.
Divergence (MACD)
Look for opposite movement between:
- Price
- MACD lines
Example (short):
- Price prints higher highs
- MACD prints lower highs
This indicates weakening momentum.
Retail Sentiment
Using a retail sentiment tool:
- If you want to go long, you want retail heavily short
- If you want to go short, you want retail heavily long
Early sentiment extremes inside the Pocket are strong signals that the move can run further.
Trade Management
For standard 2R setups:
- No micromanagement
- No trailing
- No early exits
Timeframe Rules
Timeframes are clearly defined: Analysis Timeframes
- Daily
- Weekly (if needed)
Used to identify key levels and draw trendlines. Trigger Timeframe
- Daily (default)
- 4H (optional advanced execution)
4H entries must still follow the same daily trendline and daily key levels. The structure NEVER changes.
Why This Pocket Works
After price hits a key higher-timeframe level:
- The trendline break shows momentum failure
- The break of the last swing confirms shift in control
- The pullback into the 21 EMA or small consolidation gives a structured entry
- The overall structure provides a clear target and a defined stop
You are trading the early stage of a trend reversal, after confirmation but before the move becomes obvious.
This combination makes the setup:
- Repeatable
- Easy to track
- Data-friendly
- Visually clear
- High probability inside the right conditions
Pros and Cons of the Strategy
This Strategy is designed to deliver high-quality, repeatable setups — but like any trading strategy, there are key things to understand before using it.
Note: The cons listed here aren’t disadvantages. They are things to be aware of — important characteristics that require patience, discipline, and proper management to make the strategy work effectively.
Pros
- Clear, structured, rule-based
- Easy to track and analyze
- Works on any market with clean structure
- Strong win rate (~58%) at fixed 2R
- Fits swing trading schedules (minimal screen time)
- Not dependent on news or intraday noise
Cons
- Long periods with few trades
- Multiple correlated markets may trigger together
- Requires strict discipline on key levels
- Some setups break down quickly if the level is weak
- Missing a condition = no trade — no exceptions
Trade Breakdown
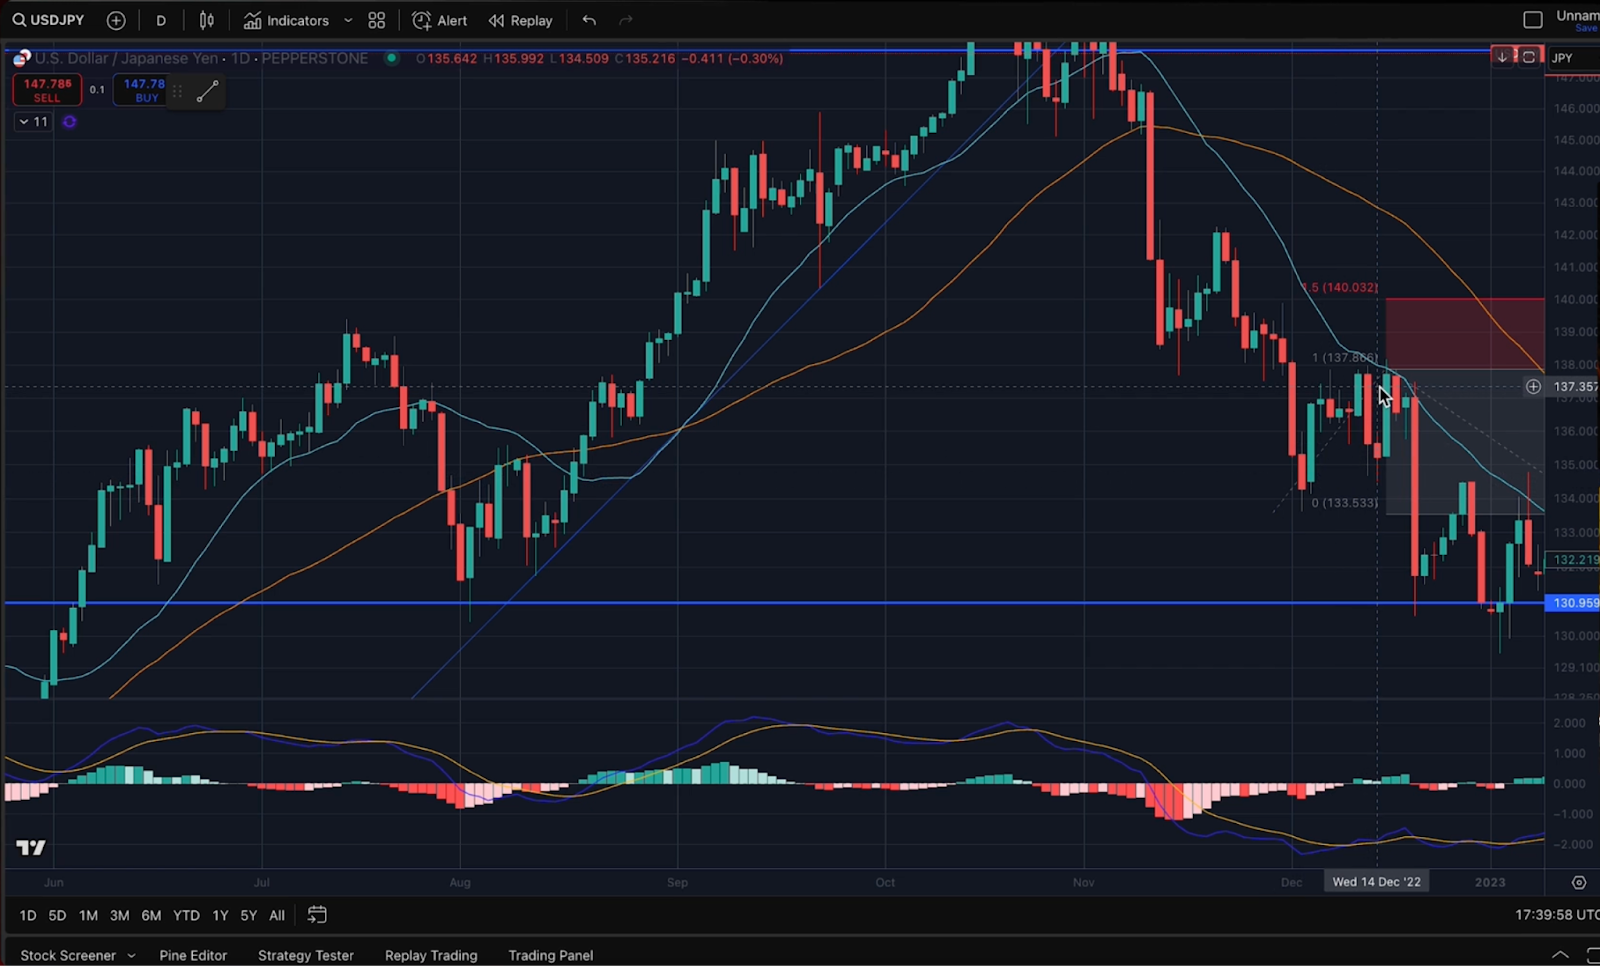
Example 1
Price moves into a clear resistance level that has held several times before. It reacts from the level and the uptrend trendline breaks.
Right after the trendline break, the price pushes lower and breaks the last higher low. This confirms the momentum shift and puts the market in the Pocket.
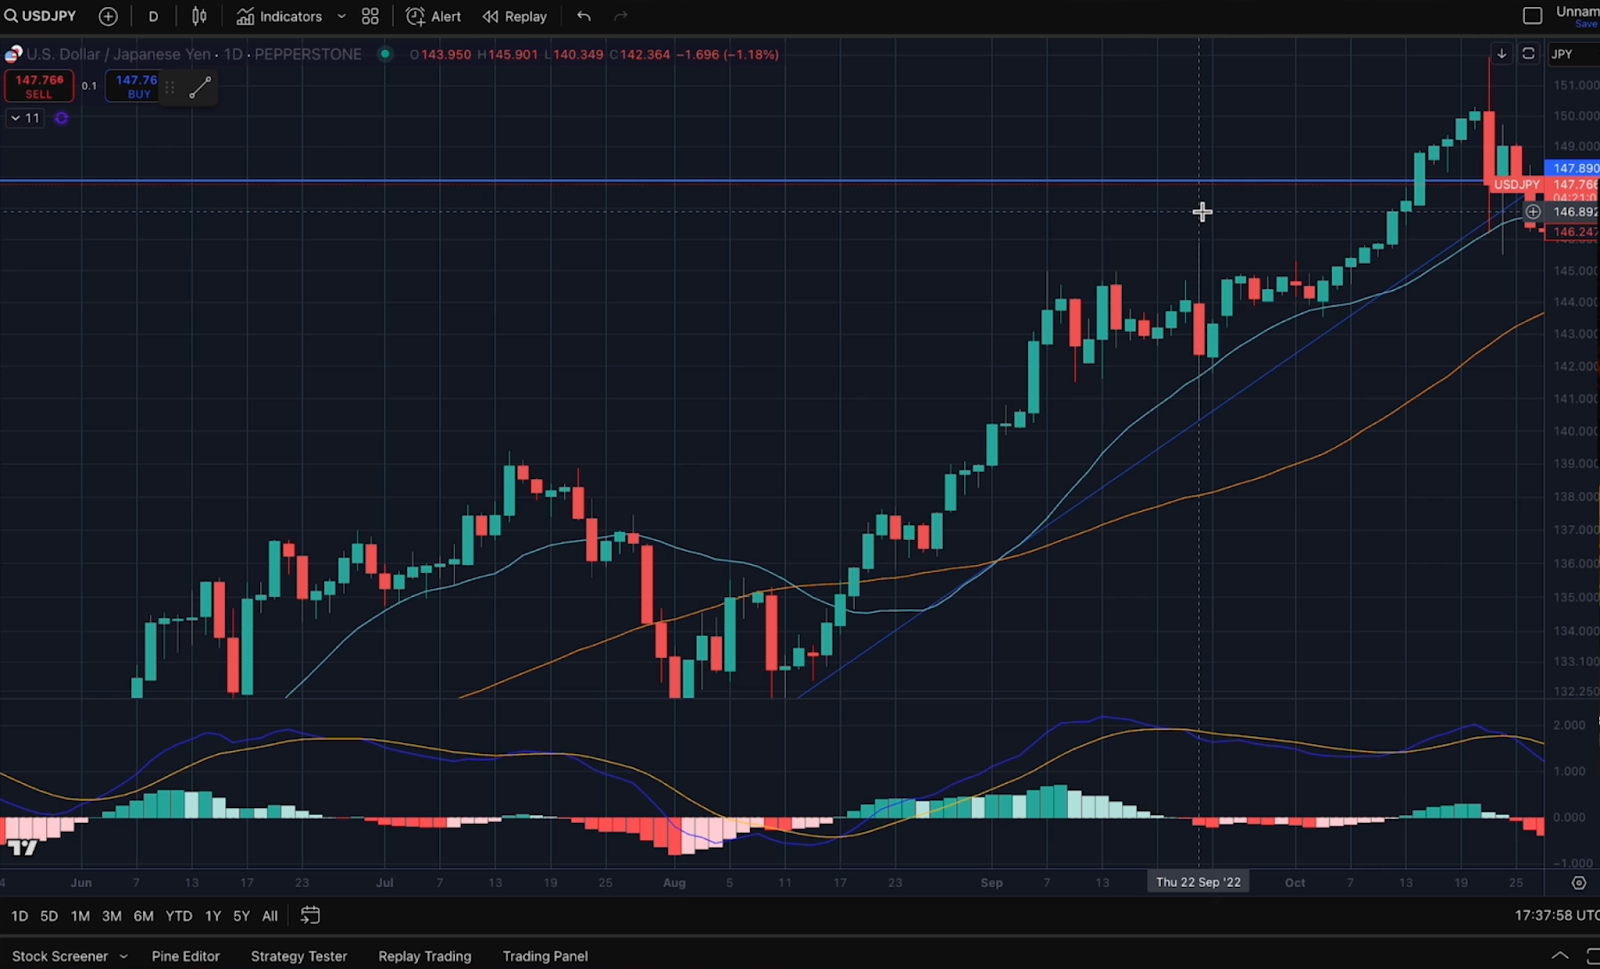
Price then pulls back into the 21 EMA, giving the entry.
Entry: Short at the 21 EMA
Stop: Based on the 2R structure
Target: The first low formed after the momentum shift
There’s nothing blocking the move to target, so the setup is valid. Price rolls over from the EMA and reaches full 2R.
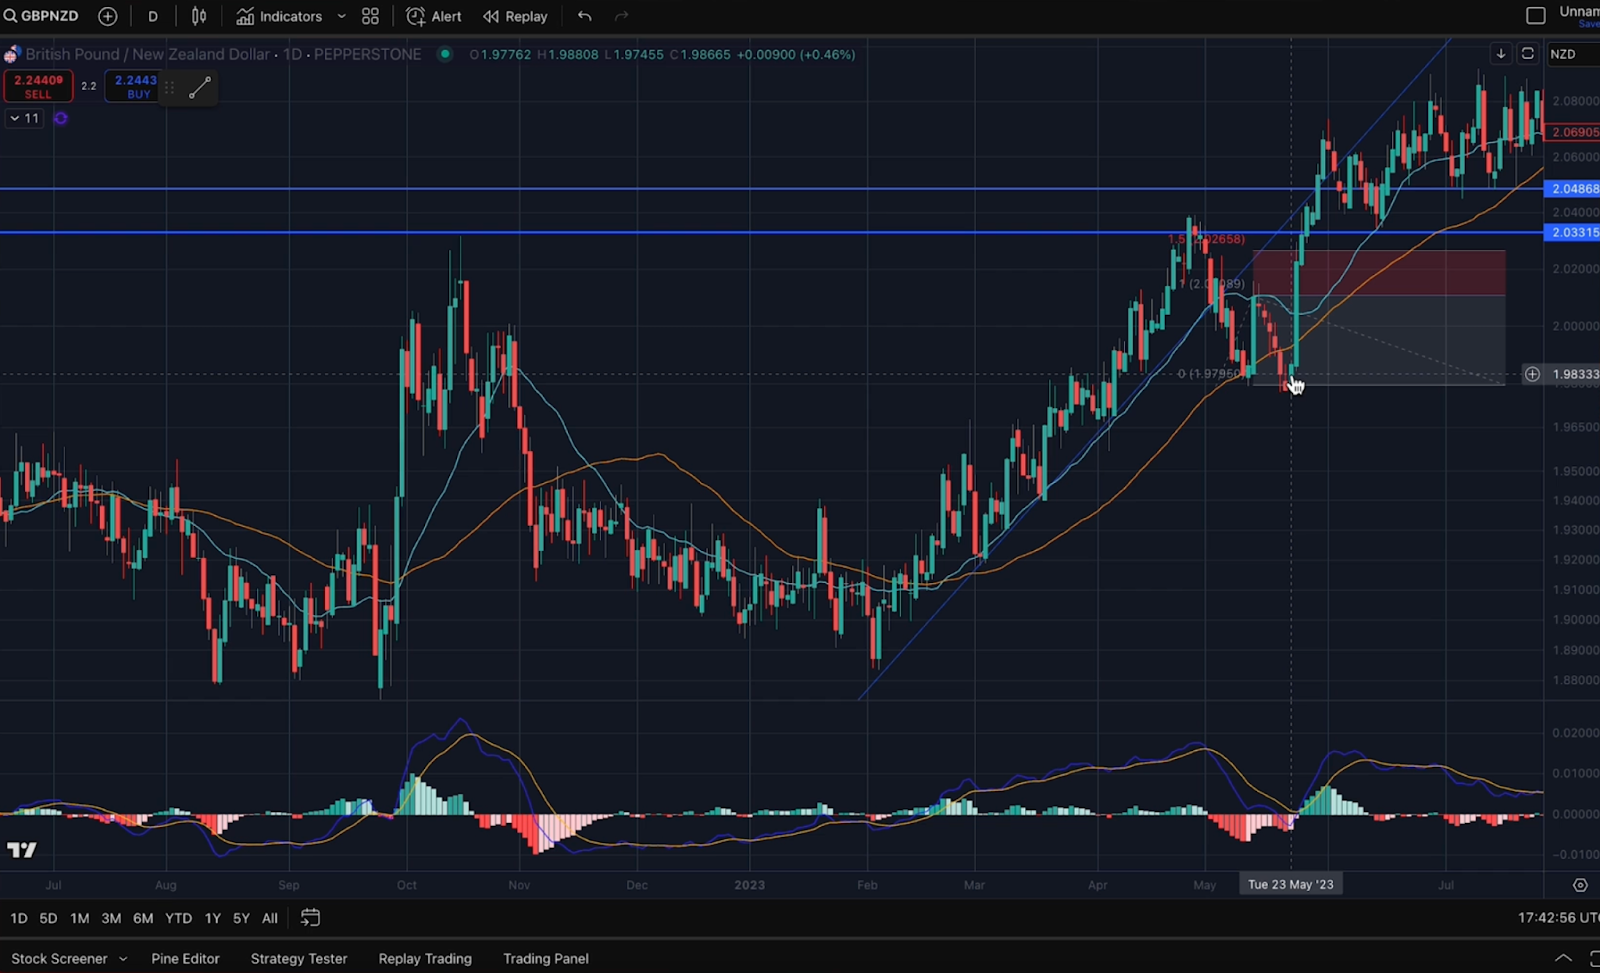
Example 2
Price reaches a strong resistance level and gives a clean reaction.
The trendline breaks, and then the price pushes lower and breaks the last higher low, confirming the shift in momentum.
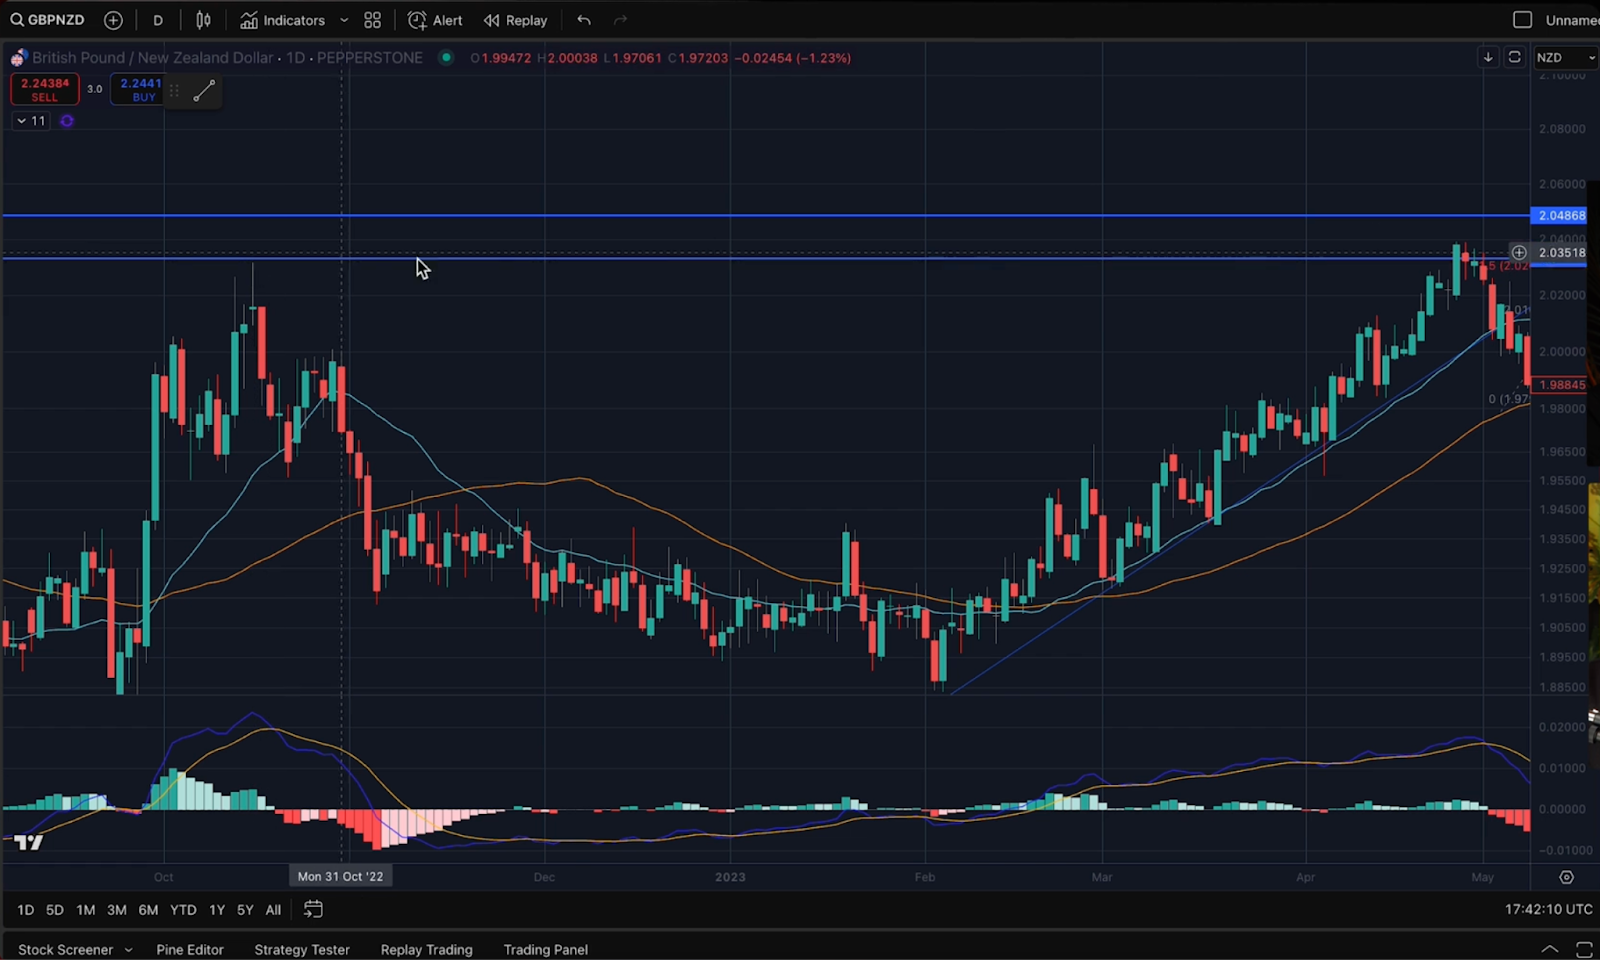
After the shift, the price comes back into the 21 EMA and gives the entry.
Entry: Short at the 21 EMA
Stop: Set using the 2R structure
Target: The low formed after the momentum break
Price moves away from the EMA and reaches the 2R target, completing the setup.
.png)