


Built For
Instruments: Stocks/Futures/Options
Trading Style: Scalping/Day Trading/Swing Trading
Strategy Overview
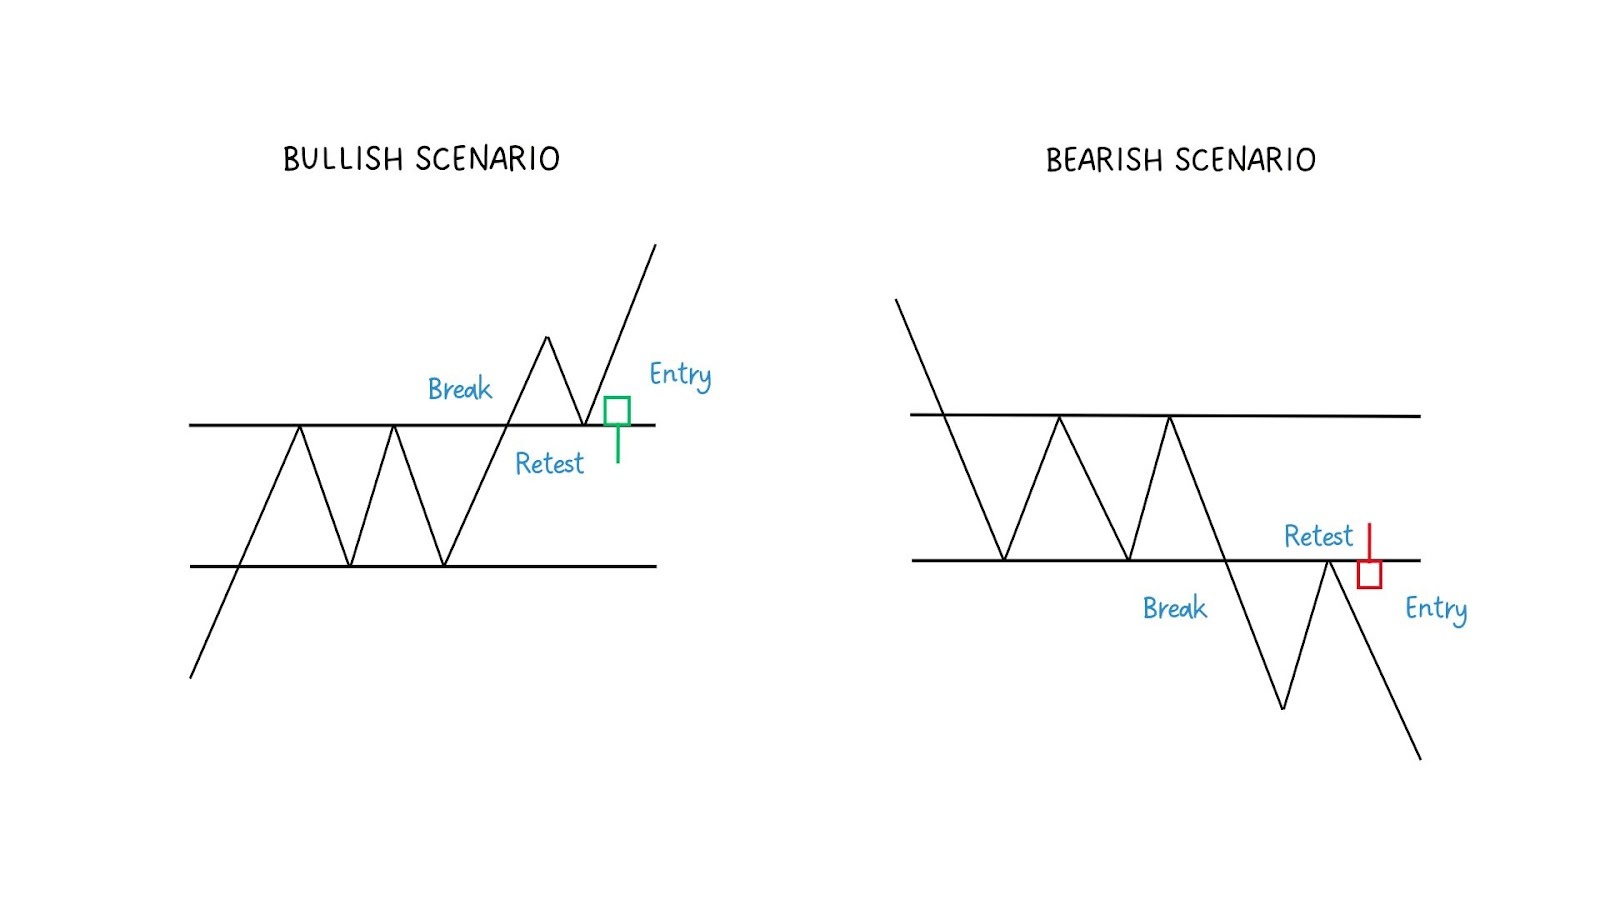
This strategy is built around the idea that markets move through the constant interaction between buyers and sellers, and that price often breaks key levels, pulls back, and then continues in the direction of the break.
The core of the strategy is extremely simple:
- Identify a clear support or resistance level.
- Wait for a clean breakout.
- Wait for a retest back into the level.
- Confirm that the dominant side (buyers or sellers) is stepping in again.
- Enter with a 1:2 minimum risk-to-reward profile.
This system is built on:
- Clean structure
- Momentum recognition
- Candlestick interpretation
- Understanding where buyers or sellers regain control
- Avoiding unnecessary indicators or complexity
Scarface’s approach is 90% mechanical and 10% discretionary, with discretion coming only from live price action experience and reading the speed and strength of movement.
He scales to a large size, but the strategy works with two to three contracts for beginners and can be applied to stocks, futures, and options, as long as the trader follows the rules consistently.
Timeframes Used
The system can be used on all markets and timeframes. However, the primary structure is:
- Entries: 1-minute chart
- Context: 5-minute chart
- Higher-timeframe moves (swings): 4-hour chart
Intraday trades are taken only between 9:30 AM and 11:00 AM EST, when volume and momentum are strongest. Swing trades can run for days, but use the exact same logic.
Core Foundation
The system is built around one core truth:
Markets are auctions where buyers and sellers fight for control.
- Resistance = Sellers overpower buyers
- Support = Buyers overpower sellers
- Breakouts = One side gains temporary dominance
- Retests = The first real test of whether dominance continues
When price breaks above resistance and retests it:
- Buyers must defend the level
- Candlesticks must show buyers absorbing sellers
- A continuation move signals that buyers remain in control
When price breaks below support and retests it:
- Sellers must defend
- Candlesticks must show rejection
- Continuation confirms downward control
This simple structure forms the basis of all three setups in the Strategy.
Entry Confirmation: Price Action Comes First
The most important skill in the strategy is understanding what a candle represents.
For example, a hammer (long wick below) shows:
- Sellers pushed the price down
- Buyers stepped back in aggressively
- Buyers absorbed the supply
- Buyers held the price above support
A shooting star (wick above) shows the opposite. Naming candles is irrelevant. Understanding the battle inside each candle is everything.
The Three Setups in the Strategy
Scarface trades three high-probability setups:
- The One-Candle Rule
- The First Candle Rule (15M → 5M → 1M)
- The Pre-Market Break and Retest
Each setup uses the same underlying principle but applies it in a slightly different context.
Strategy Rules
SETUP 1: The One-Candle Rule
This is the simplest version of the strategy and the core of everything else.
Concept
- After a breakout, the price will often:
- Pullback toward the level
- Test the previous opposing candle
- Show clear buyer/seller strength
- Continue in the direction of the breakout
The previous single down-close candle (for longs) or single up-close candle (for shorts) becomes a micro demand/supply zone. This is what Scarface calls the one-candle rule.
Bullish Rules
- Identify a clear resistance level with multiple touches
- Wait for the price to break above
- Wait for the price to pull back
- Identify the last down-close candle before the breakout
- Price must retest that candle
- Candle must close above the one-candle zone
- Entry occurs on the close or the next candle
- Stop goes below the one-candle rule zone
- Target minimum 2R, scale partials at the high of day
Bearish Rules
Same as bullish but reversed:
- Identify support
- Break below
- Retest
- Use the last up-close candle as the one-candle zone
- Confirm sellers overpower buyers on retest
- Enter after a weak bullish candle or a strong bearish close
A+, A, and B-grade Conditions
A+ Setup
- Retest holds both the one-candle zone and the key support/resistance level
- Candlestick shows clear buyer/seller absorption
- Higher time frames are aligned
A Setup
- Retest holds the one-candle rule
- Support/resistance level slightly missed
- Price action is still strong
B Setup
- Only level holding is the one-candle rule
- Higher time frame unclear
- Should be used with a reduced size
SETUP 2: The First Candle Rule (15M → 5M → 1M)
This setup filters the chaotic open and gives a structured way to follow early trend direction.
- Wait for the first 15-minute candle to close. Mark the high and low.
- Move to the 5-minute chart. Price must close above or below the 15-minute range.
- Move to the 1-minute chart. Wait for a retest of the breakout level. The one-candle rule can also be used here.
- Enter on confirmation via candle close.
Why This Setup Works
- Eliminates early noise
- Let's volume establish direction
- Acts as a cleaner intraday opening range
- High precision in choppy markets
This is often considered the most structured version of the system.
SETUP 3: Pre-Market Break and Retest
This setup is used on days with clear momentum right from the open.
Rules
- Mark the pre-market high and pre-market low (4:00–9:29 AM).
- At 9:30, wait for a breakout through either boundary.
- Look for strong displacement—a clear, aggressive move.
- Wait for a quick retest into the pre-market level.
- Confirm with a strong candle close on the 1-minute chart.
Notes
- Works best on gap-up or gap-down days
- Usually completes within 1–3 minutes
- Risk-to-reward is highest when the retest is immediate
Market Conditions
Not every day is worth trading. The strategy works best in trending environments.
Three Types of Markets
- Trending Up: strong continuation potential
- Trending Down: equally clean continuation
- Sideways/Choppy: lowest quality, often avoided
On range-bound days, setups form with weaker follow-through. Strong directional days offer high reliability
Mechanical Rules vs. Discretion
The method is mostly mechanical:
- Levels
- Retest location
- Candle close requirements
- Stops
- Targets
However, about 10% is discretionary. This comes from:
- Pace of candles
- Strength of wicks
- How aggressively the price rejects
- The character of the retest
This small discretionary part develops only through repeated exposure to the same setups.
Pre-Market Logic and Gap Behavior
When the market gaps up:
- The pre-market high becomes the most important level
- It is often the first area retested
- Break-and-retest immediately at open offers a high probability. But it must include displacement
This rule also applies inverted for gap-down scenarios.
Option Contract Selection
When applying this system with options, the focus is on using contracts that move cleanly with price and offer strong returns during momentum moves. The process is simple and does not require complicated option selection.
The guidelines are:
- Use the first at-the-money (ATM) or the first out-of-the-money (OTM) contract.
- ATM contracts offer stability, but OTM contracts often provide bigger returns when the price continues strongly and moves them into the money.
- For intraday trades, use weekly contracts.
- Even on Fridays, weekly contracts are typically fine unless volatility is unusually high — in that case, next-week contracts may be used.
- For swing trades, choose expiration dates one to two weeks out, since swings last several days and weekly expirations decay too quickly.
Risk Management Rules
Scarface always uses:
- Minimum 1:2 R:R
- Stop below/above structure (not arbitrary)
- Scale 25–50% at the high of the day or the first major intraday level
- Leave runners for extension
Beginners should:
- Trade only 2–3 contracts
- Learn to scale out properly
- Avoid sizing changes until consistent
This keeps emotions controlled and prevents account blowups.
Pros and Cons of the Strategy
This Strategy is designed to deliver high-quality, repeatable setups — but like any trading strategy, there are key things to understand before using it.
Note: The cons listed here aren’t disadvantages. They are things to be aware of — important characteristics that require patience, discipline, and proper management to make the strategy work effectively.
Pros
- Fast trading days with quick confirmation
- Highly repeatable and easy to backtest
- Simple structure that reduces hesitation
- Works across timeframes and asset classes
- Consistent execution leads to high-quality results
Cons
- Hesitation ruins timing and entries
- Simplicity may cause traders to wander into complexity
- Poor performance in highly choppy markets
- Discretionary elements require time and experience
Trade Breakdown
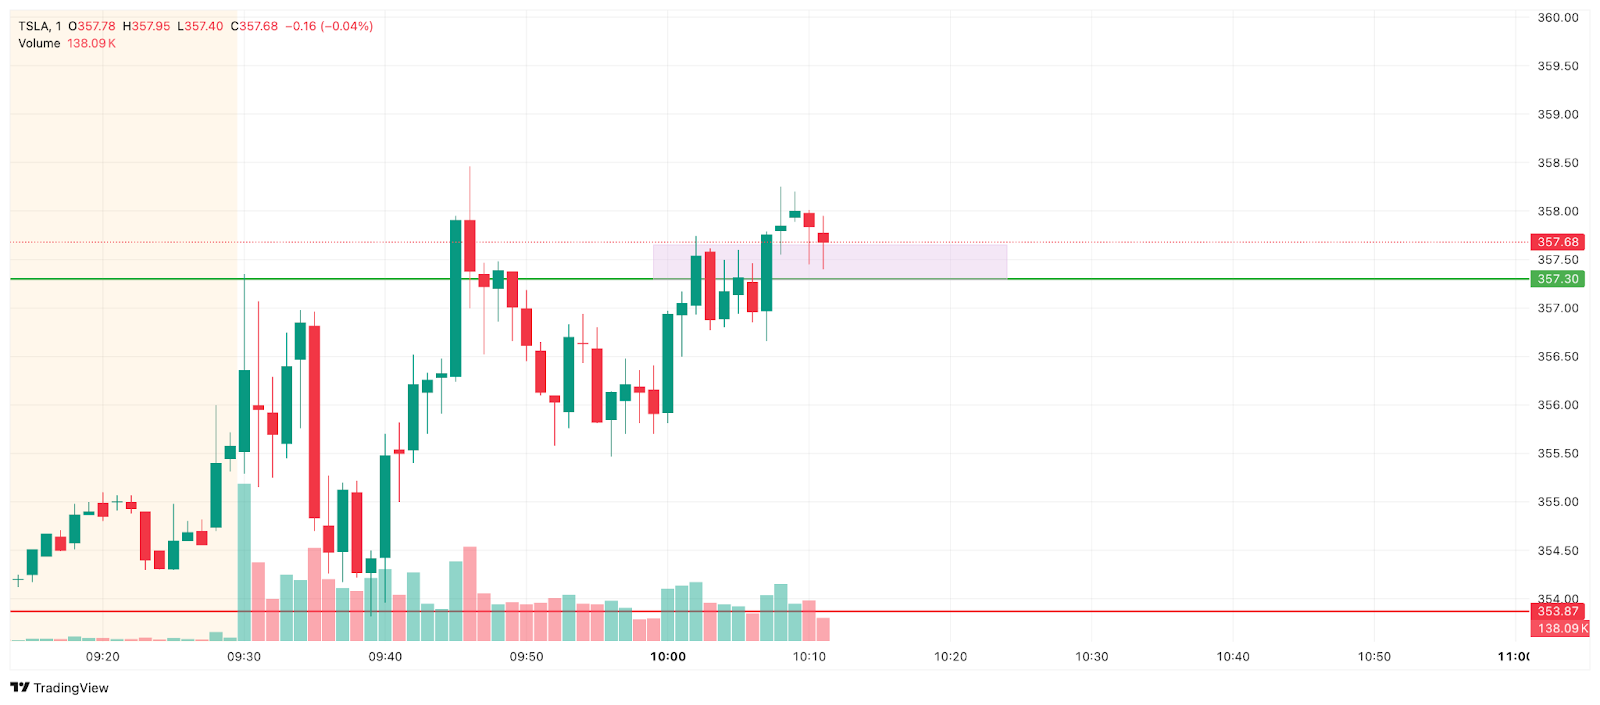
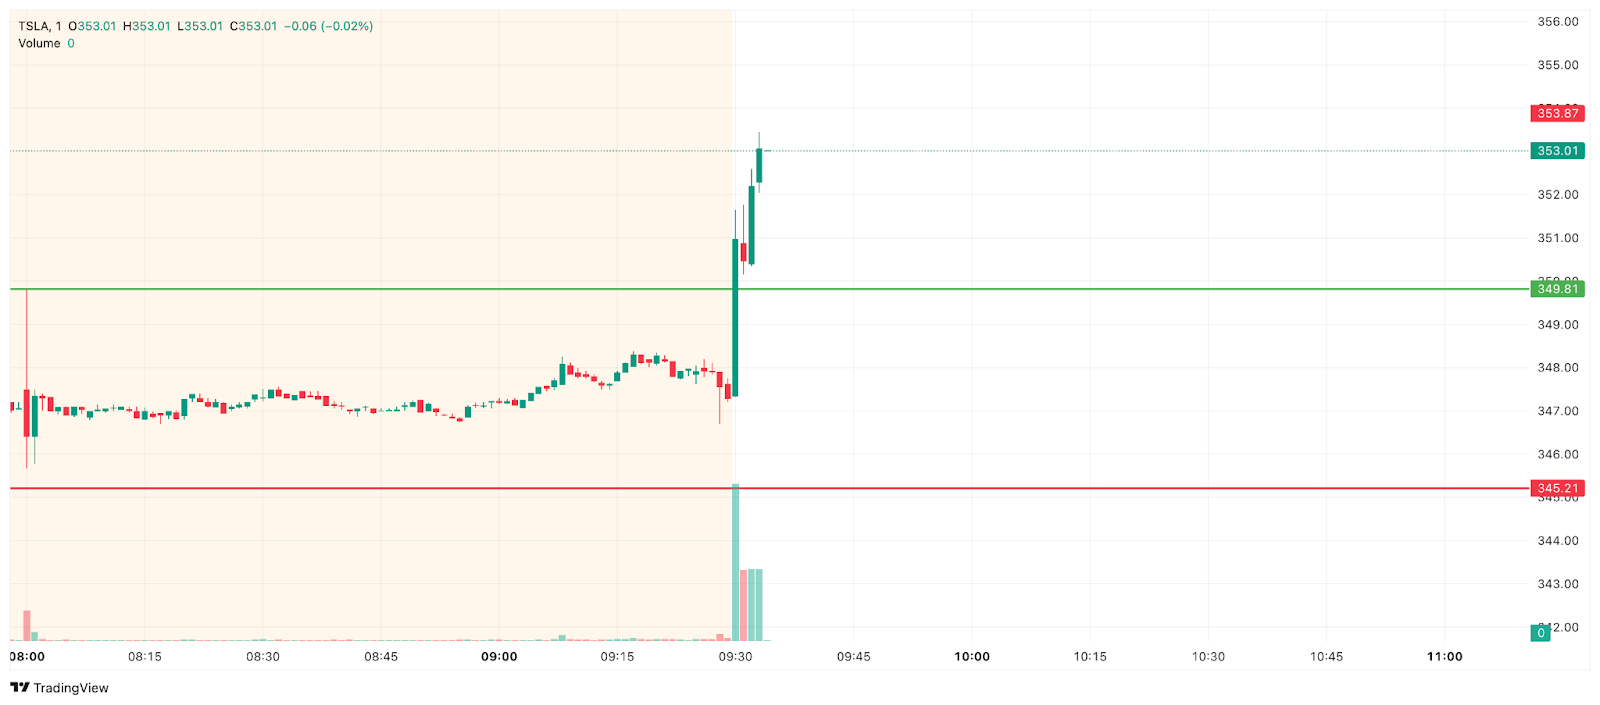
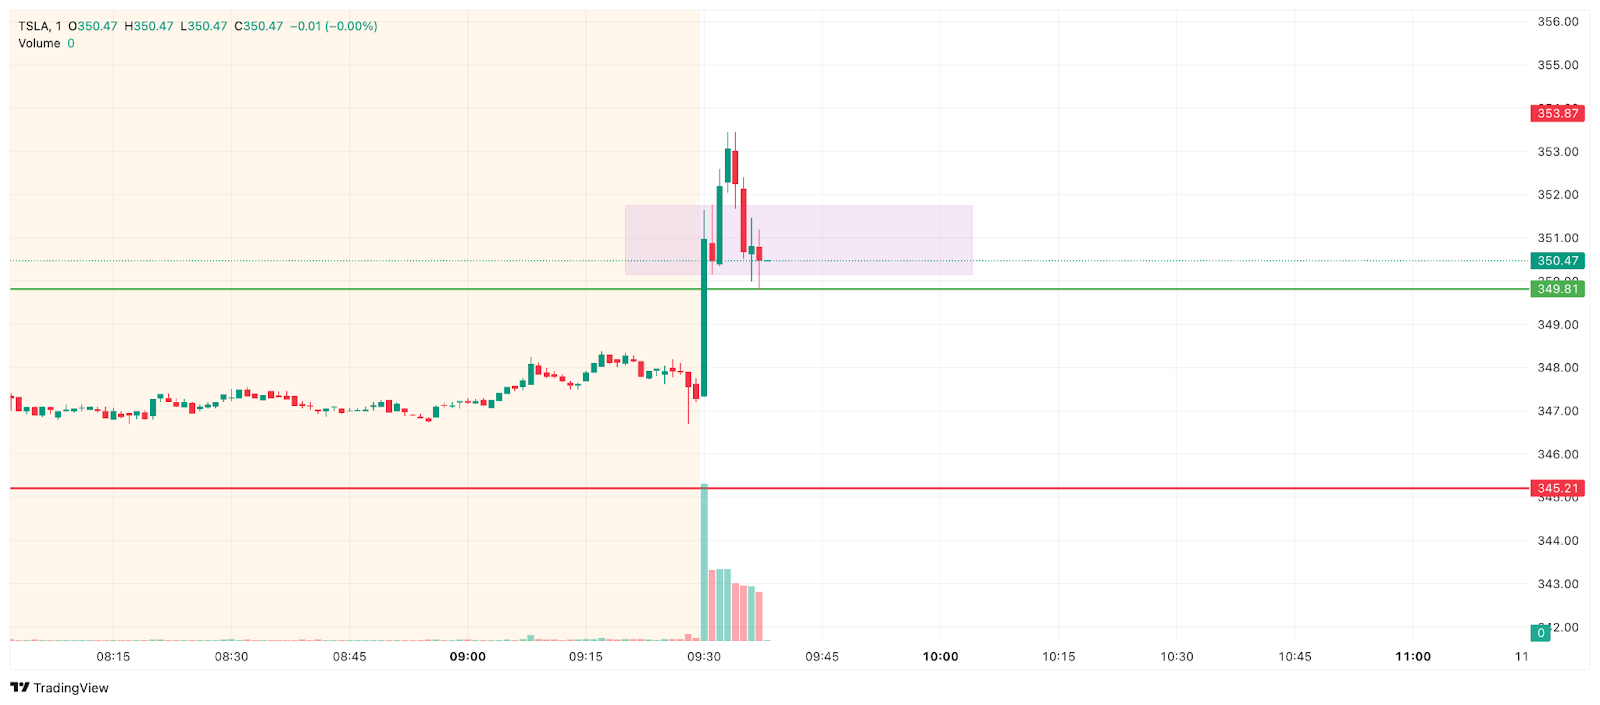
Tesla Trade – First Candle Rule (Intraday Long)
Context and Instrument
- Instrument: Tesla (TSLA)
- Type: Intraday long, options used for execution
- Session: Regular hours, focused on the opening drive
- Goal: Trade a clean trend day using the First Candle Rule (15m → 5m → 1m) with a 1:2+ R:R
Mark the First 15-Minute Candle
- Let the 9:30–9:45 AM candle form.
- Mark its high and low.
- Do nothing until the 15-minute candle is complete.
Move to the 5-Minute Chart
- Wait for a 5-minute candle to CLOSE above the 15-minute high.
- The first attempt only wicked above and closed back inside → not valid.
- The next 5-minute candle closed fully above the 15-minute high → valid break.
Move to the 1-Minute Chart
After the break, wait for a pullback to:
- The 15-minute high
- The one-candle rule zone (last down-close candle before the breakout)
One-Candle Rule Confirmation
- Price pulled back into the last down-close candle before the breakout.
- This became the micro demand zone.
Entry Trigger
- Wait for a 1-minute candle to close, showing buyers stepping back in.
- The retest candle printed strong lower wicks → buyers absorbing.
- Entry taken on the close of that confirming candle.
Stop-Loss Placement
- Stop placed below the retest structure low (below the confirming 1-minute candle).
- If that breaks, momentum is gone → setup invalid.
Target
- Target set at 360, a clean whole-number level that offered ~2R.
- High of the day gave less than 2R, so the 360 level was used.
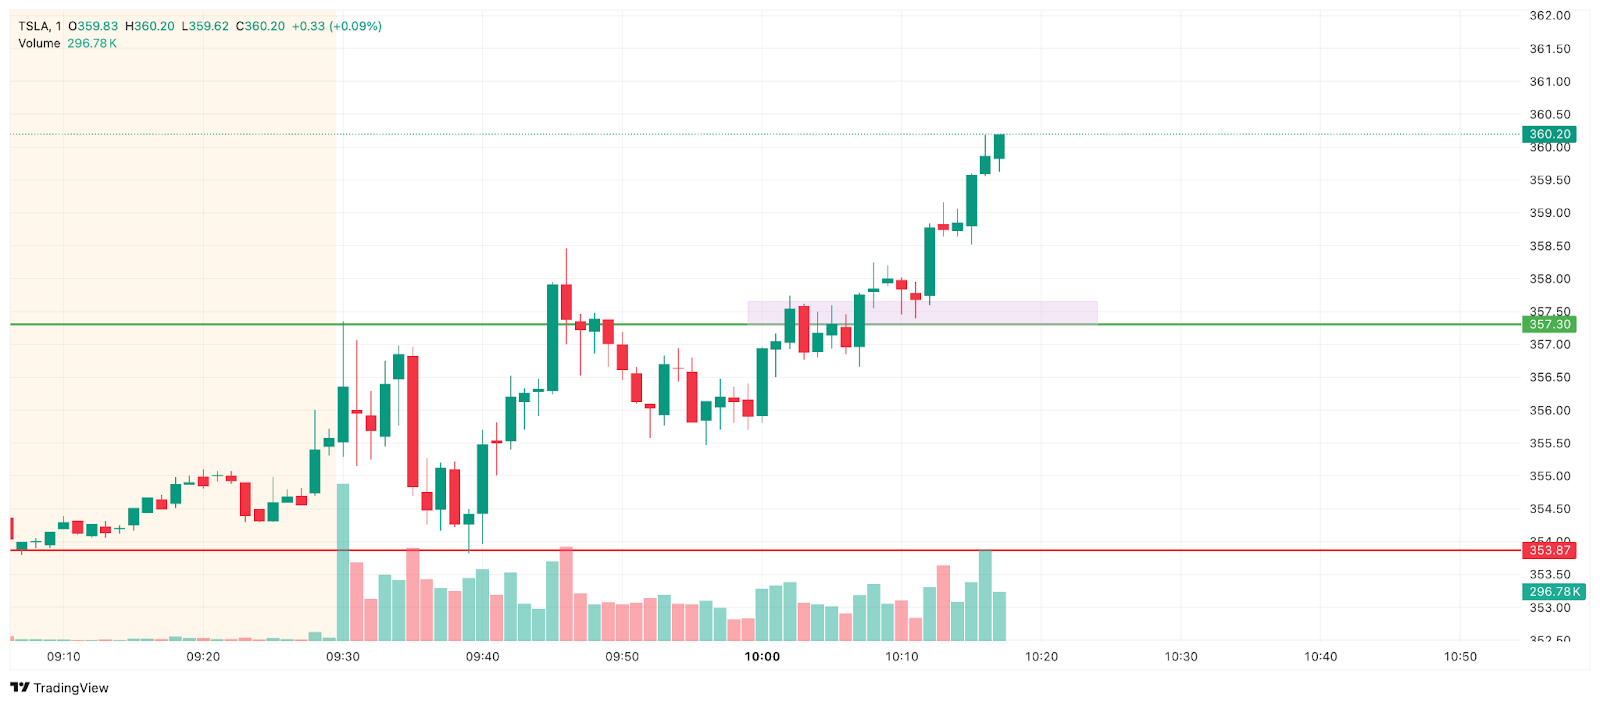
Result
- Price pushed directly to 360.
- Main position closed for approx 2.3R.
- Runners trailed using structure until stopped out.
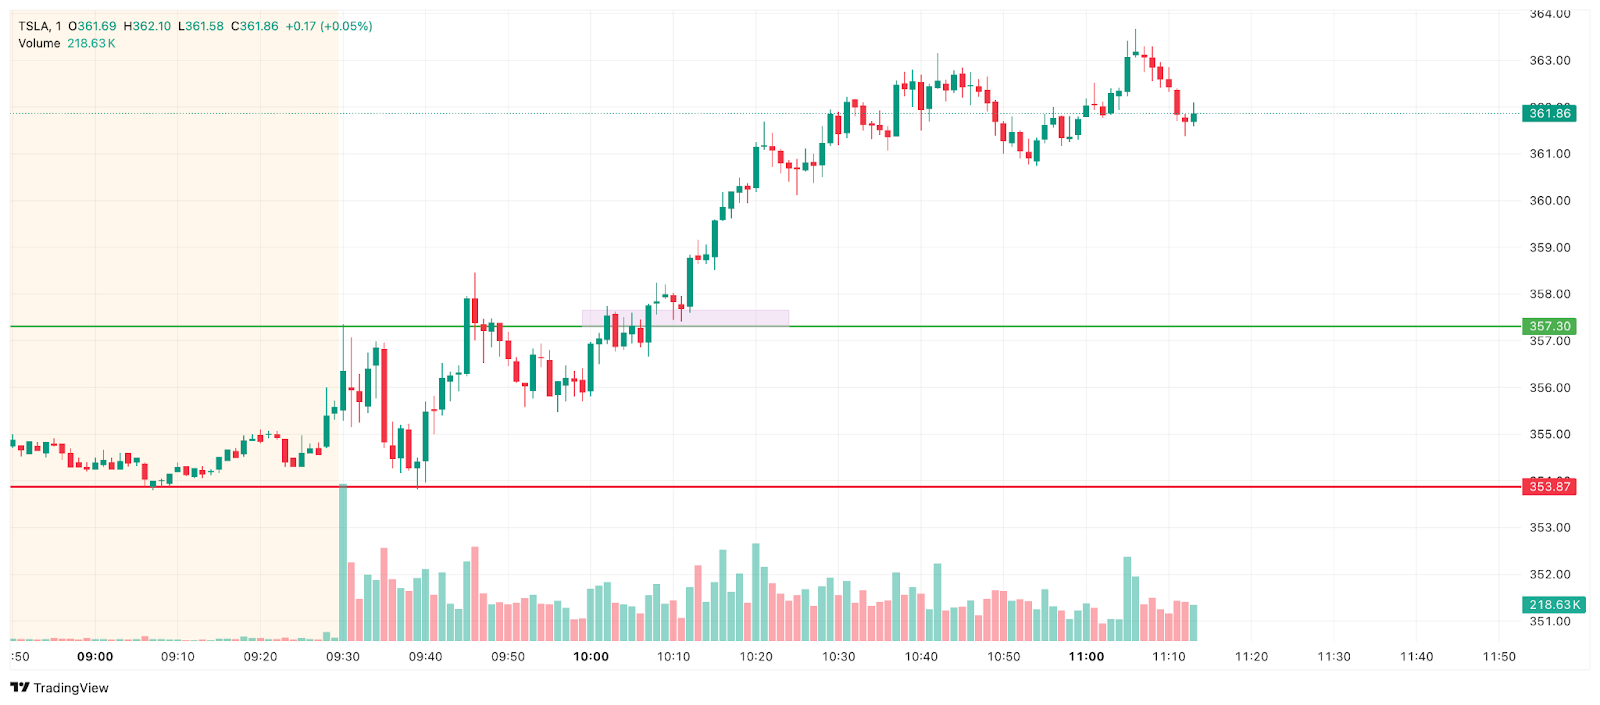
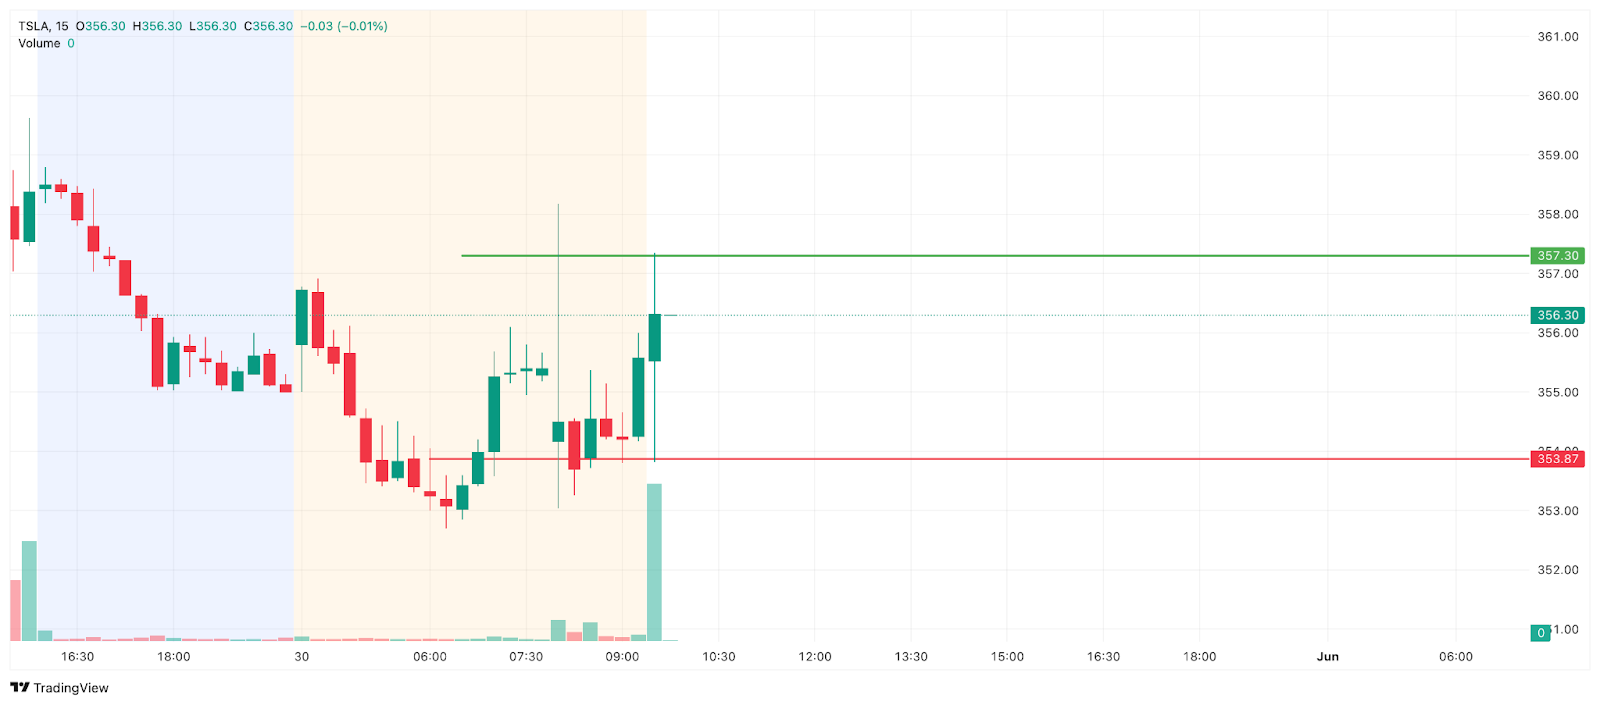
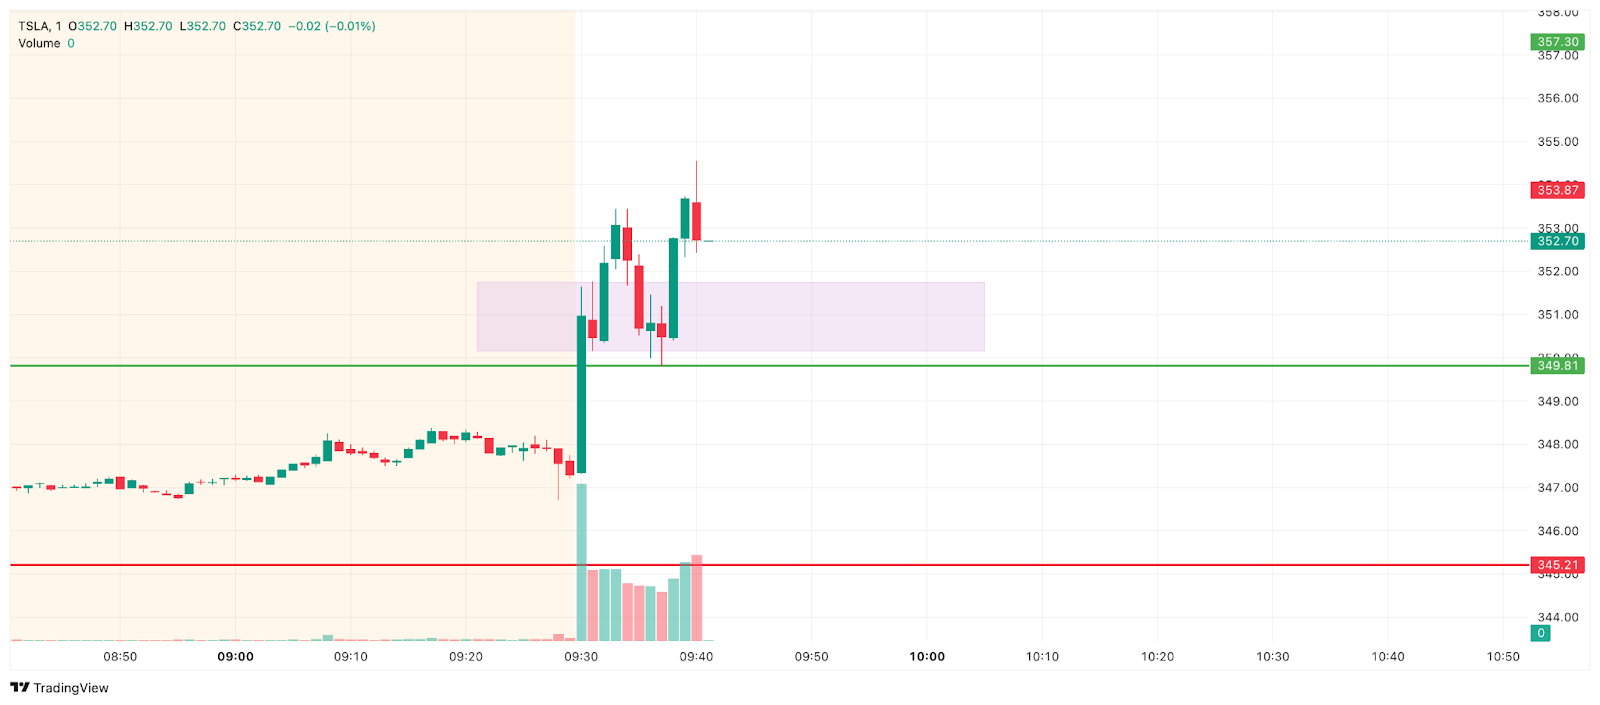
Tesla Trade Breakdown – Pre-Market Break & Retest
Mark Pre-Market Levels
- Draw the pre-market high and pre-market low from 4:00 AM to 9:29 AM.
- These are the only levels used for this setup.
Strong Reaction at the Open
- At 9:30 AM, Tesla ripped up immediately.
- The first minute showed aggressive buying — exactly what he wants to see before taking this setup.
Break Above Pre-Market High
- Price broke above the pre-market high with clear displacement — a fast, decisive move.
- The breakout must show strong momentum; slow or hesitant breaks are lower probability.
- When displacement is present, prepare for the retest.
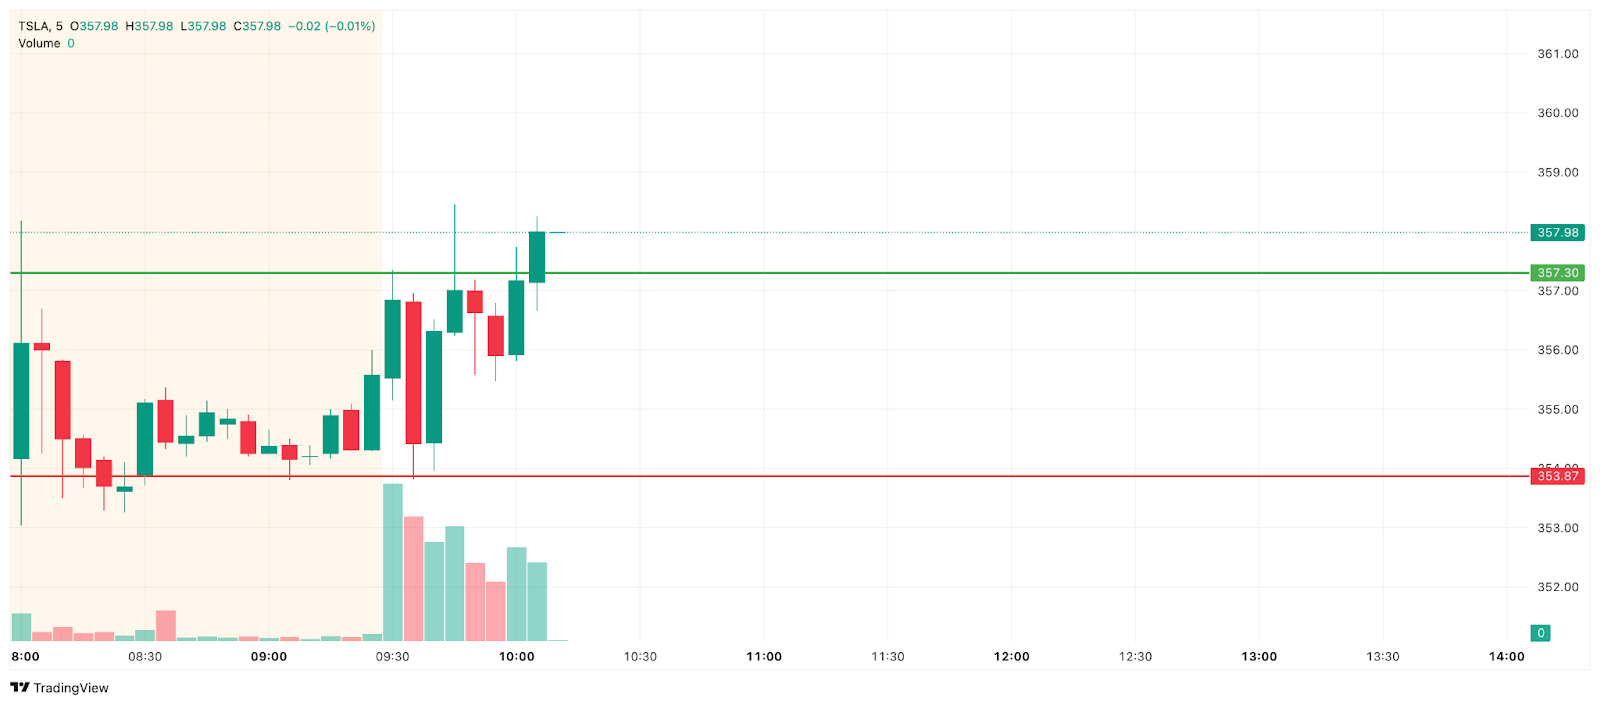
The Retest Into the Level
- After the breakout, Tesla pulled back sharply into the pre-market high.
- This retest is required — no retest, no trade.
One-Candle Rule Confluence
- The pullback tapped directly into the last down-close candle before the breakout.
- That candle becomes the one-candle rule zone.
- So the retest hit:
- Pre-market high
- One-candle zone
Perfect confluence.
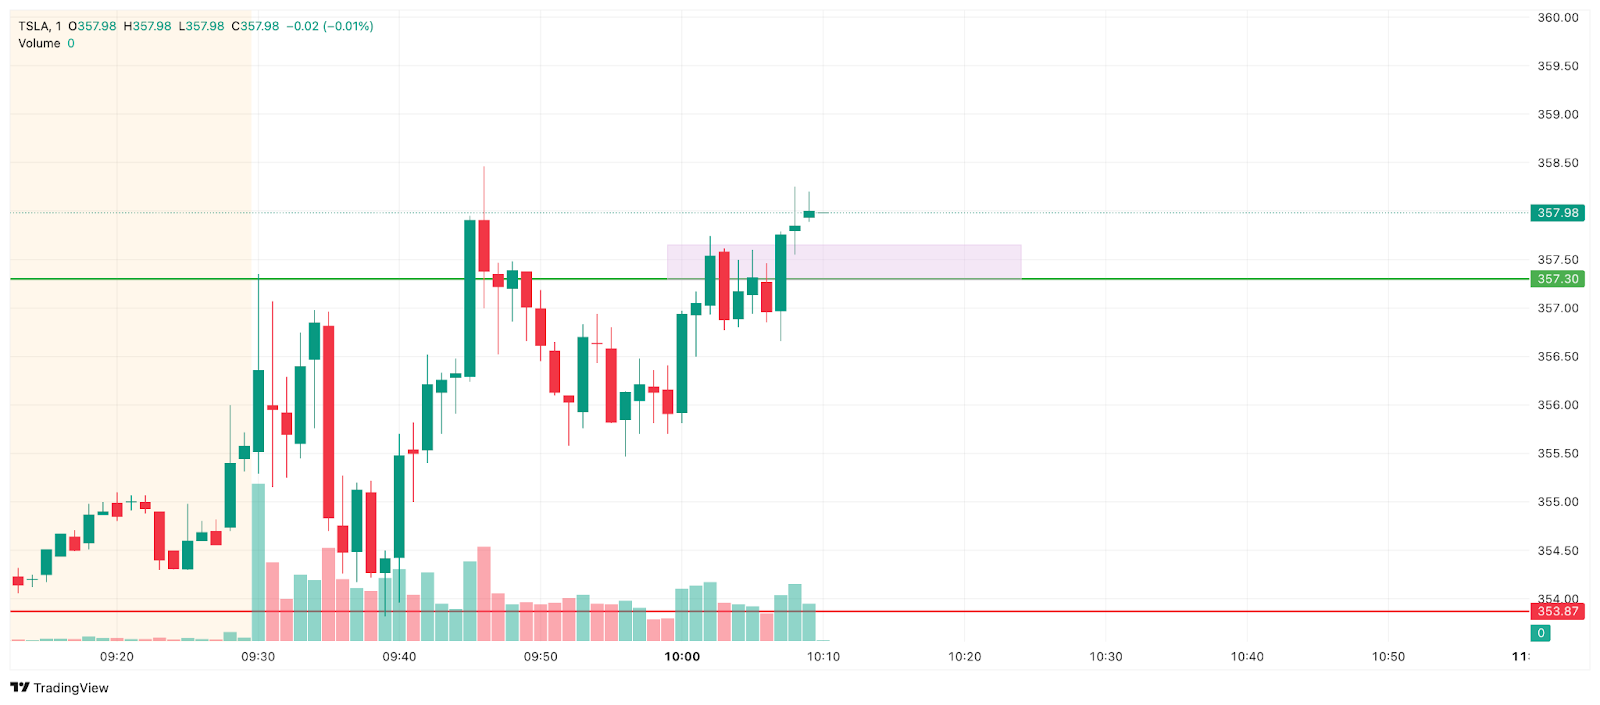
Confirmation
- On the 1-minute chart, the retest candle showed strong lower wicks.
- This showed buyers absorbing every sell attempt.
- Entry was taken only after the confirming 1-minute candle closed.
Stop-Loss
- The stop is placed just below the retest low, beneath the one-candle zone.
- If that breaks, buyer failed → trade invalid.
Target
- Target = high of day, which offered around 3R.
- Because displacement was strong, the price hit a high of the day within 2 minutes.
How to Backtest This Break & Retest Strategy
You can test this Break & Retest strategy before risking real money using TradeZella's backtesting. Load 11+ years of historical data, set up your 1-minute, 5-minute, and 4-hour charts the way you trade live, and replay the session bar by bar. Mark your support and resistance level, wait for a clean breakout, then watch for the retest into structure and the one-candle zone, the last opposing candle before the break. When a confirmation candle shows buyers or sellers stepping back in, enter with your stop beyond the structure and target at least 2R. You can also test the First Candle Rule using the opening 15-minute range and the Pre-Market Break and Retest using the pre-market high and low. Use automatic position sizing and drag your stop and target directly on the chart. Every backtested trade gets logged automatically with your entry, exit, position size, and P&L. Tag each of the three setups separately and grade them A+, A, or B so you can compare them, add notes, and review the same way you would a live trade. After 30 to 50 trades, you can see your win rate, profit factor, and expectancy on each setup, giving you a real picture of how it is likely to perform in live market conditions before you risk a dollar.
When you start trading live, import your live trades into TradeZella, the AI trading journal that does the journaling for you. Your backtest results and live results live in the same platform, so you always know how the strategy performs in testing vs how it performs with real money, without switching between tools or maintaining separate spreadsheets.
TradeZella is also introducing automated no-code backtesting, where you define your rules and run the backtest, and then it shows you how the strategy would have performed over years of historical data without you needing to step through a single chart.
Start Backtesting This Strategy Using TradeZella
Frequently Asked Questions
What is the Break and Retest Strategy?
The Break and Retest Strategy is a price-action model that reads the interaction between buyers and sellers around key levels. You identify a clear support or resistance level, wait for a clean breakout, wait for a retest back into the level, and confirm the dominant side is stepping in again before entering with a minimum 1:2 reward-to-risk. It avoids indicators and complexity, is about 90% mechanical and 10% discretionary, and works across stocks, futures, and options on any timeframe.
What is the One-Candle Rule?
The One-Candle Rule is the core of the strategy. After a breakout, the last single down-close candle before the break (for longs) or the last up-close candle (for shorts) becomes a micro demand or supply zone. Price retests that candle, and you need a candle to close back in your direction, showing buyers or sellers absorbing the other side. Entry comes on that close or the next candle, with the stop placed just beyond the one-candle zone.
What are the three setups in this strategy?
All three use the same break, retest, and confirmation principle in different contexts. The One-Candle Rule is the simplest version, entering off the last opposing candle after a breakout. The First Candle Rule filters the open by marking the first 15-minute candle's range, confirming a break on the 5-minute chart, and entering on the 1-minute retest. The Pre-Market Break and Retest marks the pre-market high and low, then trades a strong breakout and quick retest at the open, working best on gap-up or gap-down days.
What is the difference between A+, A, and B-grade setups?
An A+ setup has the retest holding both the one-candle zone and the key support or resistance level, clear absorption on the candlestick, and aligned higher timeframes. An A setup holds the one-candle rule with strong price action but slightly misses the key level. A B setup has only the one-candle rule holding, with an unclear higher timeframe, and should be traded with reduced size. Grading setups this way keeps you sizing up on the cleanest conditions and down on the weaker ones.
What timeframes and instruments does this strategy use?
The system works on all markets and timeframes, but the primary structure uses the 1-minute chart for entries, the 5-minute for context, and the 4-hour for higher-timeframe swings. Intraday trades are taken only between 9:30 and 11:00 AM EST when volume and momentum are strongest, while swing trades can run for days using the same logic. It applies to stocks, futures, and options, and for beginners it works with just two to three contracts as long as the rules are followed consistently.
Can I backtest the Break and Retest Strategy?
Yes. You can test this strategy using TradeZella's backtesting with 11+ years of historical data. Replay sessions bar by bar, mark your level, wait for the breakout and retest into the one-candle zone, and enter on the confirmation candle, or test the First Candle Rule and Pre-Market Break and Retest the same way. Every trade logs automatically with entry, exit, position size, and P&L, and you can tag each setup and grade separately. After 30 to 50 trades you can see your win rate, profit factor, and expectancy on each setup before risking real money.
What is TradeZella backtesting?
TradeZella backtesting lets you replay 11+ years of historical market data across forex, futures, stocks, and crypto and place trades as if you were trading live. Set up your timeframes the way you trade, use automatic position sizing, drag your stop and target directly on the chart, and every trade gets logged automatically with your entry, exit, position size, and P&L. TradeZella is also introducing automated no-code backtesting, where you define your strategy rules in plain English and the engine runs them across years of historical data, showing every individual trade executed with the results without you needing to do anything.