


Built For
Instruments: Stocks
Trading Style: Day Trading/Swing Trading
Strategy Overview
The Episodic Pivot (EP) strategy focuses on stocks that have been ignored for a long time and then suddenly experience a powerful, game-changing catalyst.
The core idea:
A neglected stock receives new information (a “catalyst”) that forces the market to reprice it very quickly, often leading to gains of 50–300% or more in a short period of time. These moves can unfold in as little as 10–20 trading days. The aim of the playbook is to:
- Get positioned at the beginning of that re-rating
- Use the catalyst and volume as confirmation
- Manage risk with clear, tight levels
- Scale size intelligently when the conviction is high
Over time, this concept has grown into a family of EP setups, allowing a trader to find not just a few opportunities per year, but dozens or even hundreds, depending on market conditions.
What Is an Episodic Pivot?
An Episodic Pivot (EP) is a move that has three core elements:
Neglect
- The stock has done very little for months.
- It may be trading near lows or stuck in a dead range.
- There is no strong narrative or consistent interest.
New Catalyst
A piece of information that changes the stock’s story, such as:
- Blowout earnings or sales growth
- A business turnaround
- A new product, CEO, or strategic shift
- A powerful theme or story the market is excited about
- Extremely abnormal trading volume (implied catalyst)
Rapid Repricing
- Large gap and strong follow-through
- Huge increase in volume
- The entire 100–300% (or more) move can happen in a few days to a few weeks.
The strategy is built around recognising when this “episode” starts and then riding the repricing while the catalyst is still fresh.
Strategy Setups
The EP Family – Types of Episodic Pivots
Over time, the original EP idea expanded into several related patterns.
1. Classical Earnings / Sales Growth EP
This is the original “textbook” EP.
Context
- The stock has been neglected for months.
- No major interest, low volume, no strong trend.
- Earnings or a pre-announcement suddenly reveal very strong sales growth.
What do you want to see
- Strong sales growth, ideally triple digit (100%+).
- Clear guidance that high growth is likely to continue for multiple quarters.
- A relatively small or mid-sized company, where a re-rating can have a big impact.
- A substantial gap up on the day of the news, with heavy volume.
These are growth EPs – situations where the market was not pricing in strong growth and is forced to adjust quickly.
Entry & Exit
Enter near the open on Day 1 using a market-on-open order or within the first 5–10 minutes if strength confirms. Place the stop below the opening-range low. Trail the position under daily swing lows and exit if the trend breaks or the catalyst loses strength.
Turnaround EP
Here, the company moves from problems to recovery.
Context
The company has experienced:
- Declining sales
- Management issues
- Product or competitive problems
- A difficult business cycle
- The stock has been heavily sold and is very cheap relative to its potential.
What you want to see
- A clear and credible turnaround in earnings or profitability.
- Strong improvement after a period of poor performance.
- A meaningful reaction: strong gap up, strong trend, and heavy volume.
Behaviour
- Turnaround EPs often trend for longer than pure growth EPs.
- The move can last for multiple quarters if the underlying problems have truly been fixed.
- Because the company was so beaten down, the runway for re-rating is large.
Trade management is often less aggressive here because the runway is longer.
Entry & Exit
Enter on Day 1 after the turnaround catalyst is confirmed, or enter early in the emerging trend after the first clean pullback. Place the stop below the nearest logical swing low. Trail loosely because these moves often last for months, and exit only if the larger trend clearly breaks.
Story / Thematic EP
These EPs are driven more by narrative than by current fundamentals.
Context
The stock is linked to a hot theme such as:
- AI
- Crypto / Bitcoin treasuries
- Quantum computing
- Robotics
- Weight-loss drugs, etc.
- The company may not yet have strong earnings or sales, and may never become highly profitable.
- In the short term, the story alone can drive very large moves.
What you want to see
- A simple, powerful story that the market can easily understand and talk about.
- Very strong volume and large price moves when the story catches on.
- The stock often moves alongside a group of similar “theme” names.
These setups are more speculative, but can deliver some of the largest percentage moves if managed correctly.
Entry & Exit
Enter on Day 1 if the theme is strong, or enter on Day 2–3 when the stock breaks out from consolidation with volume. Use a tight stop below the breakout level or consolidation low. Exit on weakness, loss of momentum, or if volume fades since theme-driven moves can reverse quickly.
EP 9 Million – Volume-Based EP
This is a more objective, volume-driven extension of the EP concept.
EP 9 Million: any stock that trades 9 million shares or more in a single day, which is far above its normal volume.
The logic:
- Abnormal volume is information.
- If a stock with a relatively small float trades several times its float in one day, something significant is happening.
- You may not even need to fully understand the story – the volume itself is the clue.
How it’s used
- Daily scan for stocks trading >9 million shares above a minimum price (for example, above $3).
- Look for:
- Volume that is many multiples of the stock’s usual trading activity.
- A strong gap or powerful intraday trend.
- Many modern story EPs first appear as EP 9M candidates.
EP 9M is essentially a filter that highlights where the market’s attention has suddenly concentrated.
Entry & Exit
Enter intraday once volume above 9 million shares aligns with a clear trend, or enter the next day if the closing action is strong. Place the stop under intraday support. Exit if volume collapses, momentum fades, or the trend structure breaks.
Delayed Reaction EP (Long)
As markets have evolved, day-one moves have become more aggressive. It is common to see:
- Gaps of 20–40% or more
- Very large intraday ranges
- Volatile, noisy price action on the first day
,As a result, immediate entries can require wide stops and may be stressful or inefficient. The solution is the Delayed Reaction EP.
Structure
Day of the catalyst:
- The news is released and volume explodes.
- Price may gap up, then fade, or close weak.
Instead of forcing a day-one trade:
- You log the stock and the catalyst.
- You add it to a dedicated watchlist.
- You monitor it for up to a month after the catalyst.
Entry triggers
A clean secondary move, such as:
- A strong red-to-green day after consolidation.
- A breakout from a tight range formed after the catalyst day.
- A convincing reclaim of a key level with strong volume.
Entry and stop
- Enter when the secondary strength shows itself.
- Place the stop at:
- The low of the entry day, or
- The low of the structure you are trading against.
Because these entries are tighter and more controlled, it is often possible to use larger position sizes on high-conviction delayed EPs.
Delayed Reaction EP (Short)
The same idea applies to negative catalysts.
Structure
Negative catalyst day:
- The company cuts guidance, reports very poor earnings, or reveals a serious problem.
- The stock gaps down sharply.
Many traders immediately buy the dip, assuming the worst is already priced in. The stock often bounces for a few days, then the real decline begins.
Approach
Instead of shorting on day one:
- Wait for a bounce into resistance.
- Look for a lower high or a clear failed rally.
- Enter as the delayed weakness appears.
Entry and stop
- Enter short once the bounce shows signs of failure.
- Place the stop above the high of the bounce or above the key resistance level.
This approach typically offers a calmer, higher-quality short entry with clearly defined risk.
Sugar Babies
“Sugar babies” are recurring EP-style names. A basket of stocks (for example, 25 names) that have repeatedly shown:
- 40–50% bursts in 5–6 days
- Frequent, short-term explosive moves over several years
How they are used
- You track them constantly.
- Every time they:
- Break out with strong volume, or
- Pull back after a strong move into a logical support area, and you treat those moves as EP-like opportunities.
This is effectively a curated list of habitual runners built from observing past EP behaviour.
Entry & Exit
Enter on a strong volume breakout or on a clean pullback into support, followed by renewed strength. Place a tight stop beneath the breakout level or pullback low. Exit quickly once momentum slows, as these are short, explosive 5–6 day moves.
Pros and Cons of the Strategy
This strategy is designed to deliver high-quality, repeatable setups — but like any trading strategy, there are key things to understand before using it.
Note: The cons listed here aren’t disadvantages. They are things to be aware of — important characteristics that require patience, discipline, and proper management to make the strategy work effectively.
Pros
You get in at the start of the move: EP setups position you right at the beginning of a major repricing, giving you the best risk-reward.
High risk–reward potential: A single EP can move an account 20–50% or even 100%+ because the catalyst attracts heavy institutional buying.
Tight, defined risk (especially on delayed entries): Day-one EPs offer clear initial stops, while delayed reaction setups allow even tighter stops and bigger sizing.
Works for both longs and shorts: The same concept applies to negative catalysts. Short EPs are almost always better as delayed setups.
Can grow small accounts quickly: With conviction, traders can confidently size up because they understand the catalyst.
More opportunities with variations: Classical EPs offer only a few trades a year, but adding stories, EP 9M, delayed reactions, and sugar babies opens the door to dozens or even hundreds of opportunities.
Cons
Day-one trades now need wider stops: Modern catalysts create big gaps and big volatility, making day-one entries harder.
Requires strong analytical skills: You must interpret earnings, understand catalysts, and know how sectors react. This takes time and experience.
Hesitation means missing the trade: If you’re late by even a few minutes, you often can’t get in again. Strong EPs “just go.”
Limited opportunities if only using classical EPs: Pure earnings/sales EPs only offer about 5–10 trades a year.
Hard to size aggressively on story stocks: Story EPs often involve weak companies, making it emotionally difficult to size big even though they move big.
Markets change, making execution harder: bigger gaps and faster reactions require constant adaptation.
Not easy for beginners: New traders may struggle because EPs require quick decision-making, catalyst understanding, and experience.
Trade Breakdown
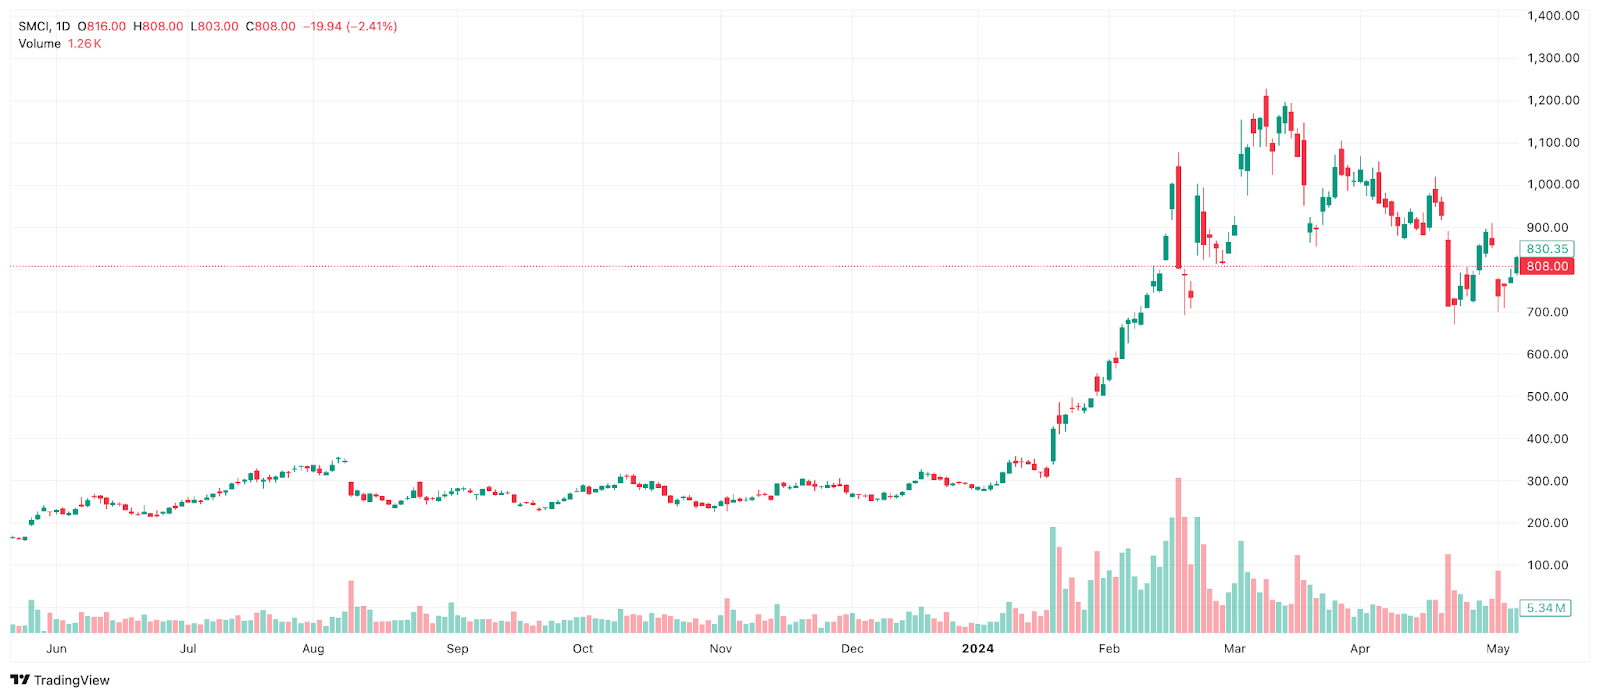
SMCI – Growth EP Trade Example
Catalyst
SMCI issued a pre-announcement reporting extremely strong upcoming sales:
- Sales expected to double
- Next 2–3 quarters projected to show 100%–200%+ sales growth
The stock had been quiet and ignored before this announcement.
Day 1 Reaction
The stock moved up 35% on the day of the announcement with very heavy volume.
This confirmed the start of a Growth EP.
Entry and Stoploss
- Entered at the open using a Market-on-Open (OPG) order to secure the opening print.
- Initial stop placed below the Day 1 low, keeping risk tight.
After the catalyst day, the stock continued trending higher:
- Total move: +189%
- Time: 28 trading days
Trade Management
- Stop moved to break-even once the trade pushed favorably
- Stop trailed below daily swing lows as the trend developed
- Allowed the move to play out until the trailing stop was eventually hit
ROOT – Growth EP Trade Example
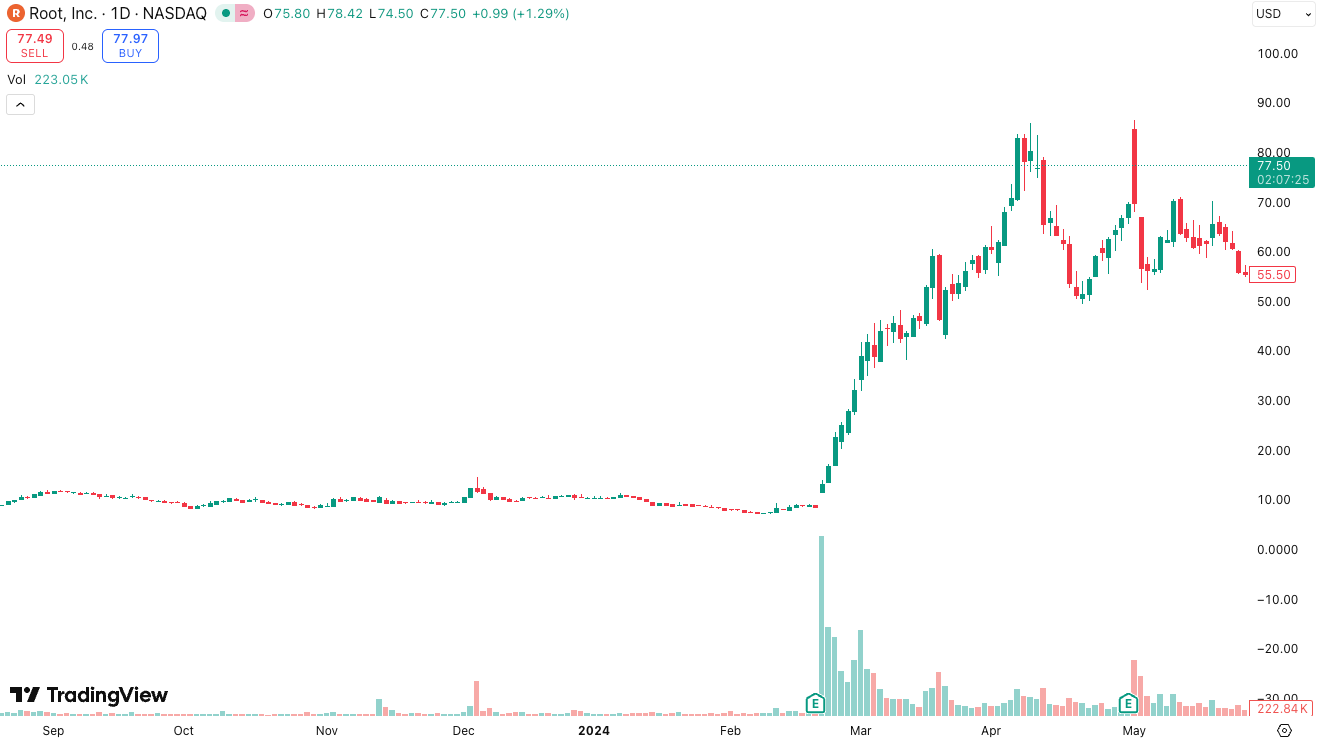
Catalyst
ROOT had been ignored for 6–7 months with no interest in the stock. Then the company reported blowout earnings with extremely strong sales growth:
- 56%
- 173%
- 264%
- 287%
The company was very small (around $100–200M market cap), and the upcoming sales numbers were larger than the company’s own valuation. This created a major surprise to the market.
Day 1 Reaction
The earnings were announced at night. The next day ROOT began a strong Episodic Pivot move with heavy volume.
Entry & Stop
- Entry taken on the morning after earnings
- The initial stop placed below the structure of that day
ROOT made a massive run: +358% in about 16–17 days.
Trade Management
- Moved the stop to break-even once the trade moved strongly
- Then trailed the stop underneath each day’s low as the trend continued
- Eventually, a pullback hit the trailing stop, ending the trade
After the trailing stop was triggered, the stock later extended another +55%
Why It Worked
A neglected stock suddenly showed multi-quarter triple-digit sales growth, forcing the market to reprice it quickly.
ANF – Turnaround EP Trade Example
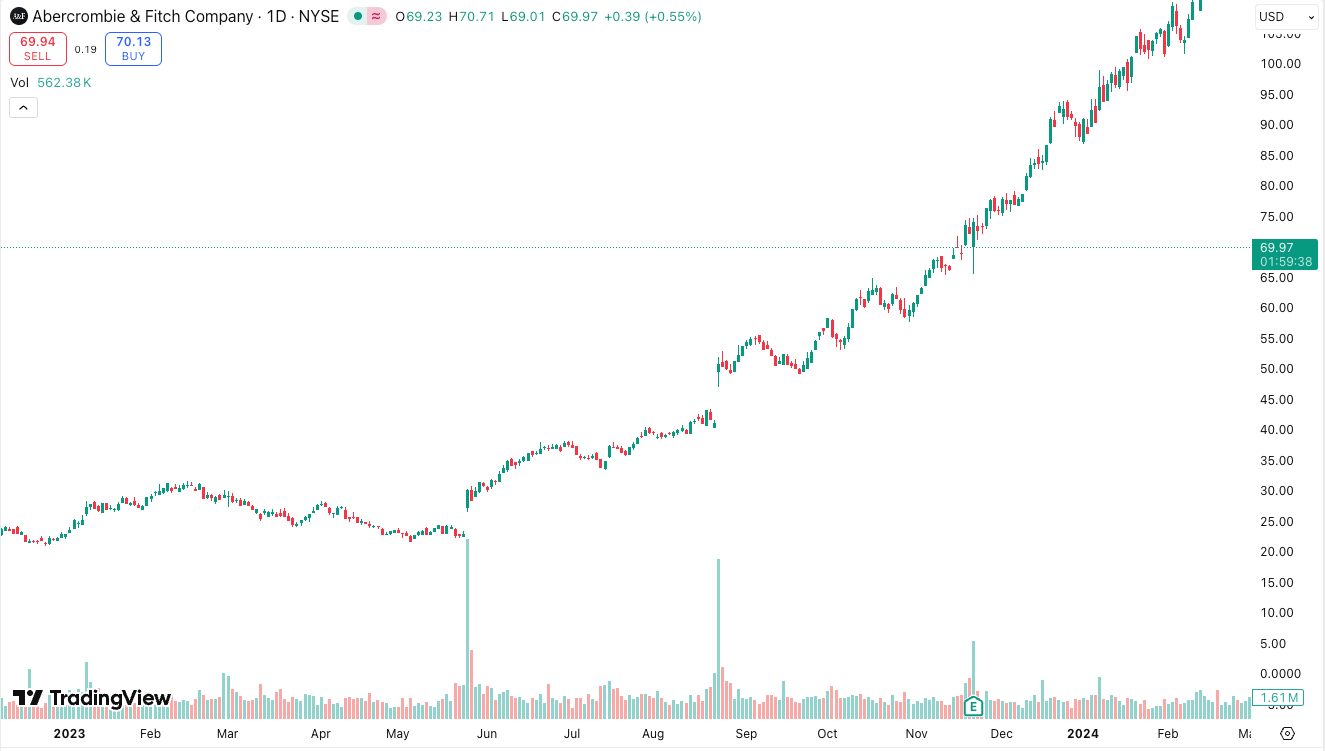
Catalyst
ANF had gone through a long period of problems:
- Product issues
- Management scandals
- Loss of relevance
- Weak performance over multiple quarters
The stock had been beaten down heavily and left for dead. A new CEO entered the company, and the business began to improve. This led to a major turnaround in profitability.
One of the earnings reports showed a dramatic shift: +244% profit growth. This confirmed a true turnaround rather than a temporary bounce.
Day 1 Reaction
When the turnaround earnings were released, the stock reacted strongly with heavy volume and began a sustained new trend.
Entry & Stop
- Entry taken on the turnaround earnings day
- Initial stop placed below the Day 1 structure
ANF produced a long, steady move:
- From the turnaround EP day, the stock rallied +240%
- Over the full multi-month trend, ANF climbed roughly 700–800%, moving from the low $20s to around $200
Trade Management
- Stop tightened only gradually because turnaround EPs have longer runways
- Stops trailed beneath significant swing lows, not aggressively
- The trade allowed time for multiple quarters of improvement to play out
Why It Worked
A deeply neglected company shifted from failure to recovery.
Turnaround EPs often last longer than growth EPs because:
- The business problems are fixed
- The valuation is extremely depressed
- Institutions accumulate over many months
- The re-rating happens over multiple earnings cycles
ANF fit this process perfectly, producing a long-lasting and powerful trend.
HIMS – Delayed Reaction EP Trade Example
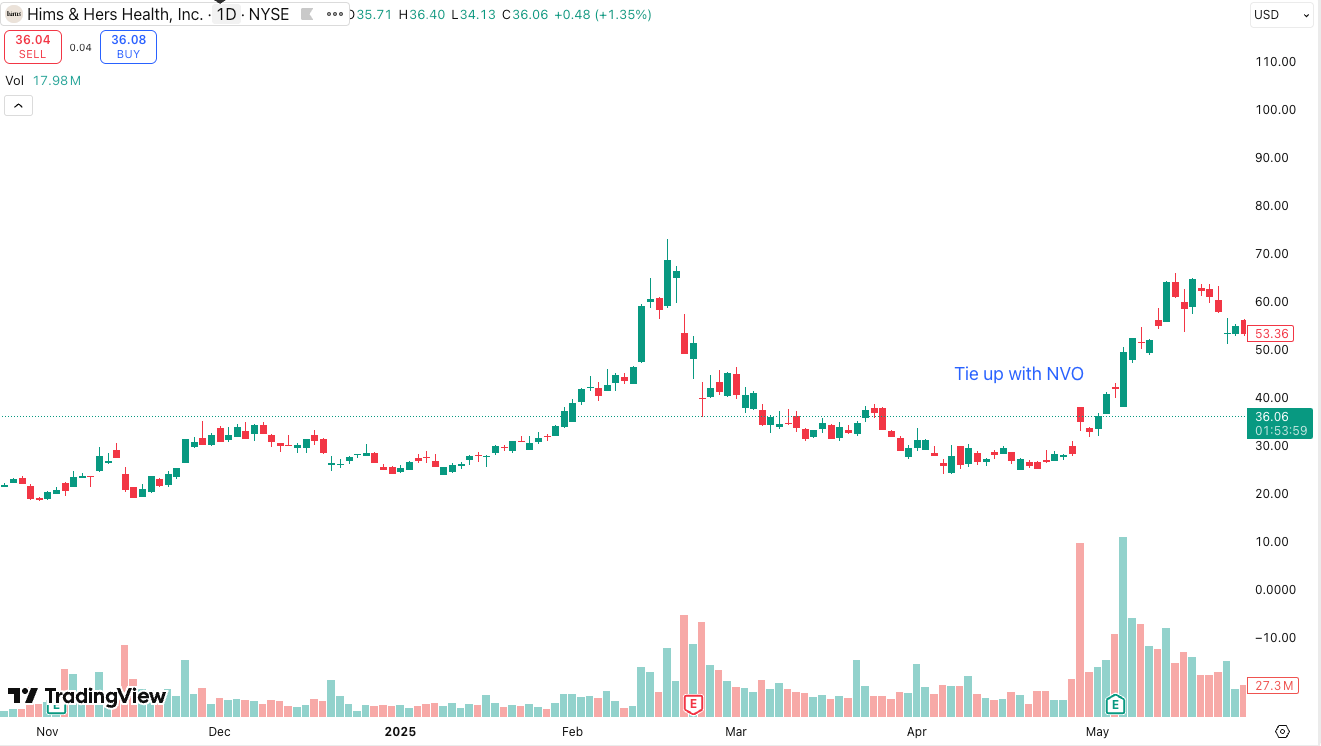
Catalyst
HIMS had dropped about 62% because of a major overhang:
- The company was selling compounded versions of weight-loss drugs (Ozempic / Wegovy) during a national shortage
- When the shortage ended, the FDA stopped compounding, removing a major revenue source
The market lost confidence, and the stock trended downward.
A new catalyst appeared when: HIMS announced an official partnership with Novo Nordisk, the pharmaceutical company that makes Wegovy and Ozempic.
This removed the overhang and re-opened the company’s ability to provide the most in-demand weight-loss drugs legally and officially.
Day 1 Reaction
On the day this news became public:
- Volume exploded to 152 million shares (the highest in the company’s history)
- Price initially moved but closed weak, failing to hold strength
Because the first day did not follow through, it did not give a clean Day-1 entry. This made it a delayed reaction EP candidate.
Entry & Stop
The stock went onto the delayed EP watchlist. Several days later, a clean secondary signal formed:
- Price opened red and turned red-to-green intraday
- Volume confirmed the shift
- Entry was taken on the red-to-green turn
Stop was placed:
- Below the low of the entry day
After the delayed reaction entry, the stock moved strongly upward and produced a clean EP continuation move.
Trade Management
- Stop remained at the entry-day low
- As the trend advanced, stops trailed underneath developing swing lows
- The trade followed a straightforward EP trend management until the move was completed
Why It Worked
- The first-day reaction showed massive interest but lacked immediate follow-through
- The catalyst was still valid
- Delayed reactions allow tighter entry and clearer confirmation
- The red-to-green turn provided the timing signal for the secondary move
This is the exact structure of a Delayed Reaction EP: The catalyst is real, Day-1 is messy, the clean entry appears later.
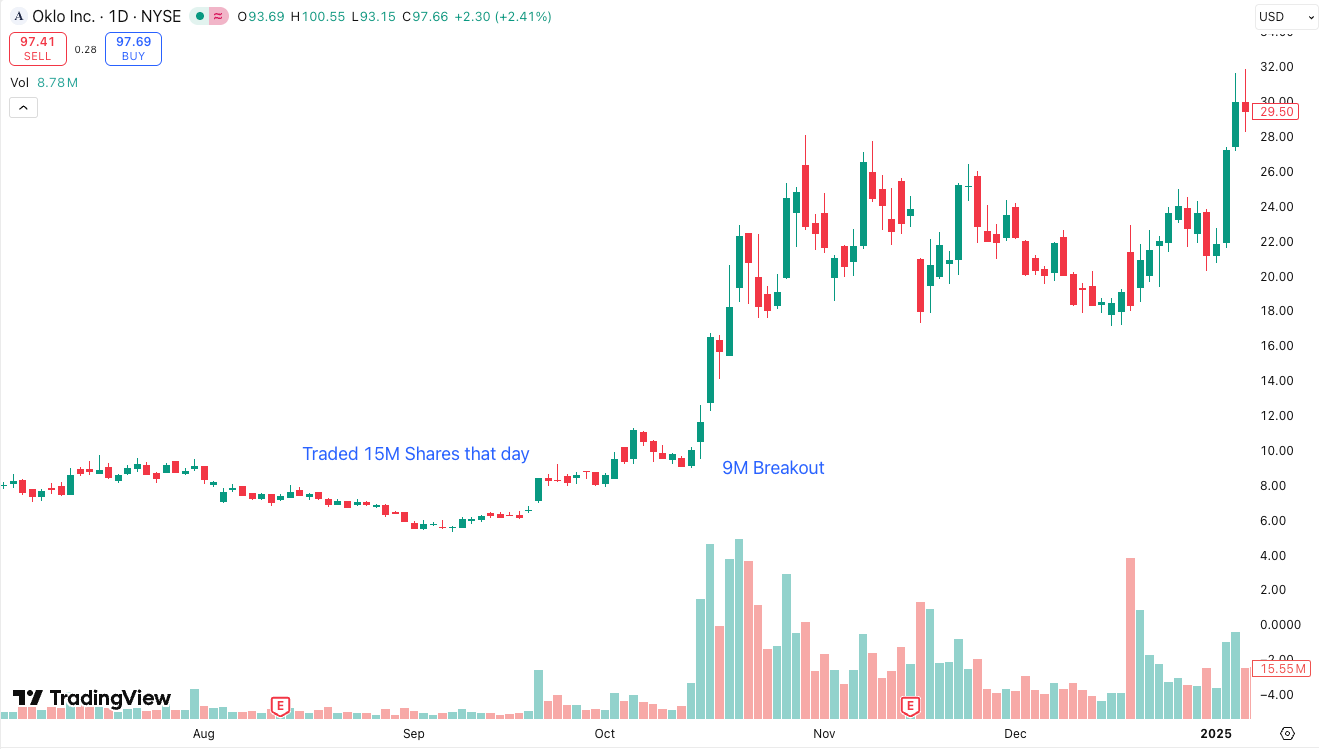
OKLO – 9M EP Trade Example
Catalyst
OKLO is a small-cap nuclear technology company.
Its first major signal came when the stock suddenly traded far above its normal volume, qualifying as a 9M EP (a volume-based Episodic Pivot).
The stock had never traded anywhere near that level of activity before, indicating a major shift in interest.
Day 1 Reaction
The initial 9M EP appeared on a breakout day when OKLO traded over 15 million shares, confirming the start of an EP-level move driven entirely by abnormal demand.
Entry & Stop
- Entry taken on the high-volume breakout
- Stop placed below the breakout day’s low
The stock had a strong upside move. Later in the trend, OKLO generated a second 9M breakout, creating another valid EP entry opportunity and launching the next leg higher.
Trade Management
- Maintain stop below the breakout day’s low
- Trail stops under developing swing lows as momentum continues
- Exit when momentum fades or a trailing stop is hit
Why It Worked
OKLO consistently showed abnormal, explosive volume, signaling strong demand and repeated interest from market participants.
In the 9M EP framework, the extreme volume itself acts as the catalyst, confirming a shift in the stock’s behavior and initiating scalable breakout opportunities.
How to Backtest This Episodic Pivot Strategy
The fastest way to test this Episodic Pivot strategy is with TradeZella's automated no-code backtesting. Define your rules in plain English, hit run, and TradeZella runs them across 11+ years of historical data in seconds, then shows you every individual trade along with your win rate, profit factor, and expectancy instantly, without you stepping through a single chart. It is the quickest way to see whether the setup holds up before you risk a dollar.
You can also test it manually by replaying the market bar by bar. Load 11+ years of historical data, set up your daily and intraday charts the way you trade live, and replay sessions bar by bar. Find a neglected stock that gaps up on a real catalyst with abnormal volume, then take the setup that fits: a Day 1 entry near the open on a growth, turnaround, or story EP, a 9 Million volume entry, or a Delayed Reaction entry on the secondary red-to-green move or breakout days after the catalyst. Place your stop below the opening-range or structure low, trail beneath daily swing lows as the trend develops, and exit when the trend breaks or the catalyst fades. Use automatic position sizing and drag your stop and target directly on the chart. Every backtested trade gets logged automatically with your entry, exit, position size, and P&L. Tag each EP type, growth, turnaround, story, 9M, and delayed reaction, so you can compare them, add notes, and review the same way you would a live trade. After 30 to 50 trades, you can see your win rate, profit factor, and expectancy on each setup. Manual replay is the best way to build screen time and a real feel for the setup.
When you start trading live, import your live trades into TradeZella, the AI trading journal that does the journaling for you. Your backtest results and live results live in the same platform, so you always know how the strategy performs in testing vs how it performs with real money, without switching between tools or maintaining separate spreadsheets.
Start Backtesting This Strategy Using TradeZella
Frequently Asked Questions
What is the Episodic Pivot strategy?
The Episodic Pivot, or EP, strategy targets stocks that have been ignored for a long time and then suddenly receive a major catalyst that forces the market to reprice them quickly, often 50% to 300% or more in as little as 10 to 20 trading days. The goal is to get positioned at the start of that re-rating, use the catalyst and volume as confirmation, manage risk with tight, clear levels, and size up when conviction is high. Over time it has grown into a family of EP setups offering dozens of opportunities a year.
What are the three core elements of an Episodic Pivot?
Every EP has three elements. Neglect: the stock has done very little for months, often near lows or stuck in a dead range with no narrative. New catalyst: a piece of information that changes the story, such as blowout earnings, a turnaround, a new product or CEO, a powerful theme, or extremely abnormal volume. Rapid repricing: a large gap with strong follow-through and a huge volume increase, where the entire move can happen in days to weeks. The strategy is about recognizing when that episode begins and riding it while the catalyst is fresh.
What are the types of Episodic Pivots?
The EP family includes the Classical Growth EP (strong sales or earnings growth), the Turnaround EP (a beaten-down company returning to profitability, which often trends longer), the Story or Thematic EP (driven by a hot narrative like AI or crypto), EP 9 Million (a volume-based filter), the Delayed Reaction EP (entering on a clean secondary move after a messy Day 1, for longs or shorts), and Sugar Babies (a curated basket of habitual runners that repeatedly produce short, explosive 40% to 50% bursts).
What is a Delayed Reaction EP?
A Delayed Reaction EP is used when the catalyst day is too messy for a clean entry, which is common now that day-one gaps of 20% to 40% and wide ranges are normal. Instead of forcing a Day 1 trade, you log the stock and catalyst, add it to a watchlist, and monitor it for up to a month. You enter on a clean secondary signal, like a strong red-to-green day, a breakout from a tight post-catalyst range, or a convincing reclaim of a key level on volume, with the stop at the entry day or structure low. Because the entry is tighter, you can often size larger. The same idea works in reverse for shorts after a negative catalyst.
What is EP 9 Million?
EP 9 Million is a volume-based version of the EP concept: any stock that trades 9 million shares or more in a single day, far above its normal volume. The logic is that abnormal volume is information, so if a small-float stock trades several times its float in one day, something significant is happening even if you do not yet understand the story. You scan daily for stocks above 9 million shares and a minimum price, look for volume that is many multiples of normal plus a strong gap or trend, and use it as a filter for where the market's attention has suddenly concentrated.
Can I backtest the Episodic Pivot strategy?
Yes. You can test this strategy using TradeZella's backtesting with 11+ years of historical data. Replay sessions bar by bar, find a neglected stock gapping on a real catalyst with abnormal volume, then take the Day 1, 9 Million, or Delayed Reaction entry that fits, placing your stop below the opening-range or structure low and trailing under daily swing lows. Every trade logs automatically with entry, exit, position size, and P&L, and you can tag each EP type to see which produces your edge. After 30 to 50 trades you can see your win rate, profit factor, and expectancy before risking real money.
What is TradeZella backtesting?
TradeZella backtesting lets you test a trading strategy against 11+ years of historical market data across forex, futures, stocks, and crypto, down to seconds-level timeframes. You can do it two ways. Replay the market bar by bar and place trades as if you were trading live, with your own timeframes, automatic position sizing, and stops and targets you drag right on the chart, and every trade logs automatically with entry, exit, size, and P&L. Or use automated no-code backtesting: define your strategy rules in plain English and the engine runs them across years of data in seconds, returning every individual trade it took with the exact setup drawn on the chart, so you see why each trade fired instead of just an equity curve. Zella AI then analyzes the results and flags what to fix.