


Built For
Instruments: Stocks/Options/Futures
Trading Style: Day Trading
Strategy Overview
The Market DNA strategy is built around one simple idea: buyers and sellers move the market. Indicators, Fibonacci levels, and chart patterns don’t actually move price; they only reflect what has already happened. By focusing on who is in control, the aggressive buyers or aggressive sellers, you can trade with real precision and confidence.
Market DNA is about finding where aggressive participants are stepping in and using that information to reduce risk and catch powerful moves. The strategy relies on tape reading, market depth (Level II), and liquidity zones. Instead of guessing with indicators, you’re watching the actual battle between supply and demand in real time.
This is especially effective in stocks (and stock options for leverage) and futures, where the centralized market gives accurate order flow data. Forex is avoided because it is decentralized and doesn’t provide true volume or depth, making it unreliable for this method.
Strategy Rules
- Look for large-cap stocks with strong catalysts (earnings, news releases, political events, sector shifts).
- Futures (NQ, ES) are valid because of centralized data.
- Avoid Forex because “you’re getting lied to.” Volume and depth are not real.
Identify Significant Levels (DNA Points)
- Price zones that previously created huge directional moves (20–30% swings, or areas where momentum exploded).
- These levels act like genetic markers of the market—price tends to react strongly when revisiting them. Treat levels as zones with ranges, not exact lines.
Aggressive vs. Passive Players
- On the tape and depth, look for passive orders (big walls of liquidity that absorb flow).
- Watch how aggressive orders (market buys/sells) interact with them.
- A valid setup occurs when aggression overwhelms absorption at a major level.
Catalyst Confirmation
- The best setups occur when news or earnings push participants into the market.
- Example: Tesla earnings beat → aggressive buyers step in → absorption at a key level → explosive move.
Tight Risk Windows
- Enter as close as possible to where aggression confirms (right when buyers/sellers flip control).
- Place stops just beyond the liquidity zone that defines the DNA level. This reduces risk dramatically and sets up asymmetric reward-to-risk.
Entry Rules
Longs:
- Aggressive buyers absorb sell orders at a significant support/DNA zone.
- Tape confirms repeated buyer aggression (market buys hitting into offers).
- Passive sellers fail to hold their liquidity wall.
Shorts:
- Aggressive sellers absorb buy orders at the resistance/DNA zone.
- The tape shows sellers hitting bids over and over.
- Buyers at the level get absorbed, and sellers continue pressing.
Exit Rules
- Scale partials into the first strong reaction or intraday pivot.
- Hold the remainder until aggression flips on the tape (e.g., buyers suddenly dominate in a short position).
- Trail stops behind newly formed aggressive zones.
Risk Management
- Must achieve 3:1 R: R minimum; most setups naturally provide 4–5:1+.
- Never let a trade run past the DNA zone once invalidated.
- Risk is reduced not by aiming for huge profits, but by minimizing stop distance.
Market Selection Rules
- Focus on high-volume stocks during catalysts (e.g., NVDA on AI earnings, ARM on IPO momentum, ORCL on news).
- Futures trades are valid during macro-driven sessions (FOMC, CPI, NFP).
- No trades in flat/range-bound sessions where aggression is unclear.
Pros and Cons of the Strategy
This Strategy is designed to deliver high-quality, repeatable setups — but like any trading strategy, there are key things to understand before using it.
Note: The cons listed here aren’t disadvantages. They are things to be aware of — important characteristics that require patience, discipline, and proper management to make the strategy work effectively.
Pros
- Direct Cause & Effect: You’re trading based on what actually moves price (buyers/sellers), not lagging indicators.
- Extremely Tight Risk: Entries are made right where aggression flips, giving stops only a few ticks away.
- Scalable Across Assets: Works on both stocks and futures (options can be used for leverage).
- High Conviction Trades: When news + DNA level + aggression align, the odds are stacked heavily in your favor.
- Objective Edge: No need to rely on pattern recognition or subjective indicators.
Cons
- Screen Time Required: You need to actively watch the tape and the order book. It’s not a set-and-forget strategy.
- Learning Curve: Reading Level II and tape flow takes practice and can overwhelm beginners.
- Liquidity Dependency: Works best in highly liquid names; smaller caps/options chains may cause slippage.
- Emotionally Demanding: Requires discipline to wait for aggression confirmation and not jump in early.
- Weaker in Low-Vol Environments: If there’s no catalyst or aggression, the edge is much lower.
Trade Breakdown
Nvidia posted strong earnings with bullish AI guidance. Volume surged, putting the stock at the center of market attention. A prior demand zone, where aggressive buyers had previously driven a major rally, became the key DNA level.

Setup
- DNA Zone: A well-defined demand area with proven buyer aggression.
- Catalyst: Earnings plus heavy relative volume confirmed NVDA was in play.
- Tape: Buyers repeatedly lifted offers; passive sellers were absorbed and failed to hold.
Execution
Entry: As buyers established control at the DNA zone.
Stop: Placed just below the zone.

Target: Momentum continuation, with partials scaled at intraday reaction points.
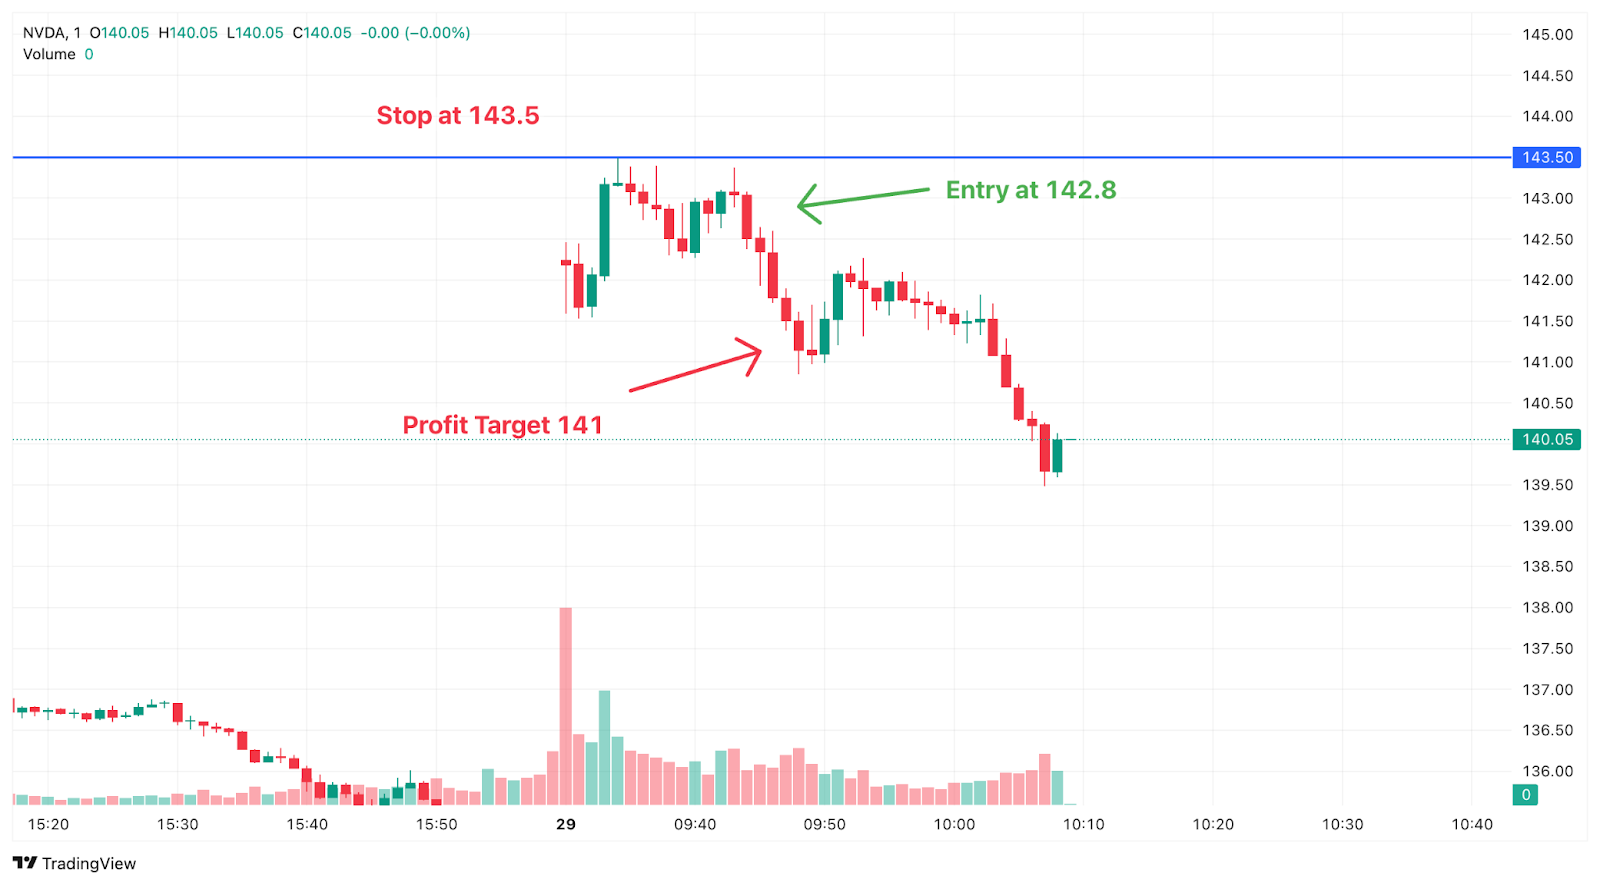
Outcome
NVDA broke sharply higher. The stop was never tested, and the trade delivered a strong reward-to-risk profile due to precise entry near the DNA zone.
How to Backtest This Market DNA Strategy
The fastest way to test this Market DNA strategy is with TradeZella's automated no-code backtesting. Define your rules in plain English, hit run, and TradeZella runs them across 11+ years of historical data in seconds, then shows you every individual trade along with your win rate, profit factor, and expectancy instantly, without you stepping through a single chart. It is the quickest way to see whether the setup holds up before you risk a dollar.
You can also test it manually by replaying the market bar by bar. Load 11+ years of historical data, set up your chart the way you trade live, and replay sessions bar by bar. Mark your DNA zones, the price areas that previously produced large directional moves, then replay price as it returns to those levels during a catalyst like earnings or news. Watch how price reacts at the zone for signs that aggression overwhelms absorption, enter as close as possible to where control flips, and place your stop just beyond the liquidity zone that defines the DNA level. Use automatic position sizing and drag your stop and target directly on the chart, aiming for the 3:1 reward-to-risk minimum the model requires. Every backtested trade gets logged automatically with your entry, exit, position size, and P&L. Add notes on the DNA level and catalyst, tag mistakes, and review the session the same way you would a live trading day. After 30 to 50 trades, you can see your win rate, profit factor, and expectancy on this specific setup. Manual replay is the best way to build screen time and a real feel for the setup.
When you start trading live, import your live trades into TradeZella, the AI trading journal that does the journaling for you. Your backtest results and live results live in the same platform, so you always know how the strategy performs in testing vs how it performs with real money, without switching between tools or maintaining separate spreadsheets.
Start Backtesting This Strategy Using TradeZella
Frequently Asked Questions
What is the Market DNA strategy?
The Market DNA strategy is a day trading model built on the idea that only buyers and sellers move price, not indicators, Fibonacci levels, or chart patterns. Instead of guessing with indicators, you read the tape, market depth (Level II), and liquidity zones to see who is in control in real time. The goal is to find where aggressive participants step in at key levels, enter with tight risk, and catch high-probability moves driven by real supply and demand.
What is a DNA level?
A DNA level, or DNA point, is a price zone that previously created a huge directional move, such as a 20% to 30% swing or an area where momentum exploded. These levels act like genetic markers of the market, because price tends to react strongly when it revisits them. You treat them as zones with a range rather than exact lines, and they become the locations where you watch for aggression to confirm a trade.
What is the difference between aggressive and passive players?
Passive players post big walls of resting liquidity that absorb incoming flow, while aggressive players send market orders that hit into those walls. On the tape and depth you watch how aggressive orders interact with passive ones. A valid setup occurs when aggression overwhelms absorption at a major DNA level, for example aggressive buyers repeatedly lifting offers until passive sellers fail to hold their wall, which signals control is flipping.
Why does this strategy avoid Forex?
The method depends on accurate order flow, which requires a centralized market. Stocks, stock options, and futures all provide real volume and depth, so the tape and Level II data can be trusted. Forex is decentralized and does not provide true volume or depth, which the strategy describes as getting lied to, so it is avoided because the order flow signals this model relies on would not be reliable.
What instruments and conditions work best?
Focus on large-cap, high-volume stocks with strong catalysts like earnings, news, or sector shifts, with options available for leverage, and futures such as NQ and ES during macro-driven sessions like FOMC, CPI, or NFP. The strategy needs liquidity and a catalyst to produce clear aggression, so it avoids flat, range-bound sessions where control is unclear. Every setup targets at least a 3:1 reward-to-risk, and most naturally provide 4:1 to 5:1 or more because of the tight entry near the DNA zone.
Can I backtest the Market DNA strategy?
Yes. You can test this strategy using TradeZella's backtesting with 11+ years of historical data. Mark your DNA zones, replay price back into those levels during a catalyst, watch for the reaction that shows aggression overwhelming absorption, and enter with your stop just beyond the zone. Every trade logs automatically with entry, exit, position size, and P&L. Add notes on the DNA level and catalyst, tag mistakes, and review the session the same way you would a live trading day. After 30 to 50 trades you can see your win rate, profit factor, and expectancy on this specific setup before risking real money.
What is TradeZella backtesting?
TradeZella backtesting lets you test a trading strategy against 11+ years of historical market data across forex, futures, stocks, and crypto, down to seconds-level timeframes. You can do it two ways. Replay the market bar by bar and place trades as if you were trading live, with your own timeframes, automatic position sizing, and stops and targets you drag right on the chart, and every trade logs automatically with entry, exit, size, and P&L. Or use automated no-code backtesting: define your strategy rules in plain English and the engine runs them across years of data in seconds, returning every individual trade it took with the exact setup drawn on the chart, so you see why each trade fired instead of just an equity curve. Zella AI then analyzes the results and flags what to fix.