Trading Journal Software That Reveals Your Trading Edge
.avif)


Import Automatically

Analyze Everything

Build Consistency
Most Traders Journal Wrong.
Or Don't Journal At All.


.avif)


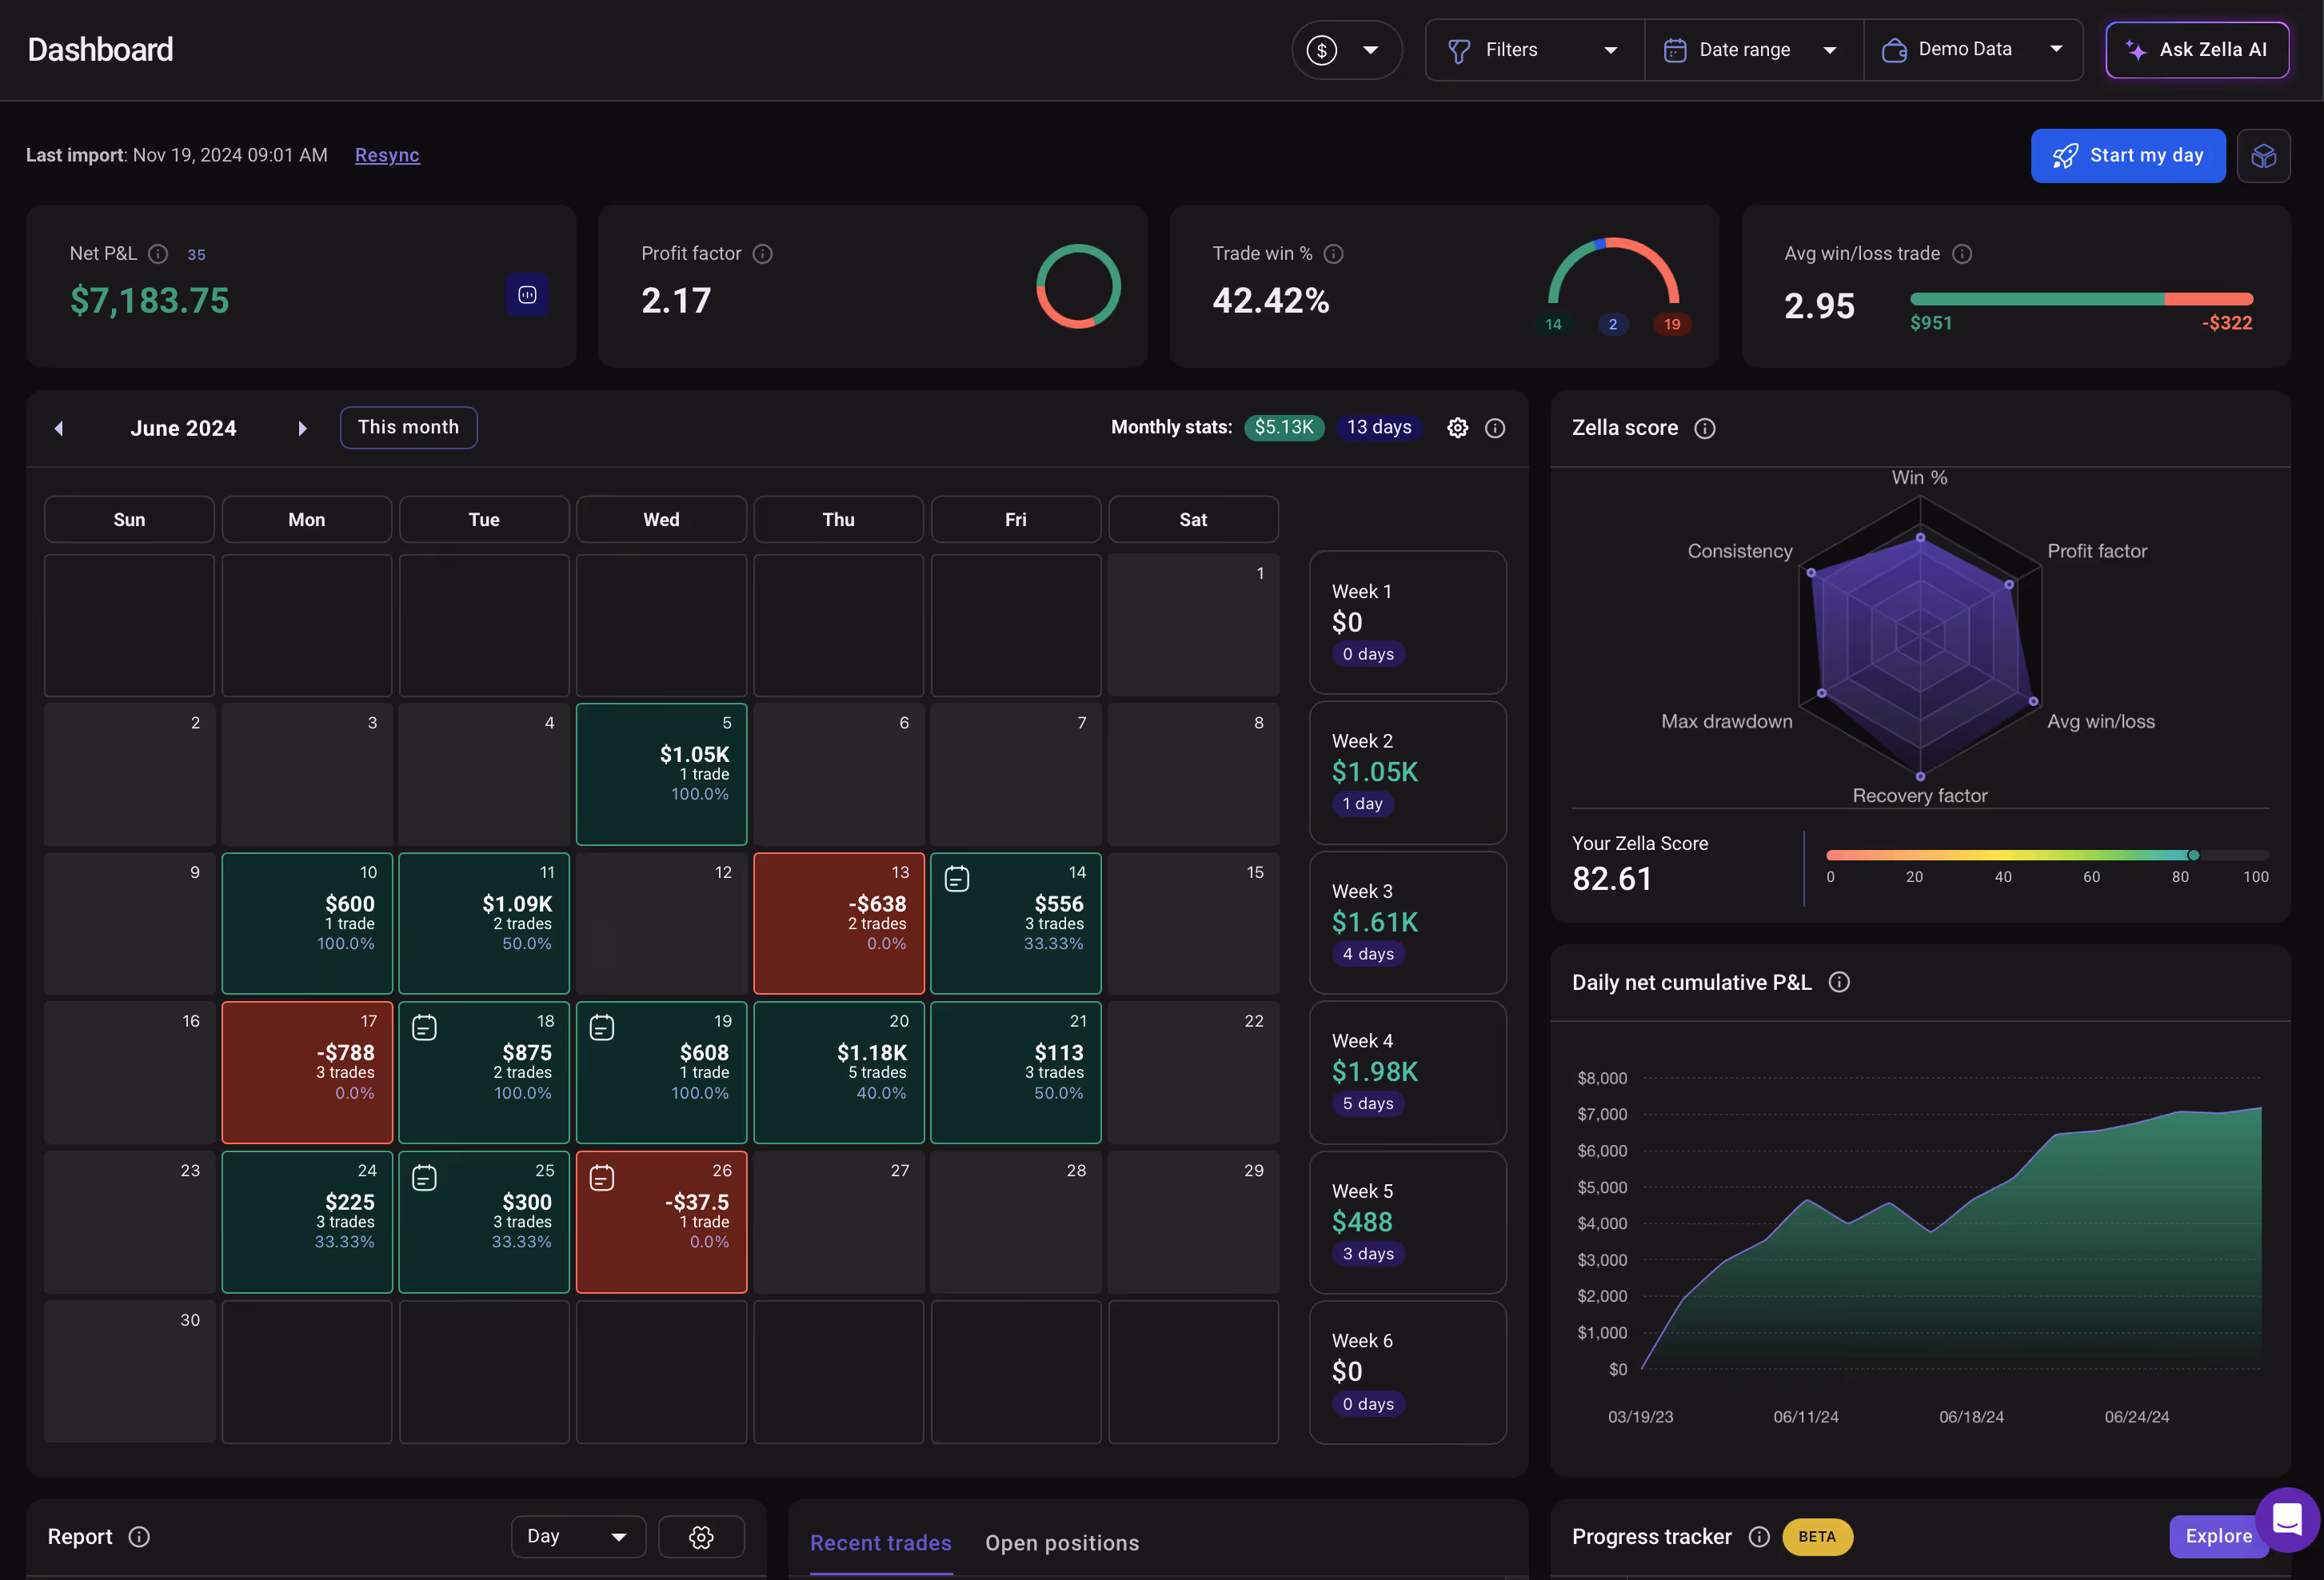
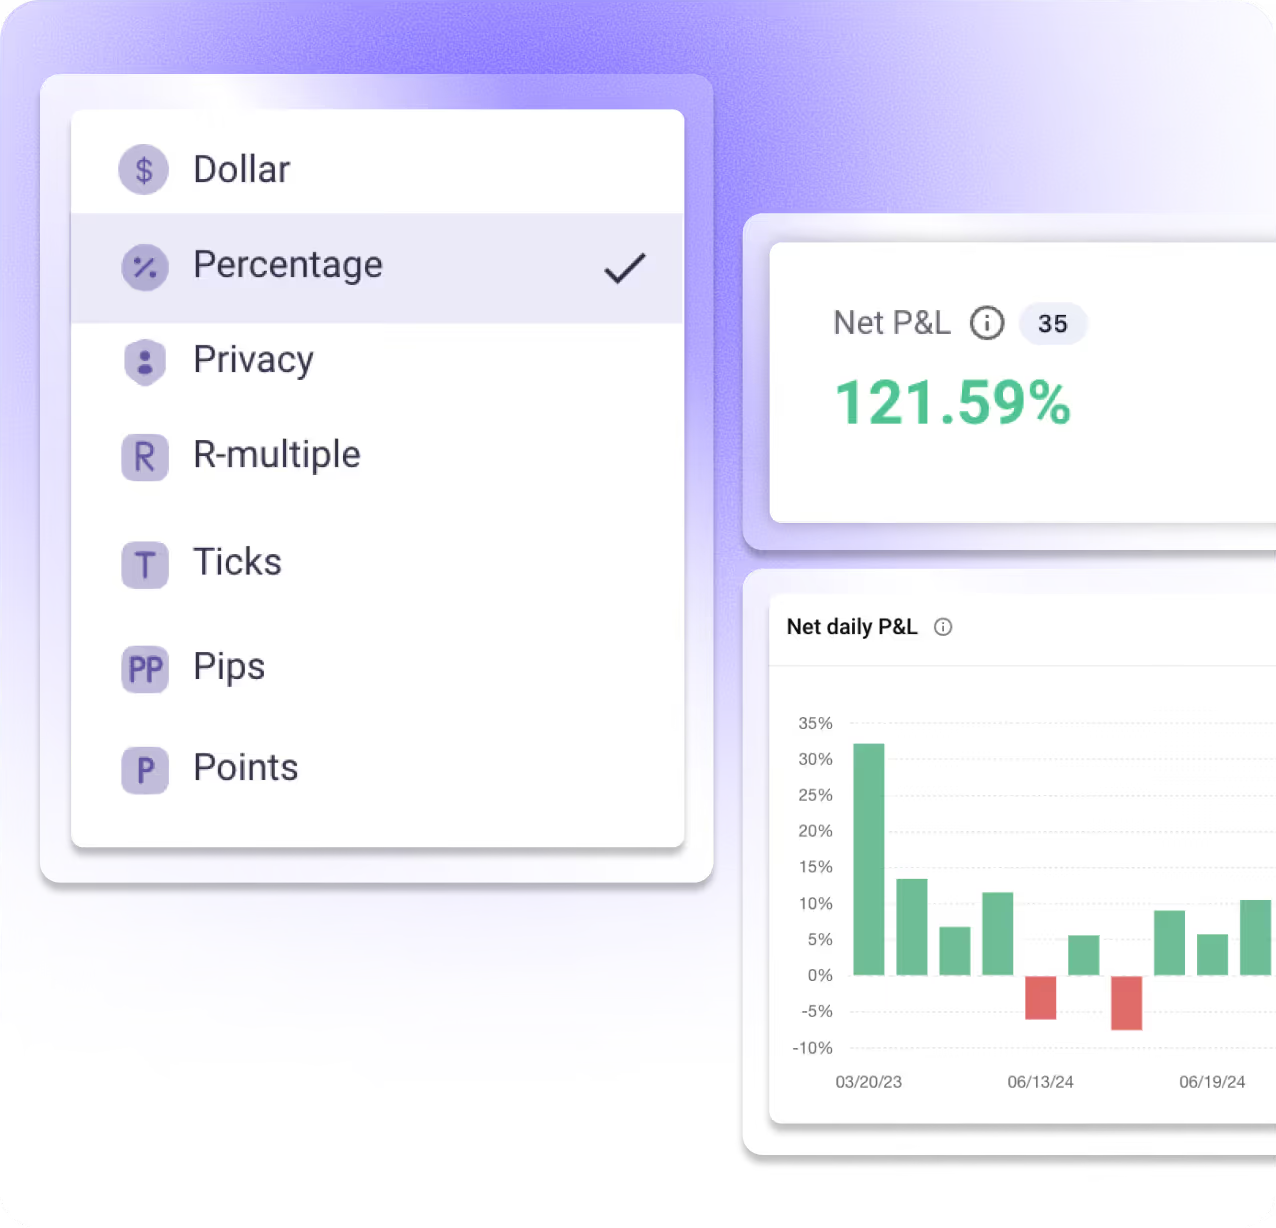
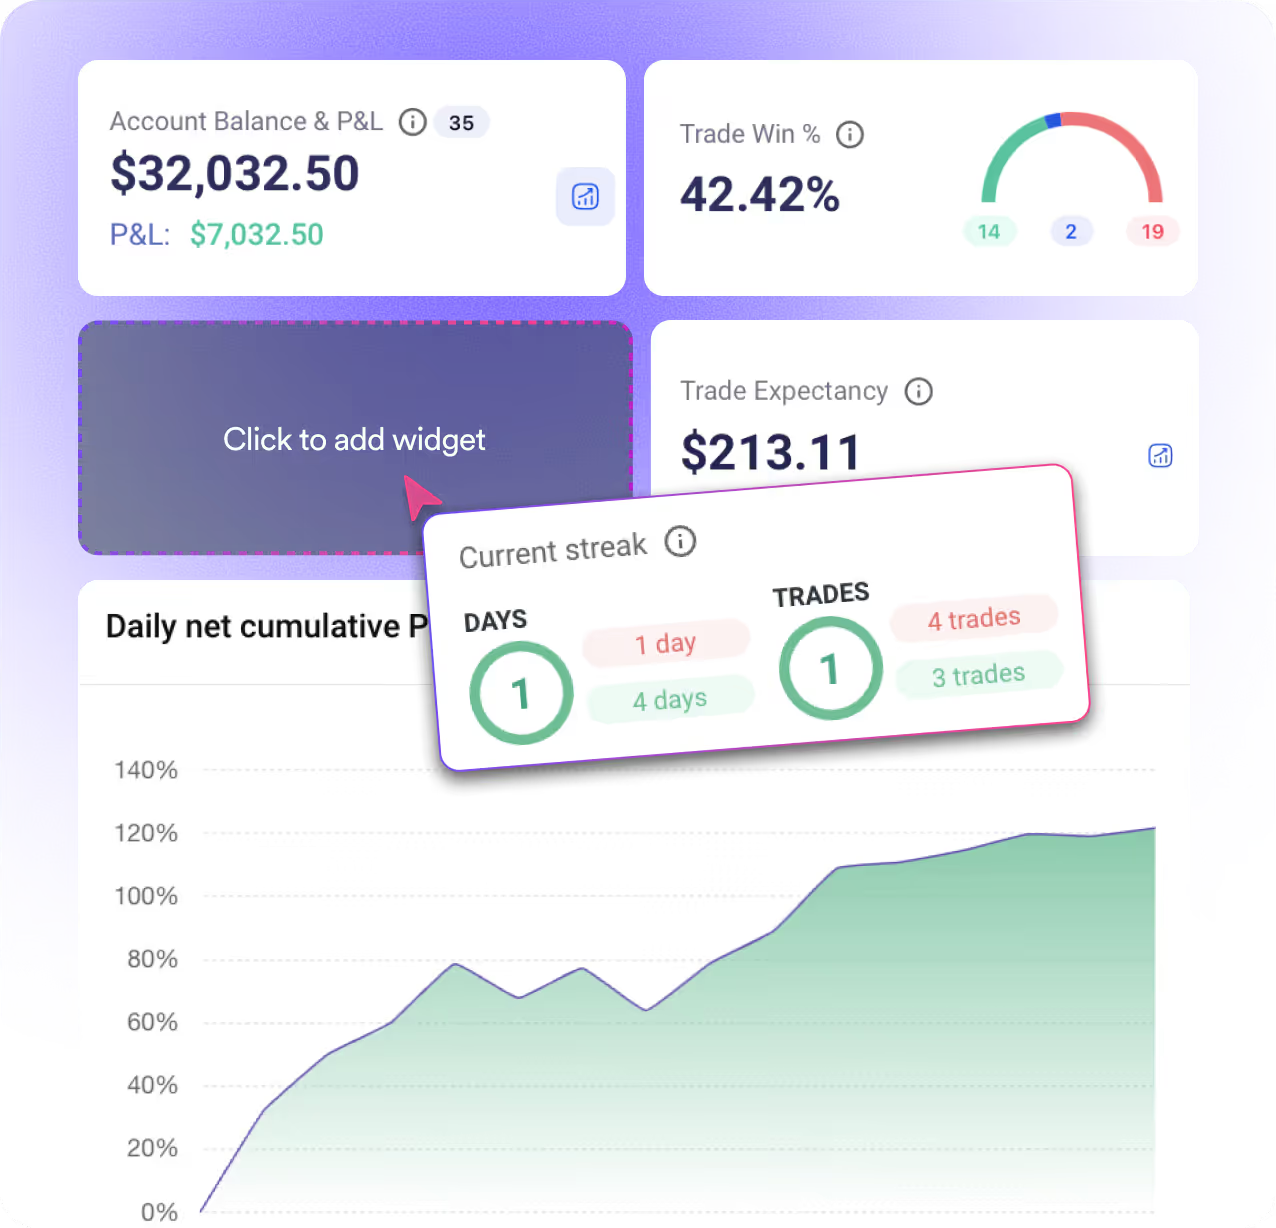
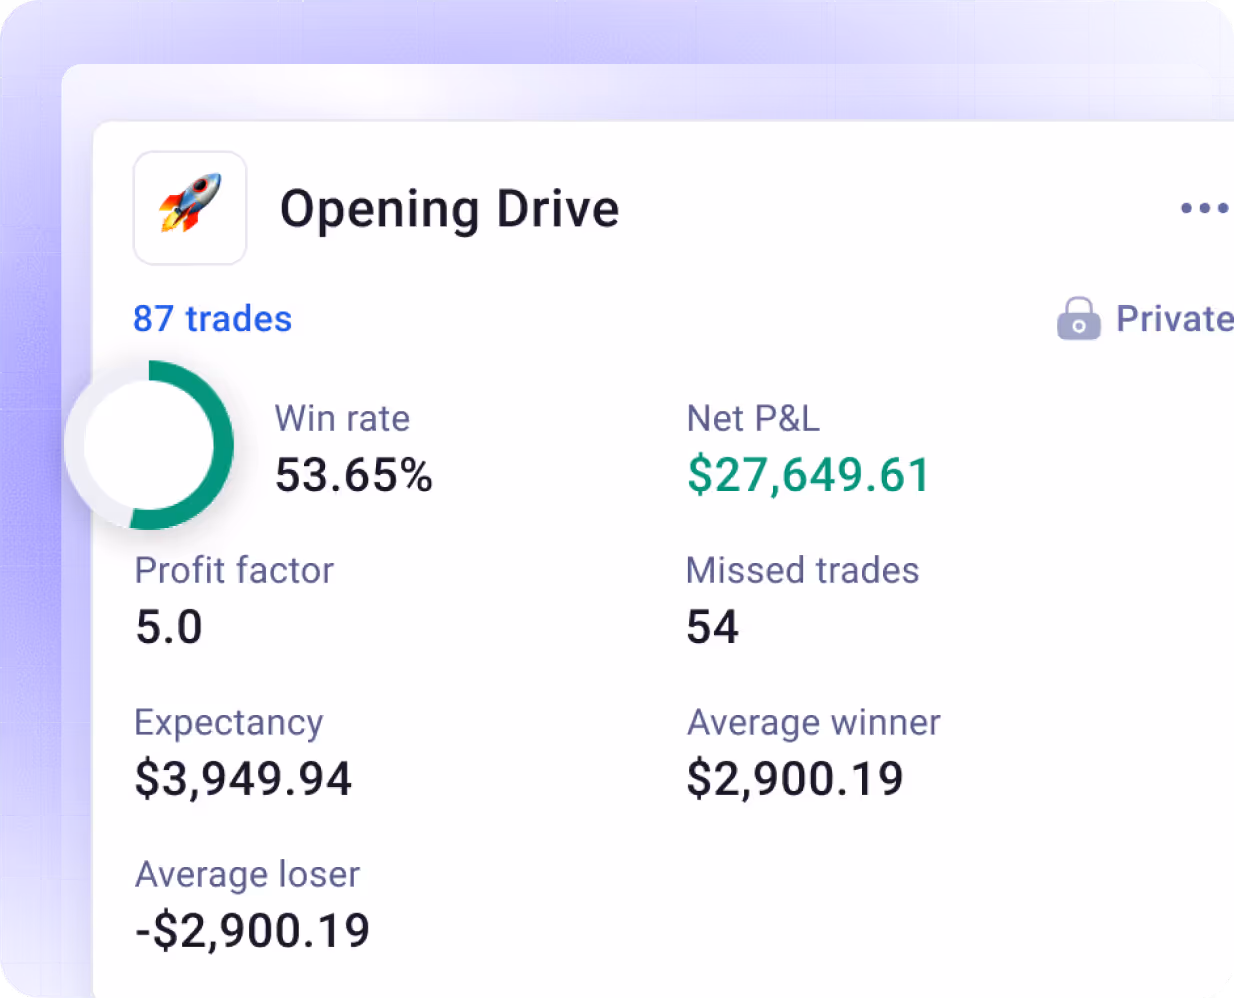
One Dashboard. Every Metric That Matters.
Get a real-time snapshot of your P&L, win rate, and key trading metrics the moment you log in. Customize your dashboard view to focus on what matters most to your trading style.
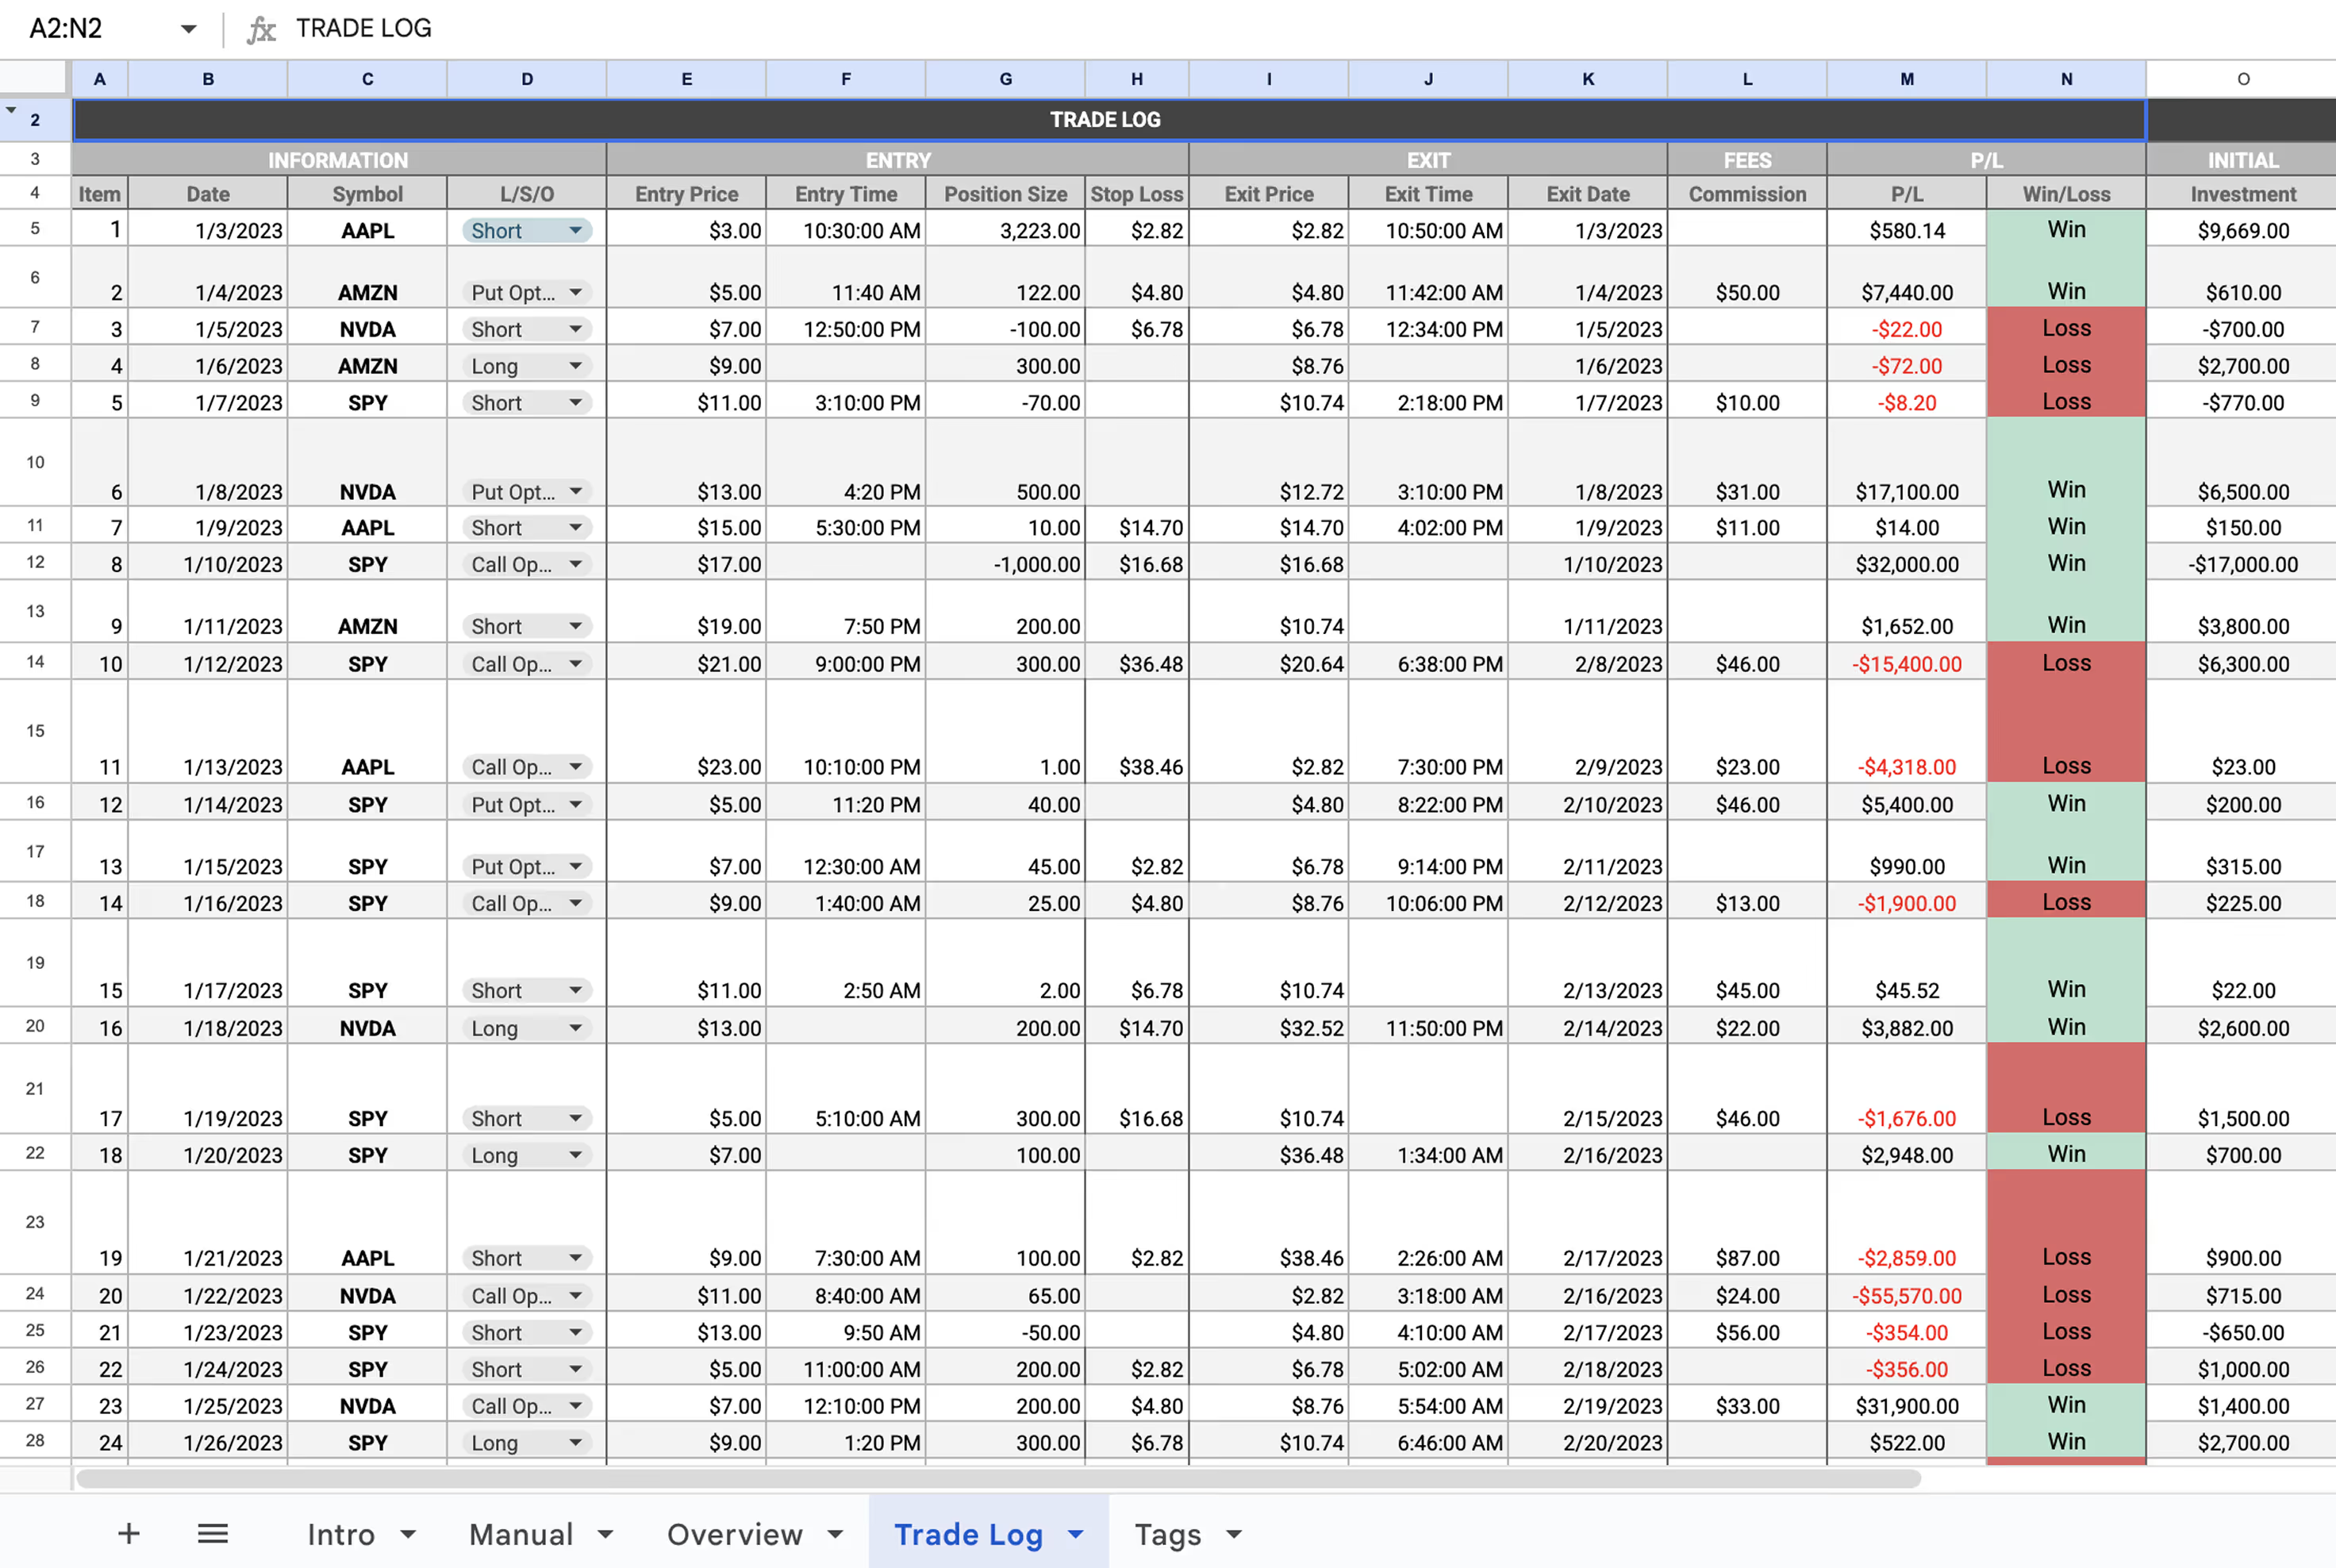
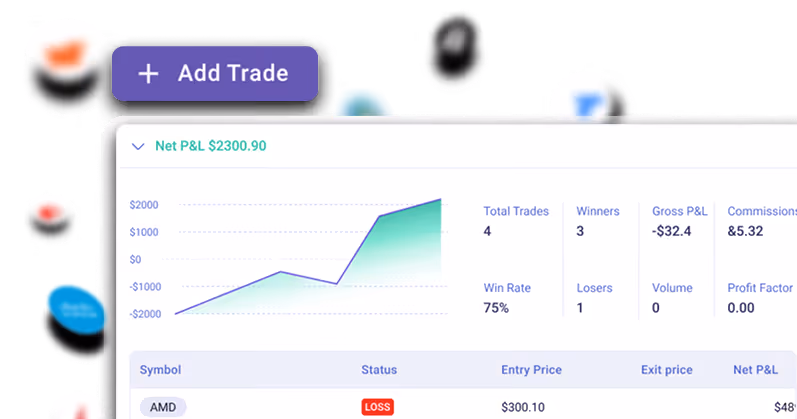
Auto-Sync Your Trades. Review Every Detail.
Your broker connects directly to TradeZella—every trade imports automatically with full execution data. No manual entry. Just open your journal and start reviewing.
Auto-Sync From Brokers
TradingView Charts Integration
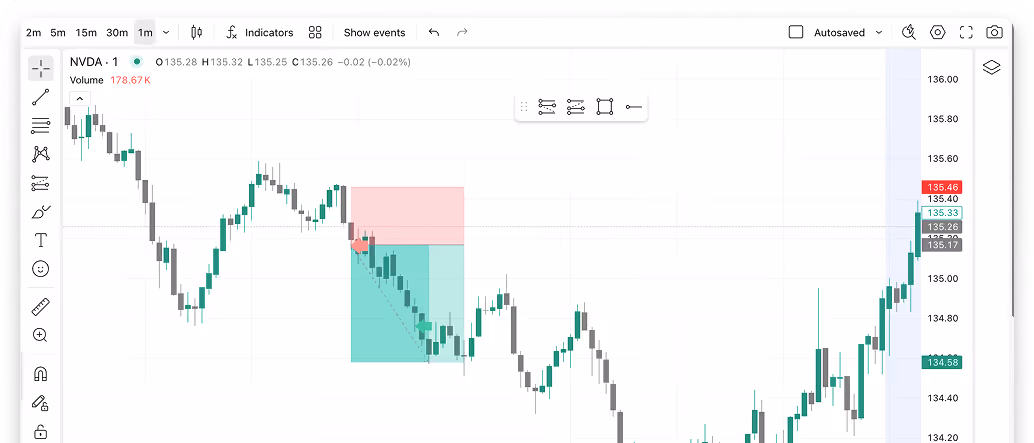
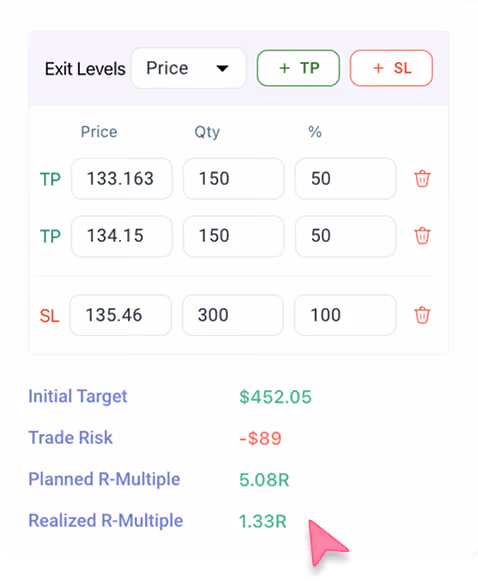
Multiple TP/SL & Auto Risk-Reward Tracking
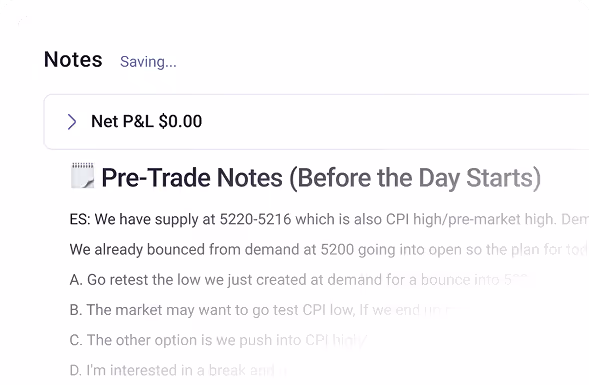
Trade Notes
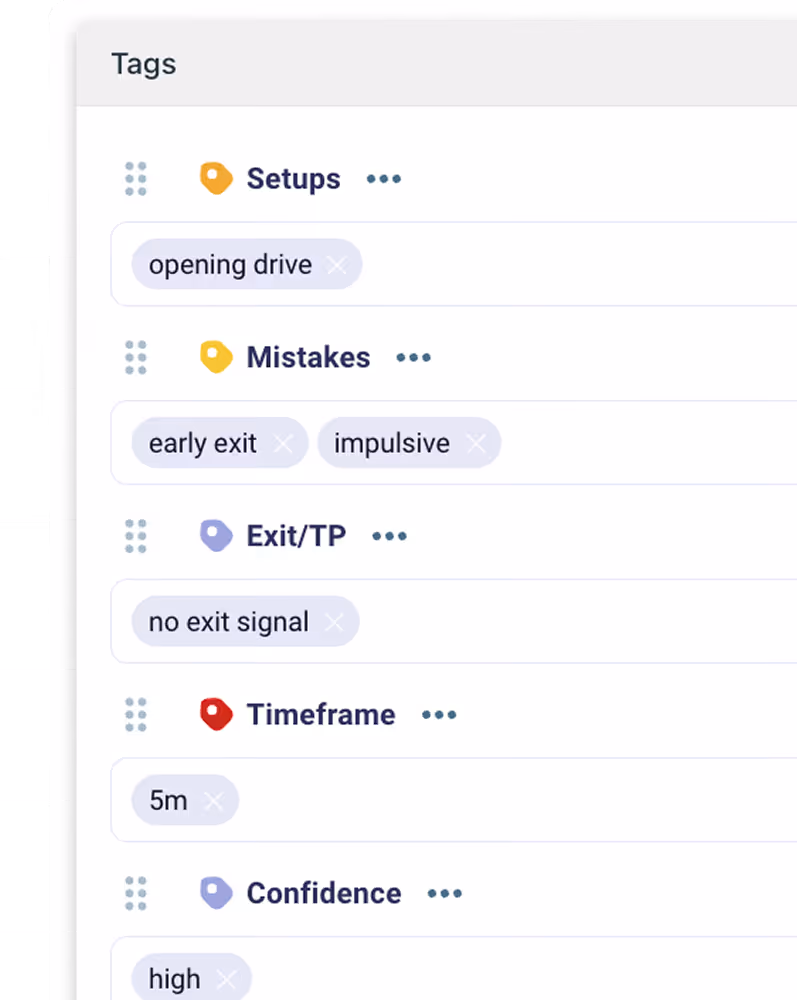
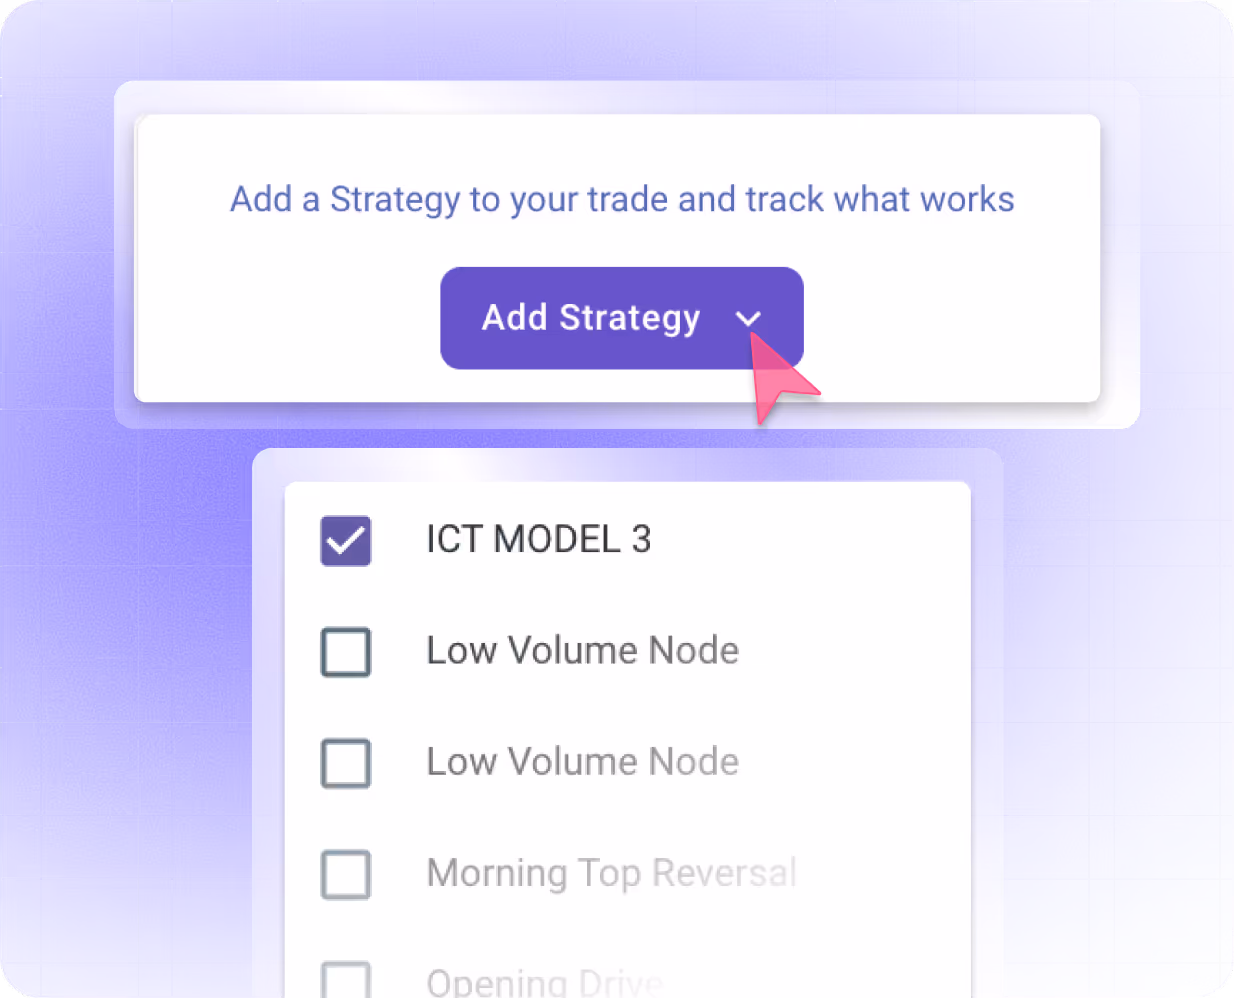
Strategy Tagging
Custom Tagging System
Running P&L
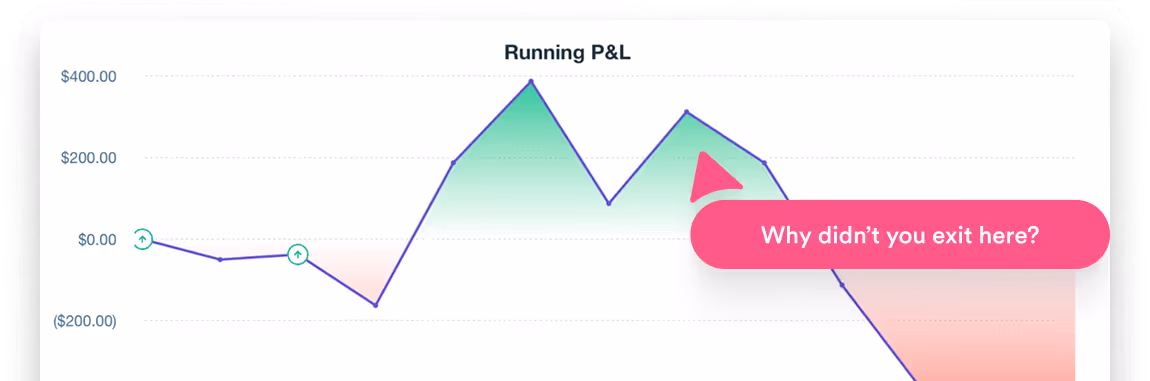
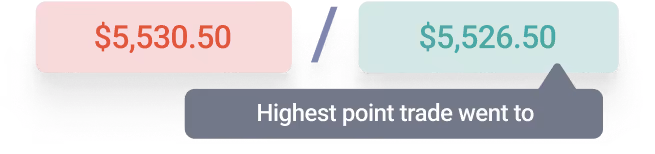
MAE/MFE Analysis
Discover Exactly Where You're Winning or Losing

Best Performing Tags
Worst Performing Tags

Most Used Tags
Highest Win Rate Tags
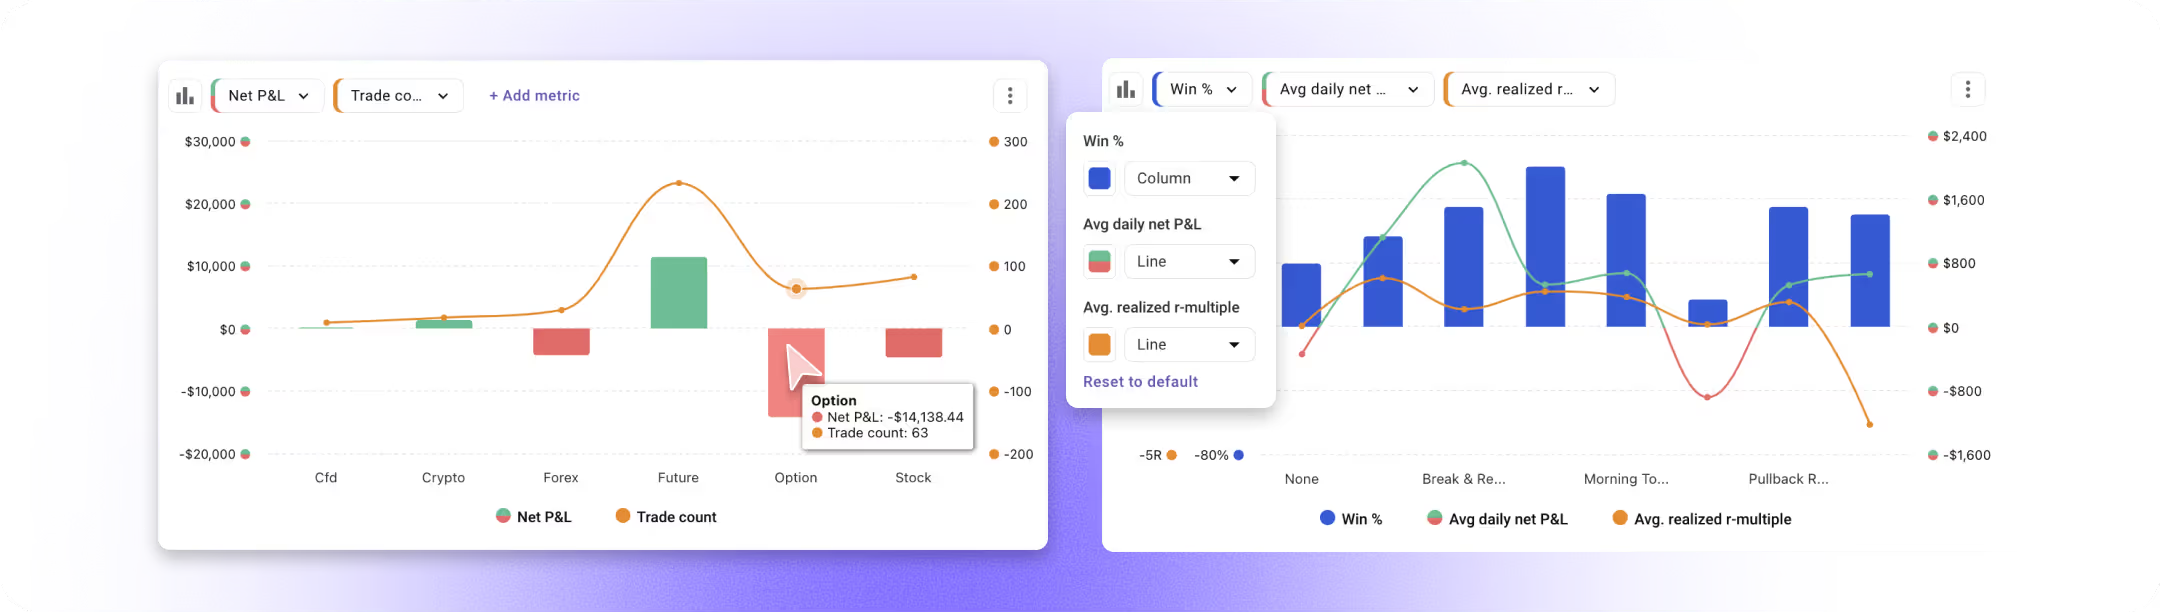

Plot Multiple Metrics at Once
.svg)
Analyze Any Dimension
Flexible Visualization

.svg)
Break Down Any Tag Further
.svg)
Uncover Hidden Patterns
Actionable Insights
.svg)
TradeZella enables me to compile and analyze my trading data in a way that would take far too long if I did it manually. It has changed the way I think about strategizing on future trades... which tickers, playbooks, timeframe, days of the week, and times of day have I experienced more success? TradeZella can answer these questions in the form of reports.

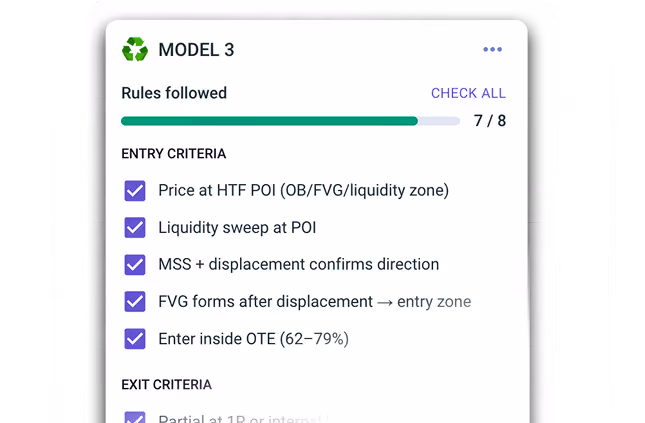
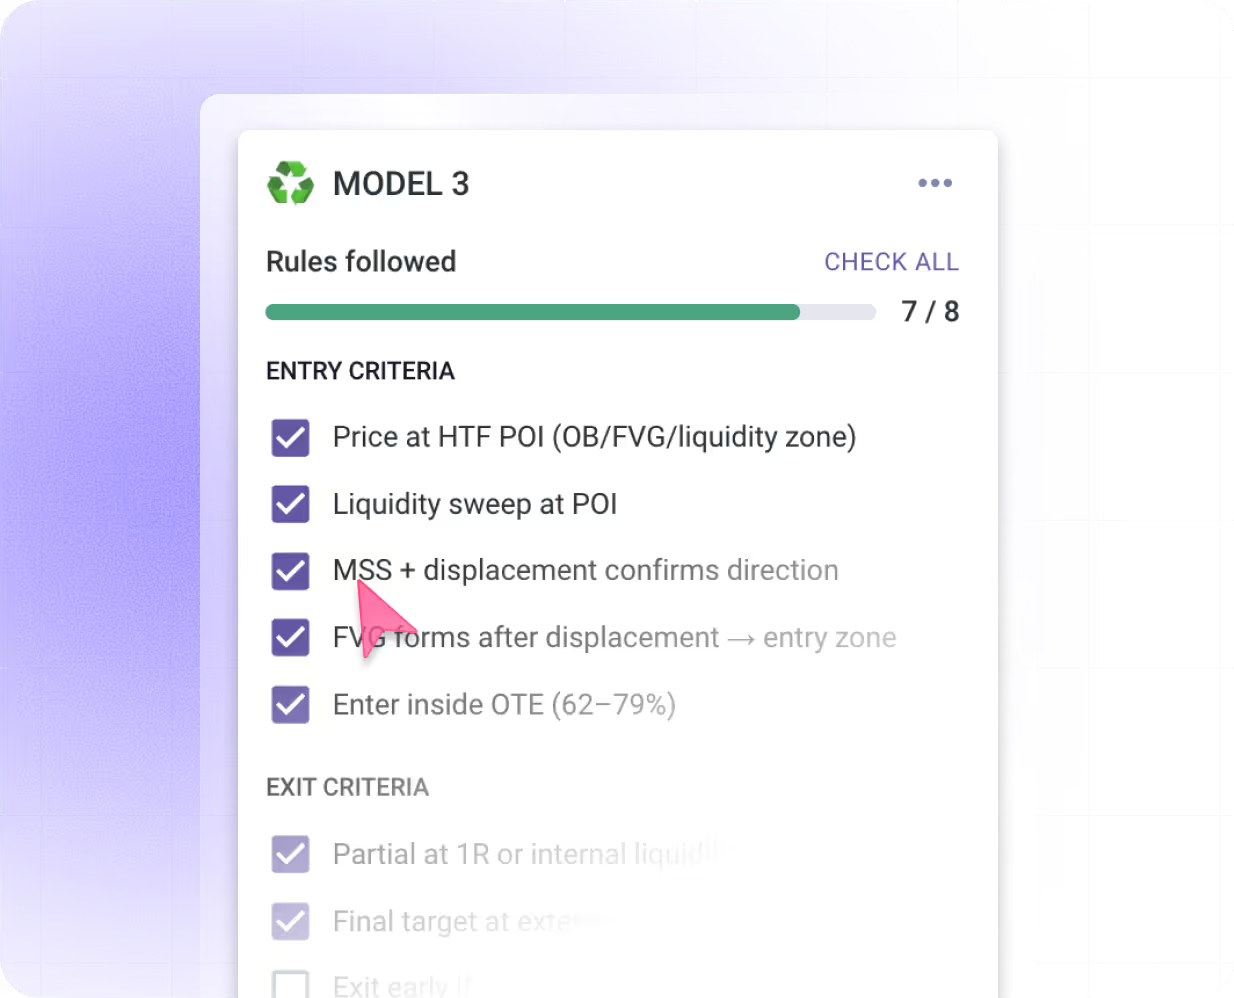
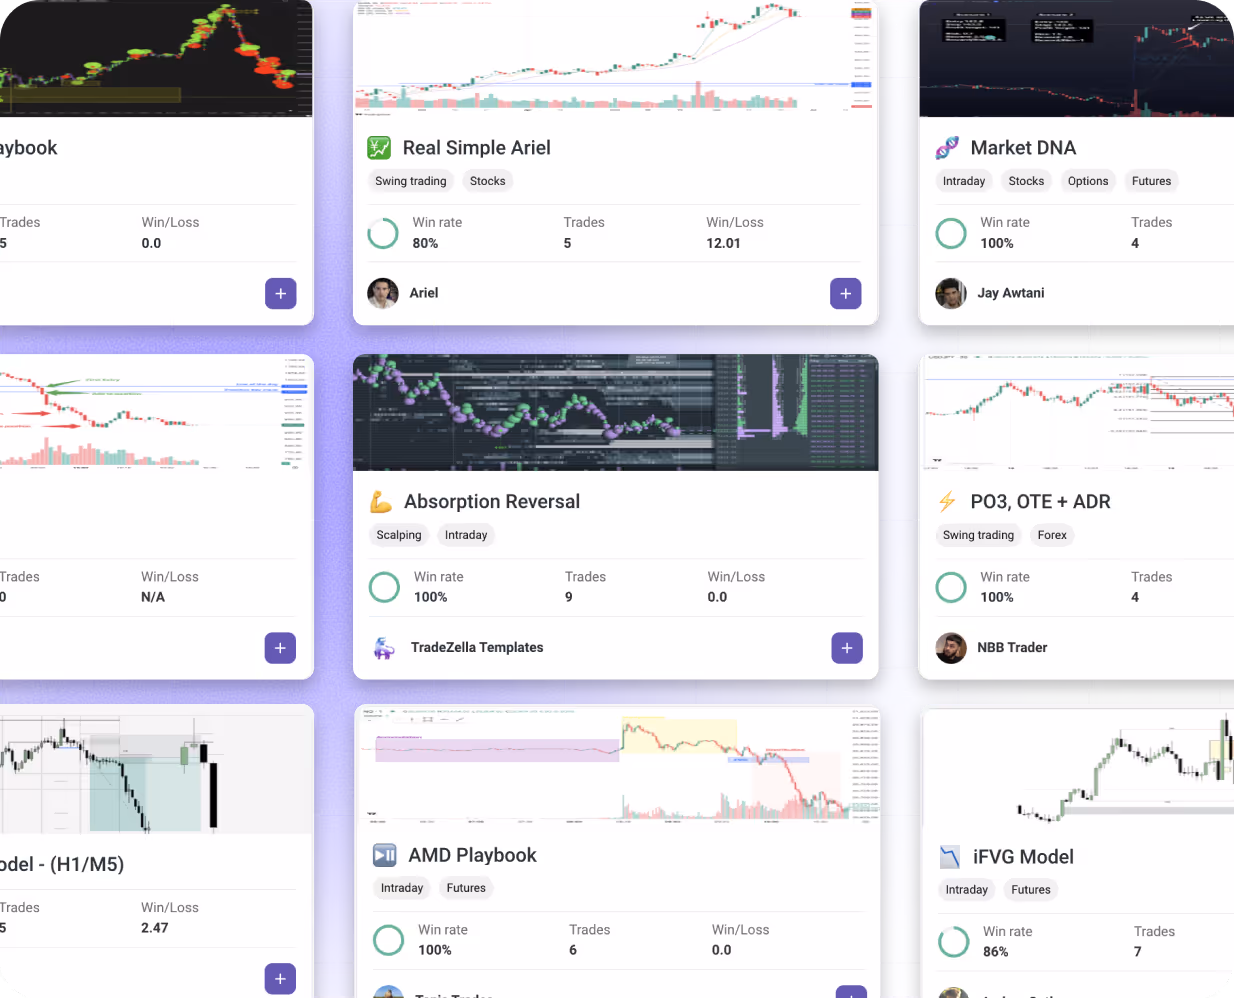
Build Strategies. Measure Results. Find Your Edge.
Create custom strategies with rules and checklists, then measure how each performs over time.
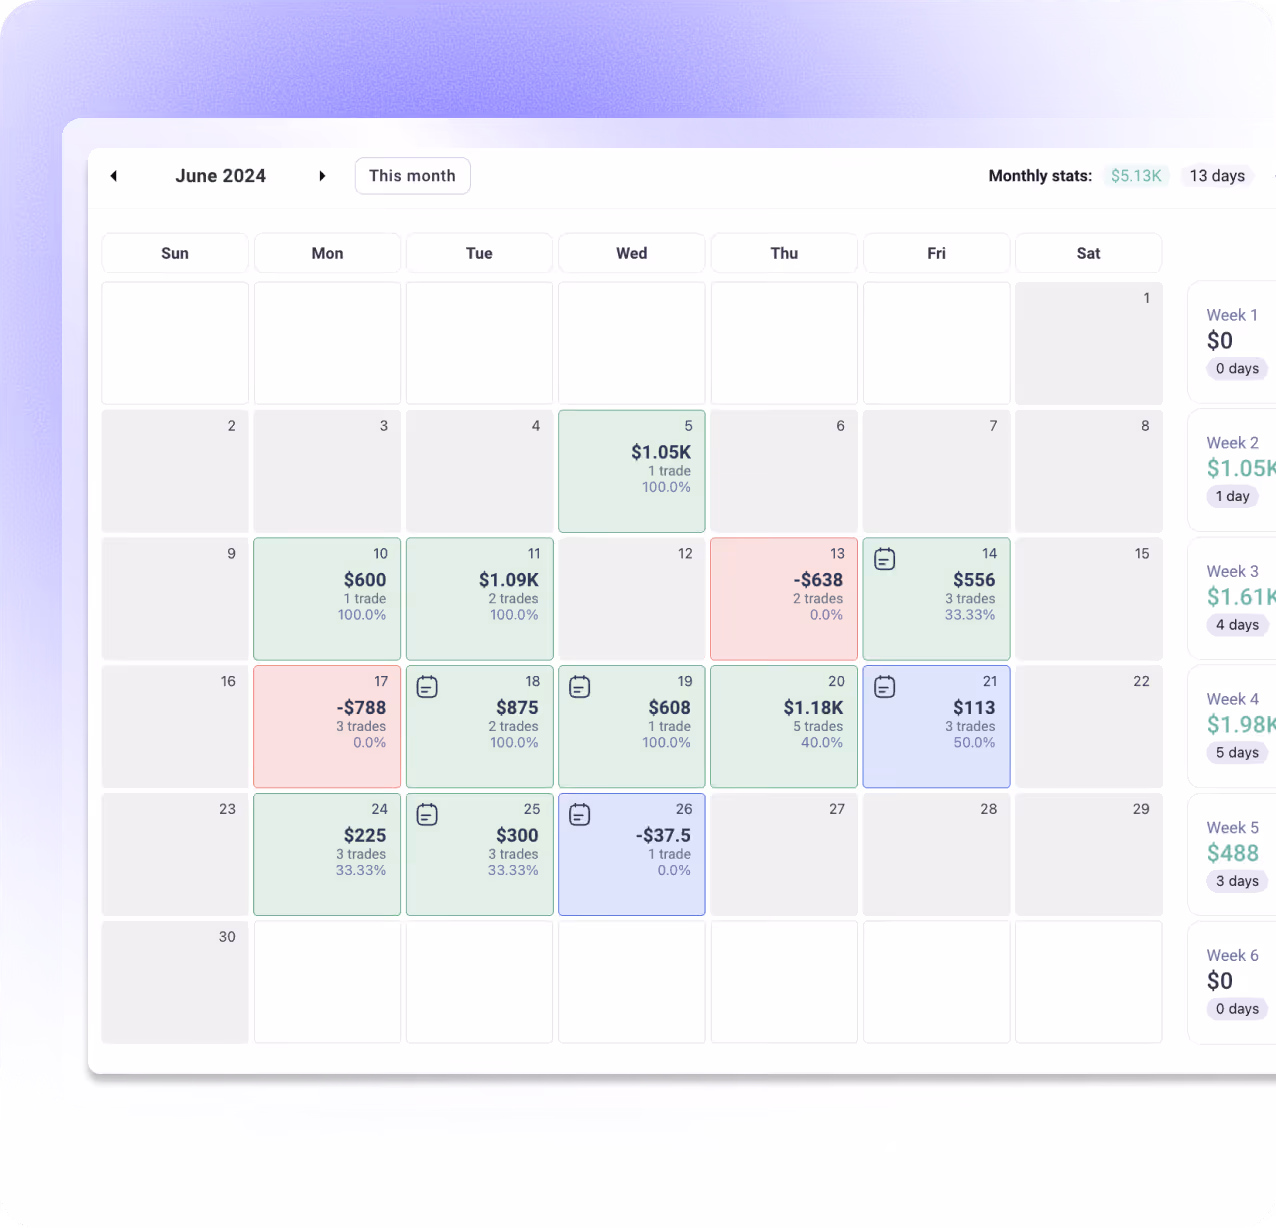
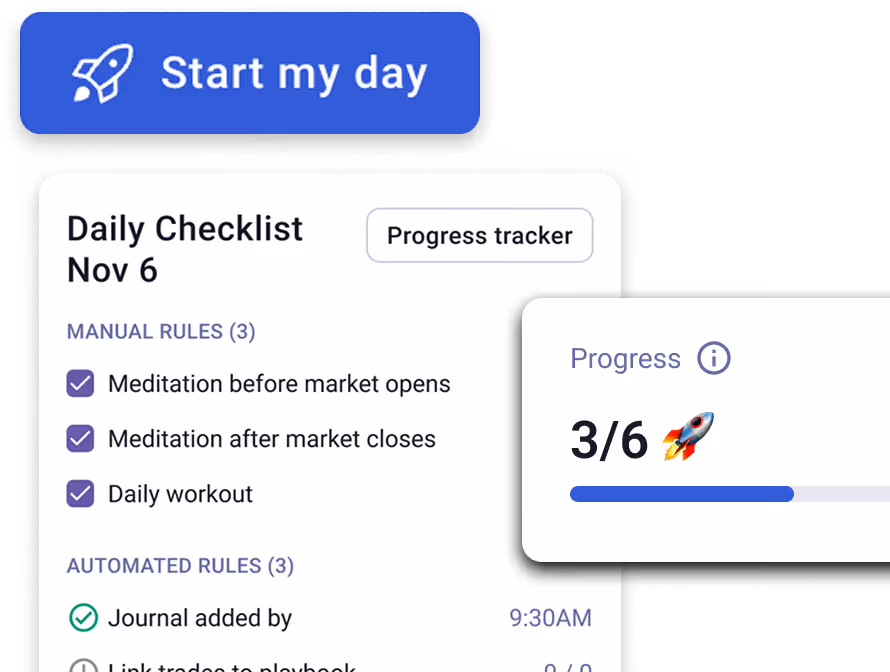
Prepare With Intention.
Track Your Growth.
Start every trading session with a structured routine, then measure how that consistency compounds over time with built-in progress tracking.
Daily Trading Checklist
Pre-Market Prep Templates
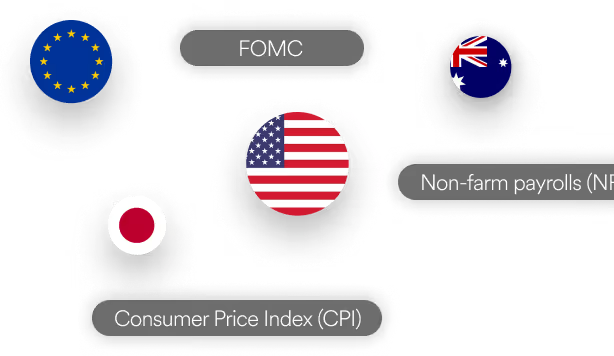
Economic Calendar
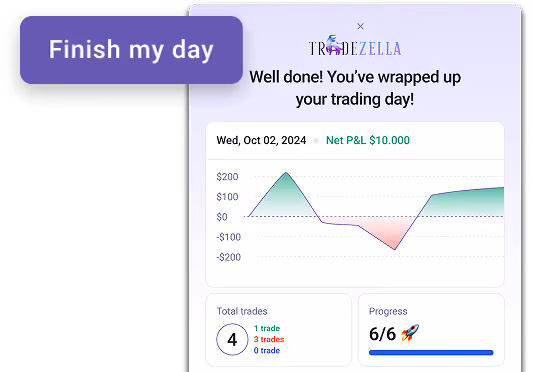
End-of-Day Summary
Consistency Heatmap

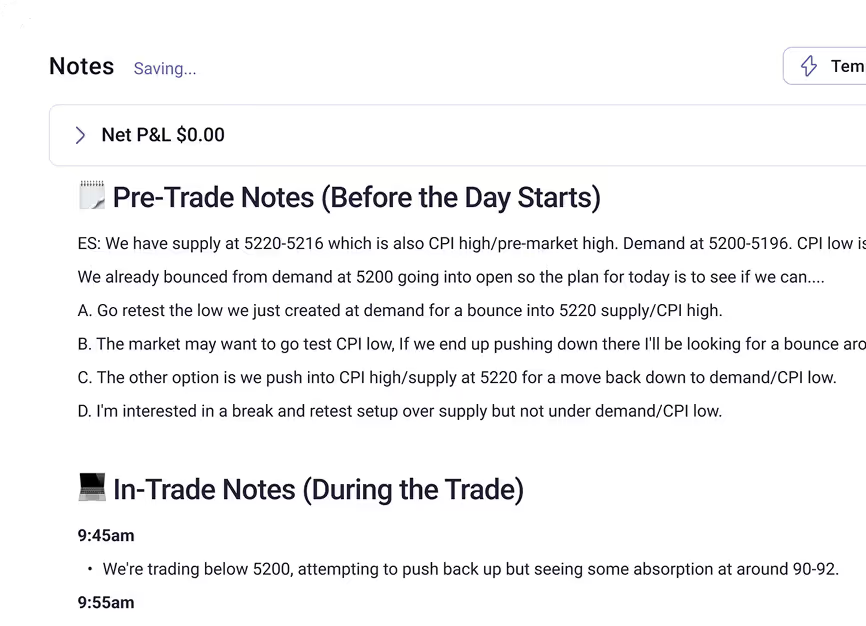
Journal Your Thoughts. Refine Your Process.
Document observations, lessons learned, and market notes in one place, with templates to keep your trading reflections structured and actionable.
.avif)
.avif)
.avif)
.avif)
Everything You Need to Journal & Track Like a Pro
From automatic commission tracking to instant trade replay, these advanced features help you capture every detail and analyze every angle.

Save Chart Settings
Save Chart Settings

Breakeven Settings
Breakeven Settings

Screenshots & Attachments
Screenshots & Attachments

Trade Rating System
Trade Rating System

Share Trades & Journal Entries
Share Trades & Journal Entries

Seamless Trade Replay
Seamless Trade Replay

Default Commission & Fees
Default Commission & Fees

Auto-Close Expired Options
Auto-Close Expired Options
Got questions?

TradeZella automatically imports trades from your connected broker and analyzes performance across dozens of metrics. It includes a customizable dashboard, trade log, daily journal, notebook, and detailed reports.
We support a wide range of brokers and trading platforms, including MetaTrader 4 & 5, NinjaTrader, Charles Schwab (ThinkorSwim), Interactive Brokers, Bybit, cTrader, DXtrade, TradeLocker, Tradovate, Robinhood, and many more. You can connect your account via auto-sync, file upload, or manual trade entry depending on your broker. For a full list of all supported brokers and integrations, visit our Supported Brokers page.
Yes. If we support the broker or platform your prop firm uses (like Tradovate, Rithmic, DXtrade, or TradeLocker), you can sync and journal your prop firm trades just like any other account.
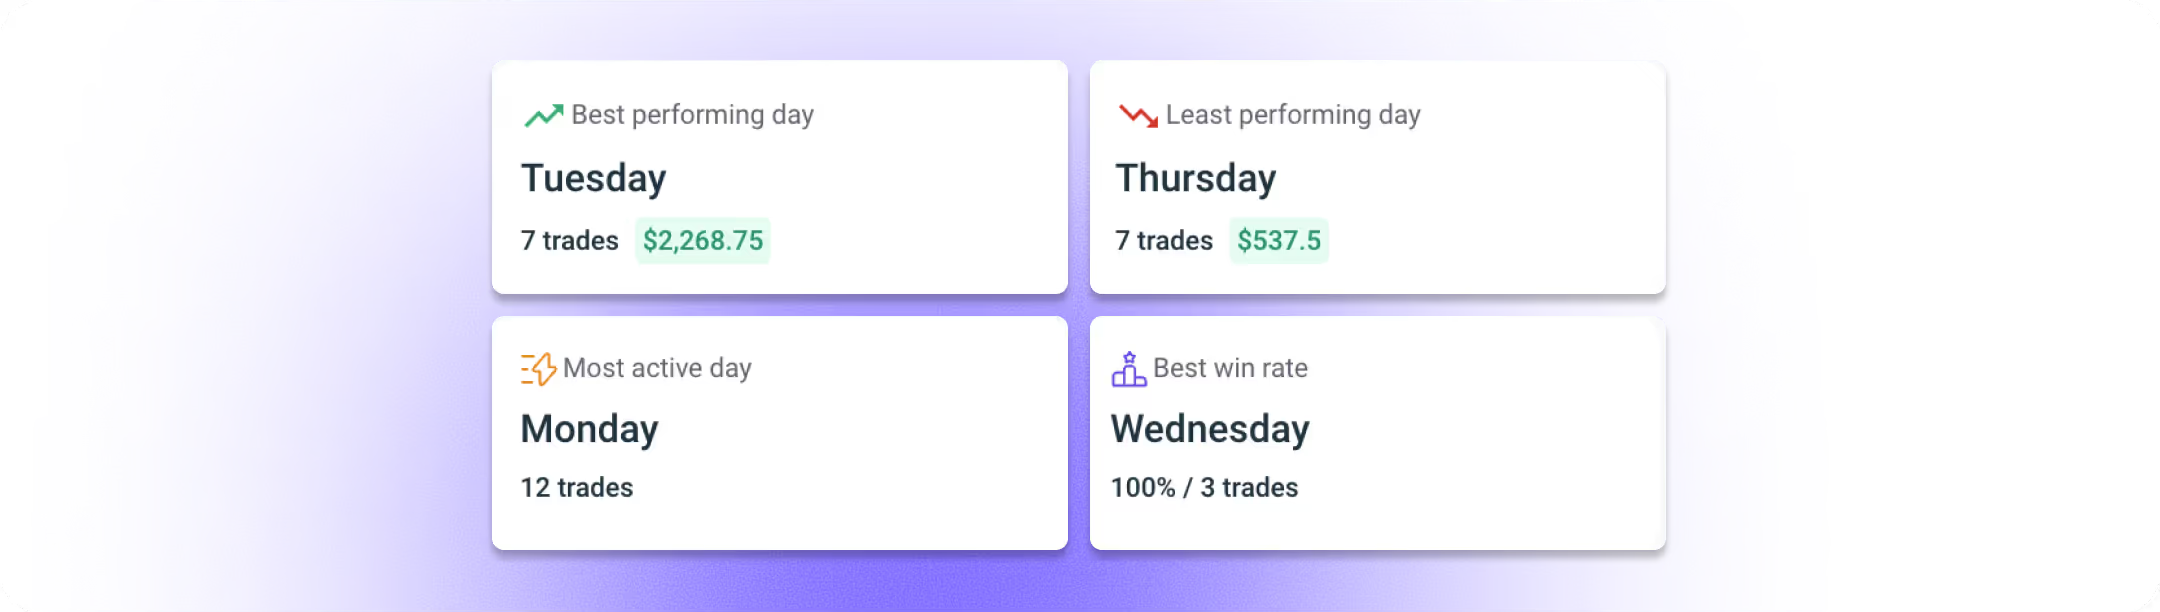
Reports cover P&L, win rate, profit factor, day/time analysis, symbol breakdown, win vs. loss comparisons, risk metrics, drawdown tracking, and performance by strategy or custom tags.
Yes. Add notes to individual trades or full sessions, create custom tags for setups/emotions/mistakes, and attach screenshots. Everything feeds into your reports for filtered analysis.
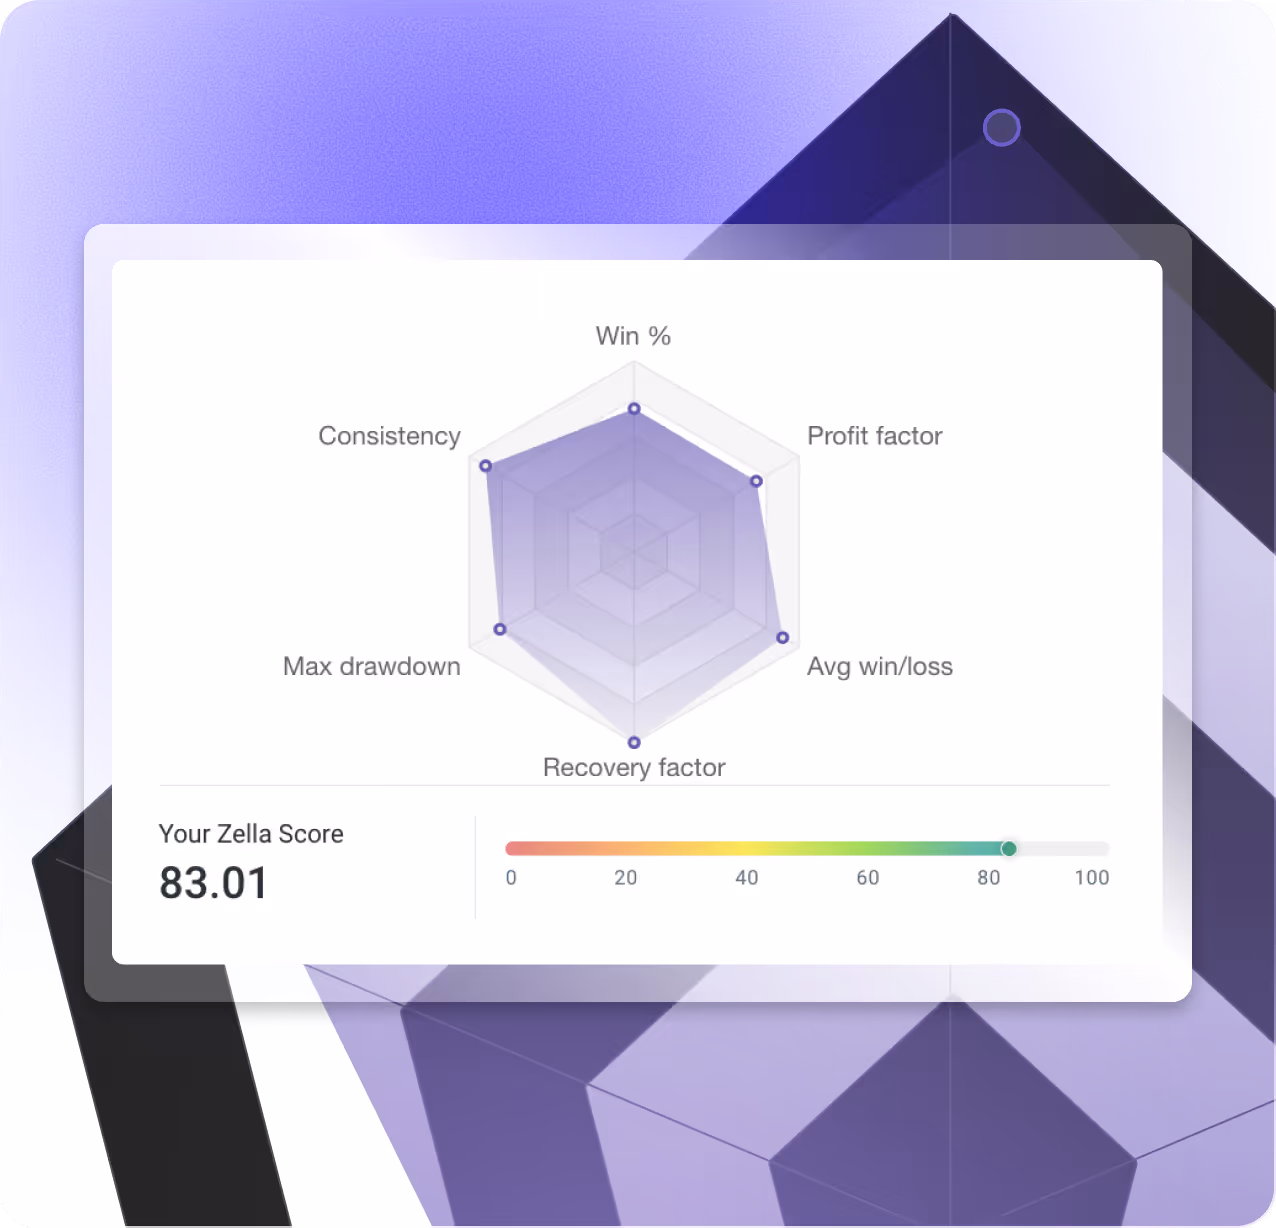
The Zella Score is a 0–100 metric measuring your overall trading performance—factoring in profitability, risk management, consistency, and discipline beyond just P&L.
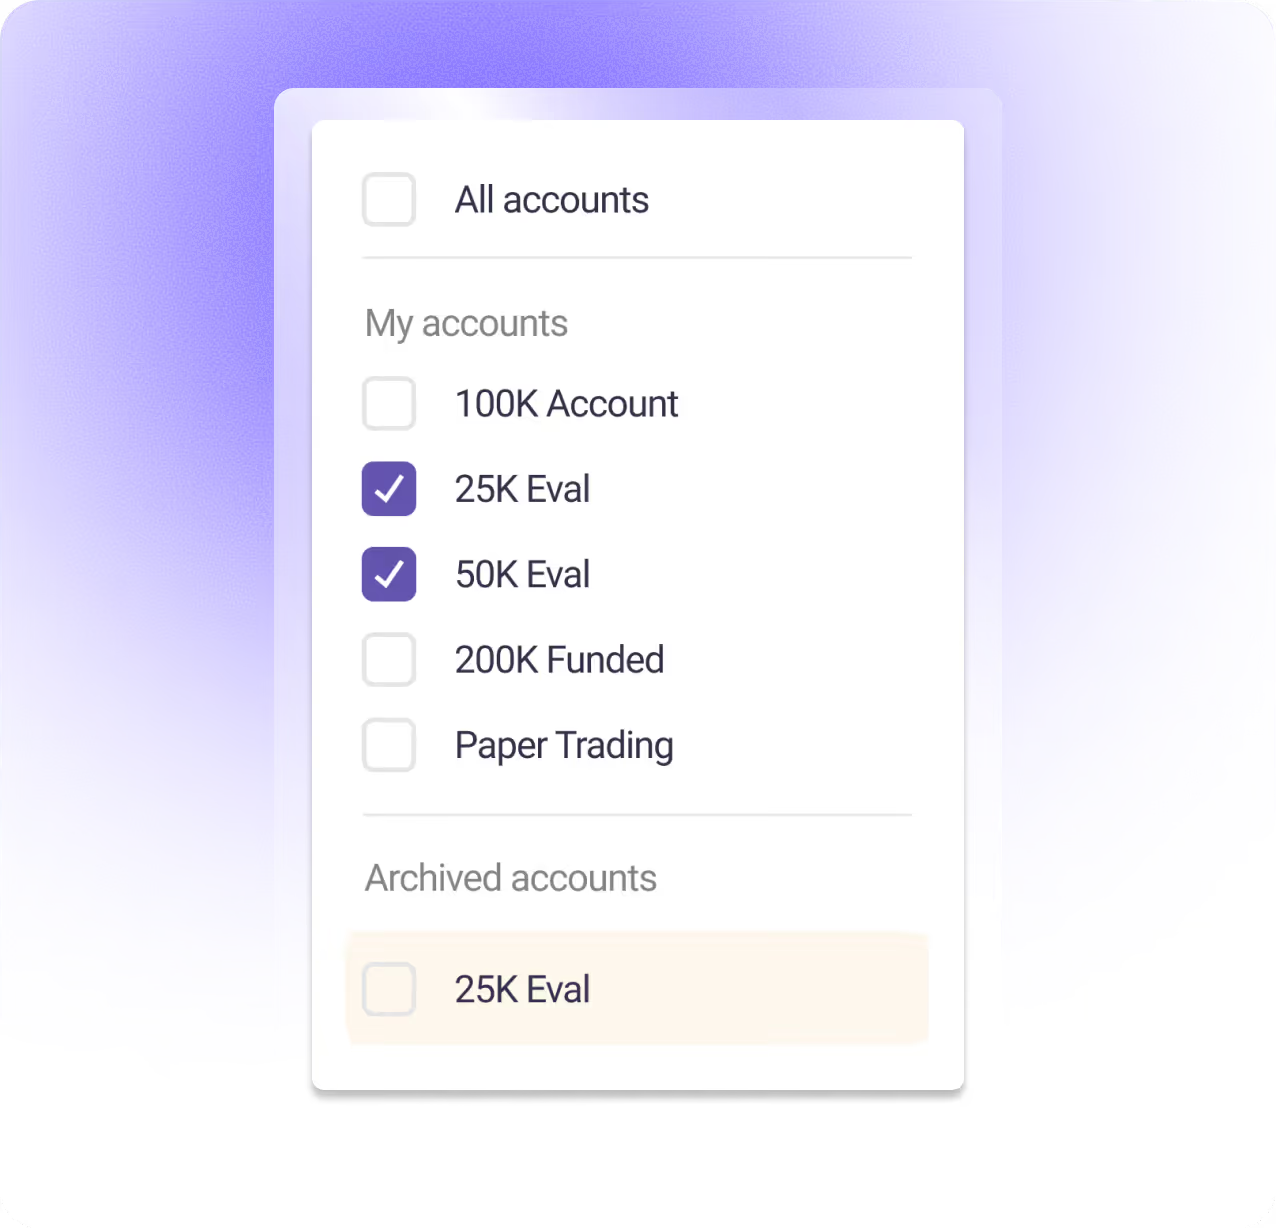
Yes. Track multiple accounts across all asset classes in one place, with dedicated options analytics and the ability to filter reports by account or market.
Ready to become a profitable trader?
