


Built For
Instruments: Stocks
Trading Style: Day Trading
Strategy Overview
This strategy focuses on short-selling euphoric small-cap runners during the exhaustion phase of a multi-day move.
The core edge comes from identifying “mini bubbles” — short-term parabolic advances fueled by momentum, retail participation, and emotional buying — and entering when that upward pressure begins to fail.
Unlike long breakout trading (low win rate, high R:R), this strategy prioritizes:
- Higher win rate
- Defined structural invalidation
- Psychological inflection points
- Controlled scaling by setup quality
Primary Setup: First Red Day (FRD)
Secondary Setup: Parabolic Short (Intraday Compression of FRD)
Core Philosophy
The best signal that a stock is ready to go down is when it can no longer continue going up.
The strategy is built around:
- Euphoria exhaustion
- Psychological shift from green to red
- Trapped late buyers
- Momentum failure after acceleration
Small caps produce these bubbles weekly — unlike macro bubbles that occur once every decade.
Strategy Setups
Setup 1: First Red Day Strategy (Primary Setup)
The First Red Day is not simply “a red candle.” It is the first meaningful breakdown after a clean, extended, multi-day euphoric run. The move must qualify as a bubble.
Minimum Criteria (Non-Negotiable)
Before considering the trade, all of the following must be present:
- Minimum 2–3 consecutive green days
- 80–100%+ extension from the start of the run
- Expanding daily volume
- Expanding daily range (acceleration)
If these are not met, it is not the setup.
Ideal Characteristics (Higher Grade Factors)
The best FRD setups show:
- Daily candles increasing in size as price rises
- Volume building into the top
- No red days during the run
- Parabolic curvature (acceleration phase)
- Blow-off top day with oversized range
- Large upper wick on the top day
- Clean structure without chop
Red Flags (Downgrade Factors)
- Shrinking candles into highs
- Declining volume
- Choppy multi-red-day structure
- Frequent halts
- Slow accumulation instead of an explosive run
Why Multiple Green Days Matter
More green days = more longs entering at elevated prices.
When the stock finally goes red versus the previous close:
- More traders become instantly underwater
- Fear replaces euphoria
- SSR triggers after -10%
- Selling pressure becomes real
If the run had no prior red days, the psychological shift is cleaner.
The Importance of the Previous Day’s Close
The previous day’s close is the most important level. Retail traders determine profit/loss based on green or red versus prior close — not opening price.
A stock can gap up, sell off heavily, and still appear green on the day. The true shift occurs when price breaks below the previous close. That is the psychological trigger.
Entry Methods (From Aggressive to Conservative)
Pre-Red Entry (Highest R: R, Lower Win Rate)
- Short before price breaks prior to close
- Looking for failure to make new highs
- Risk: All-time high of run
Best reward, more stop-outs.
Standard Entry (Break of Previous Close)
- Wait for the crack below prior close
- Add on failed bounces
- Risk: Today’s high of day
Most balanced approach.
Lower High Confirmation
- Wait for the breakdown
- Wait for the first bounce
- Short failed lower high
Higher win rate, worse R:R.
Exit Rules
- Cover into weakness
- Do not wait for the exact bottom
- Small caps: target minimum -10% on day
- Larger assets: 2–3%
- Use VWAP as a general magnet for parabolics
- Scale out, avoid all-or-nothing
Optional: Trail using 15-minute high.
Setup 2: Parabolic Short Strategy (Intraday Version)
An intraday bubble where the price accelerates into a clear parabola. Not a spike.
True Parabolic Characteristics
- Gradual build
- Multiple green candles
- Pullbacks shrinking
- Volume increasing into top
- Curving structure
Not a Parabolic
- One-candle news spike
- No build
- Random volume pop
- Sideways then vertical move
Entry Methods
Aggressive
- Watch the tape for velocity slowdown
- First major volume contraction
- Risk: High of the day
Safer
- Wait for a pullback
- Short first lower high
- Risk: All-time high
Target
VWAP is the primary magnet. Cover before the perfect bottom.
Maximum Attempts Rule
Hard rule: 3–5 attempts maximum. Over-attempting destroys mental and financial capital.
Setup 3: Overextended Gap Down Variation
After multiple consecutive gap-ups:
- The first gap down is significant
- Do not short if already down 10%+
- Wait for bounce to improve R:R
- Risk: Prior close
Risk Management
Primary stop level: the all-time high of the run. If the price continues making new highs, the thesis is invalid.
Tighter stops can be used after confirmation, but increase the chance of being prematurely stopped. Avoid entering new positions late in the day. Gap risk is real.
Common Mistakes
- Calling any red day FRD
- Ignoring volume
- Shorting spikes instead of parabolics
- Overtrading C setups
- Getting exhausted before A+
- Not tracking setup grade performance
- Shorting strong fundamental runners too early
- Using the opening price instead of the prior close
Trade Breakdown
BYND – A+ First Red Day
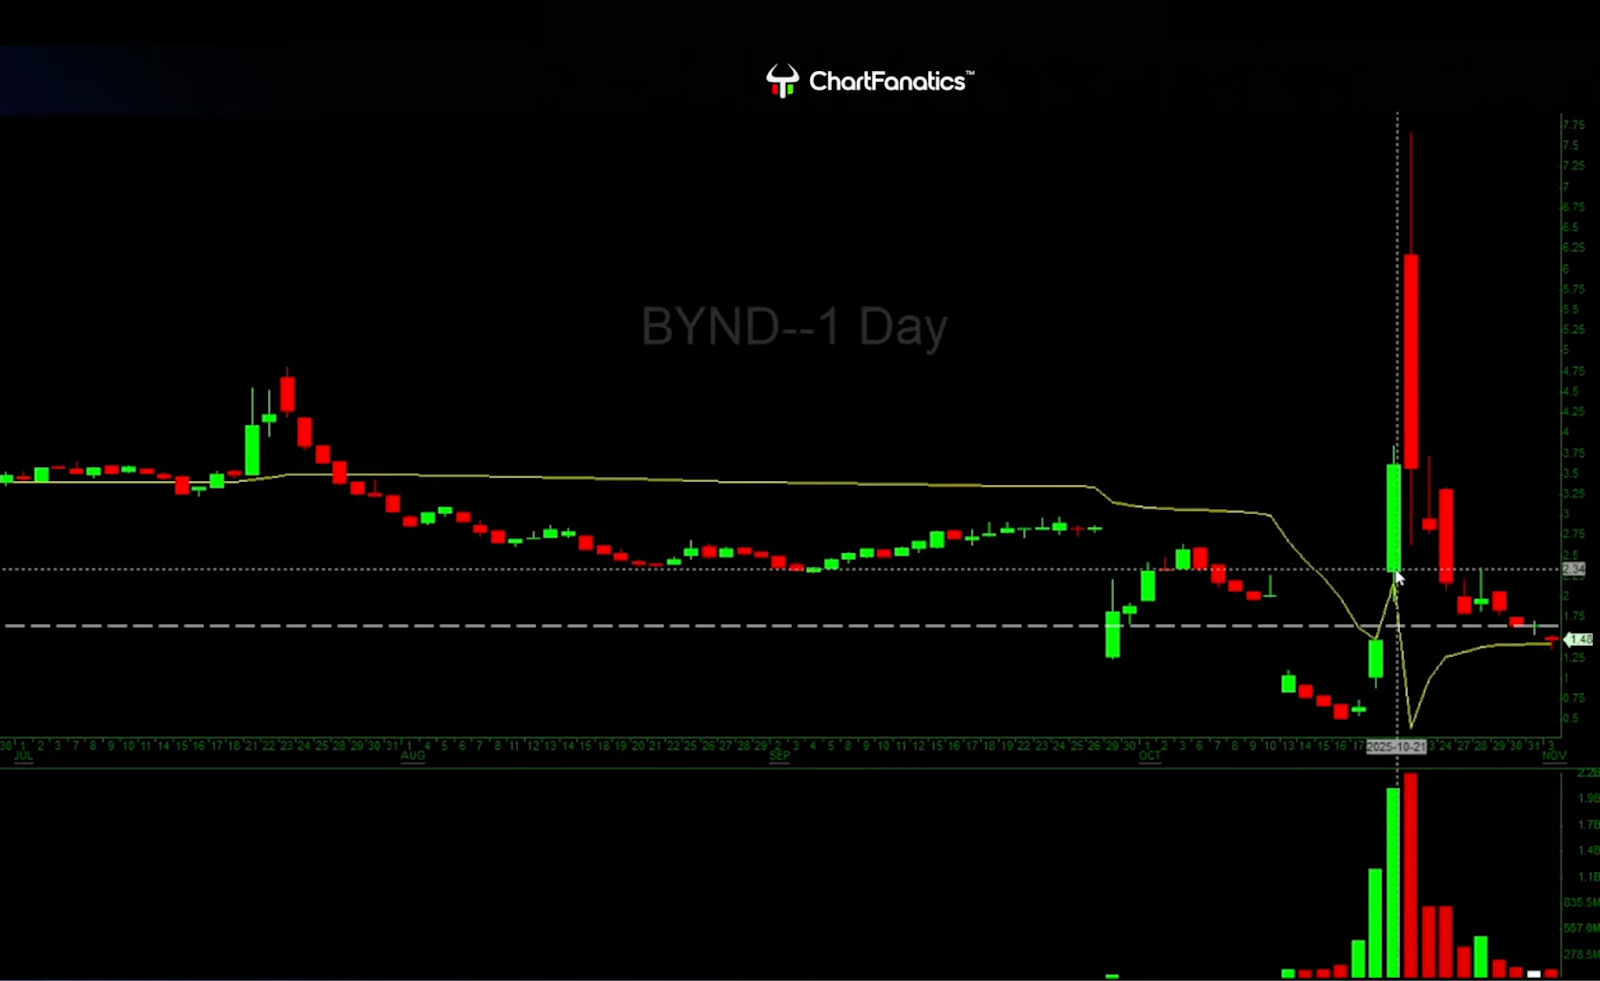
Daily Setup
BYND completed a multi-day euphoric run.
- Price advanced from approximately $0.50 to $7.70
- Extension exceeded 1,400%
- Volume expanded aggressively into the highs
- Daily ranges increased into the final push
- The top day showed blow-off characteristics
The structure met all First Red Day minimum criteria and was graded as A+.
Confirmation
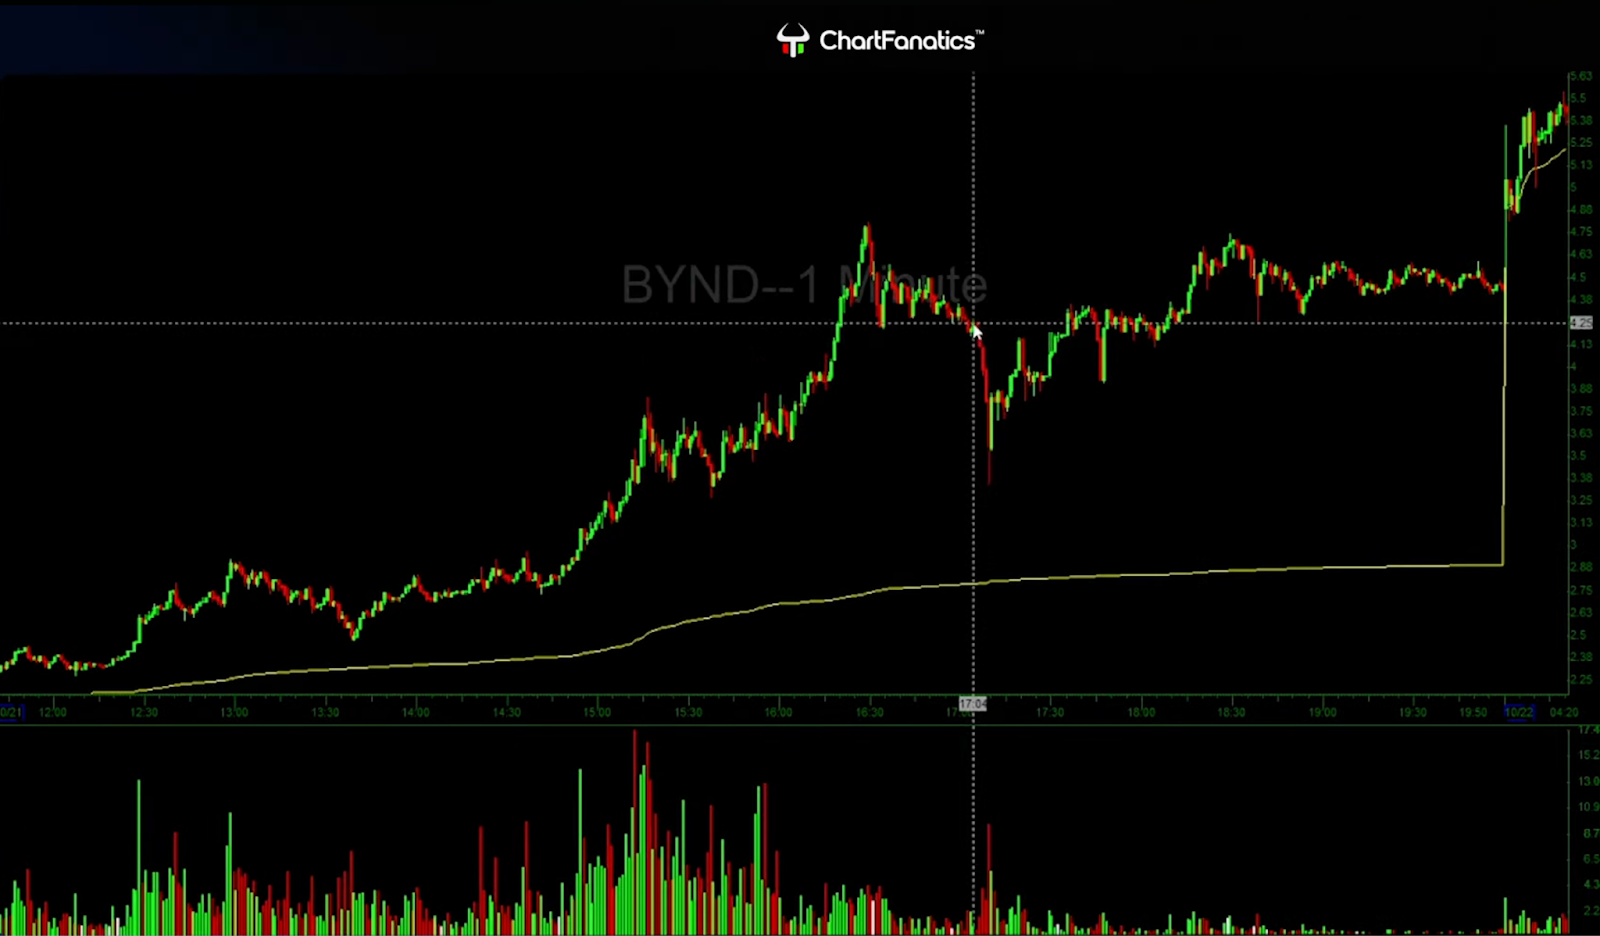
After several consecutive green days, the price failed to continue making new highs.
The key confirmation occurred when:
- Momentum stalled near highs
- Price broke below the previous day’s close
That break marked the first meaningful shift from expansion to weakness. The previous day’s close acted as the psychological inflection point.
Entry
A short was taken on the break below the previous day’s close. Risk was defined against the high of the run.
If price reclaimed new highs, the thesis would be invalid.
Intraday Development
Once red on the day:
- Selling pressure increased
- Bounces failed to reclaim resistance
- Lower highs began forming
The transition from momentum buying to distribution was clear. Additional size could be added on failed bounces with defined risk.
Exit
Partial covers were taken into weakness. The objective was to capture the unwind phase rather than predict the absolute bottom.
The trade produced a significant profit as the euphoric move reversed.
How to Backtest This First Red Day Strategy
The fastest way to test this First Red Day strategy is with TradeZella's automated no-code backtesting. Define your rules in plain English, hit run, and TradeZella runs them across 11+ years of historical data in seconds, then shows you every individual trade along with your win rate, profit factor, and expectancy instantly, without you stepping through a single chart. It is the quickest way to see whether the setup holds up before you risk a dollar.
You can also test it manually by replaying the market bar by bar. Load 11+ years of historical data, set up your daily and intraday charts the way you trade live, and replay sessions bar by bar. Find a small-cap that has run two or three or more consecutive green days with an 80% to 100%+ extension on expanding volume and range, then mark the previous day's close as your inflection level. Wait for the move to fail to make new highs and break below that close, short it, and define risk against the all-time high of the run. You can also test the intraday Parabolic Short and the Overextended Gap Down variation. Cover into weakness toward VWAP, scaling out rather than going all-or-nothing. Use automatic position sizing and drag your stop and target directly on the chart. Every backtested trade gets logged automatically with your entry, exit, position size, and P&L. Tag each setup and grade it A+, A, B, or C so you can compare them, add notes, and review the same way you would a live trade. After 30 to 50 trades, you can see your win rate, profit factor, and expectancy on each setup. Manual replay is the best way to build screen time and a real feel for the setup.
When you start trading live, import your live trades into TradeZella, the AI trading journal that does the journaling for you. Your backtest results and live results live in the same platform, so you always know how the strategy performs in testing vs how it performs with real money, without switching between tools or maintaining separate spreadsheets.
Start Backtesting This Strategy Using TradeZella
Frequently Asked Questions
What is the First Red Day strategy?
The First Red Day strategy short-sells euphoric small-cap runners during the exhaustion phase of a multi-day move. The edge comes from spotting mini bubbles, short-term parabolic advances fueled by momentum and emotional buying, and entering when that upward pressure starts to fail. The core idea is that the best signal a stock is ready to go down is when it can no longer go up. It prioritizes a higher win rate, defined structural invalidation, and controlled scaling by setup quality.
What qualifies a move as a First Red Day setup?
A First Red Day is not just any red candle. It is the first meaningful breakdown after a clean, extended, multi-day euphoric run that qualifies as a bubble. The non-negotiable minimums are at least two to three consecutive green days, an 80% to 100%+ extension from the start of the run, expanding daily volume, and expanding daily range. The best setups also show candles increasing in size into the top, no red days during the run, parabolic curvature, and a blow-off top with a large upper wick. Shrinking candles, declining volume, choppy structure, or frequent halts downgrade the setup.
Why is the previous day's close the most important level?
Retail traders judge profit and loss based on whether a stock is green or red versus the prior close, not the opening price. A stock can gap up, sell off heavily, and still look green on the day, so the true psychological shift happens only when price breaks below the previous close. At that point more traders become instantly underwater, fear replaces euphoria, the short-sale restriction can trigger after a 10% drop, and real selling pressure appears.
What are the entry methods?
There are three, from aggressive to conservative. The Pre-Red entry shorts before price breaks the prior close on a failure to make new highs, with risk at the all-time high, offering the best reward but more stop-outs. The Standard entry waits for the crack below the previous close and adds on failed bounces, with risk at today's high, and is the most balanced. The Lower High Confirmation entry waits for the breakdown, then the first bounce, and shorts the failed lower high for a higher win rate but worse reward-to-risk.
What other setups does this strategy include?
Beyond the primary First Red Day, there is the Parabolic Short, an intraday version that requires a true parabola with a gradual build, multiple green candles, shrinking pullbacks, and rising volume into the top, not a one-candle news spike, with VWAP as the target and a hard rule of three to five attempts maximum. There is also the Overextended Gap Down variation, where after multiple gap-ups the first significant gap down is traded on a bounce to improve reward-to-risk, but not shorted if the stock is already down more than 10%.
Can I backtest the First Red Day strategy?
Yes. You can test this strategy using TradeZella's backtesting with 11+ years of historical data. Replay sessions bar by bar, find a multi-day parabolic runner that meets the bubble criteria, mark the previous day's close, and short the break below it with risk against the all-time high, covering into weakness toward VWAP. Every trade logs automatically with entry, exit, position size, and P&L, and you can tag each setup and grade to track which conditions produce your edge. After 30 to 50 trades you can see your win rate, profit factor, and expectancy before risking real money.
What is TradeZella backtesting?
TradeZella backtesting lets you test a trading strategy against 11+ years of historical market data across forex, futures, stocks, and crypto, down to seconds-level timeframes. You can do it two ways. Replay the market bar by bar and place trades as if you were trading live, with your own timeframes, automatic position sizing, and stops and targets you drag right on the chart, and every trade logs automatically with entry, exit, size, and P&L. Or use automated no-code backtesting: define your strategy rules in plain English and the engine runs them across years of data in seconds, returning every individual trade it took with the exact setup drawn on the chart, so you see why each trade fired instead of just an equity curve. Zella AI then analyzes the results and flags what to fix.