


Built For
Instruments: Futures
Trading Style: Swing Trading
Strategy Overview
This strategy is built around one idea: trade better by first identifying the market environment.
Instead of forcing one “setup” every day, the process starts by answering a single question on the daily chart:
Is the market in:
- Consolidation (two-way tape).
- Trend / Expansion (one-directional).
- Mean Reversion (pullback against the primary trend).
Once the environment is clear, the execution becomes simple:
- Consolidation → two-way tape (trade edges, avoid the middle).
- Expansion → pick one direction only (long-only or short-only).
- Mean reversion → take the pullback to a defined target, smaller size if against the primary trend.
This strategy is primarily designed for index markets (S&P / Nasdaq / Russell) and is traded as a 1–5 day swing, with occasional intraday execution for entries.
Markets and Timeframe
Primary timeframe: Daily (everything starts here)
Execution timeframes (as needed): 60-min, 30-min, sometimes 3-min (only to refine entries in consolidation or to improve execution)
Typical holding time: 1 to 5 trading days
Tools and Chart Settings (Must Match)
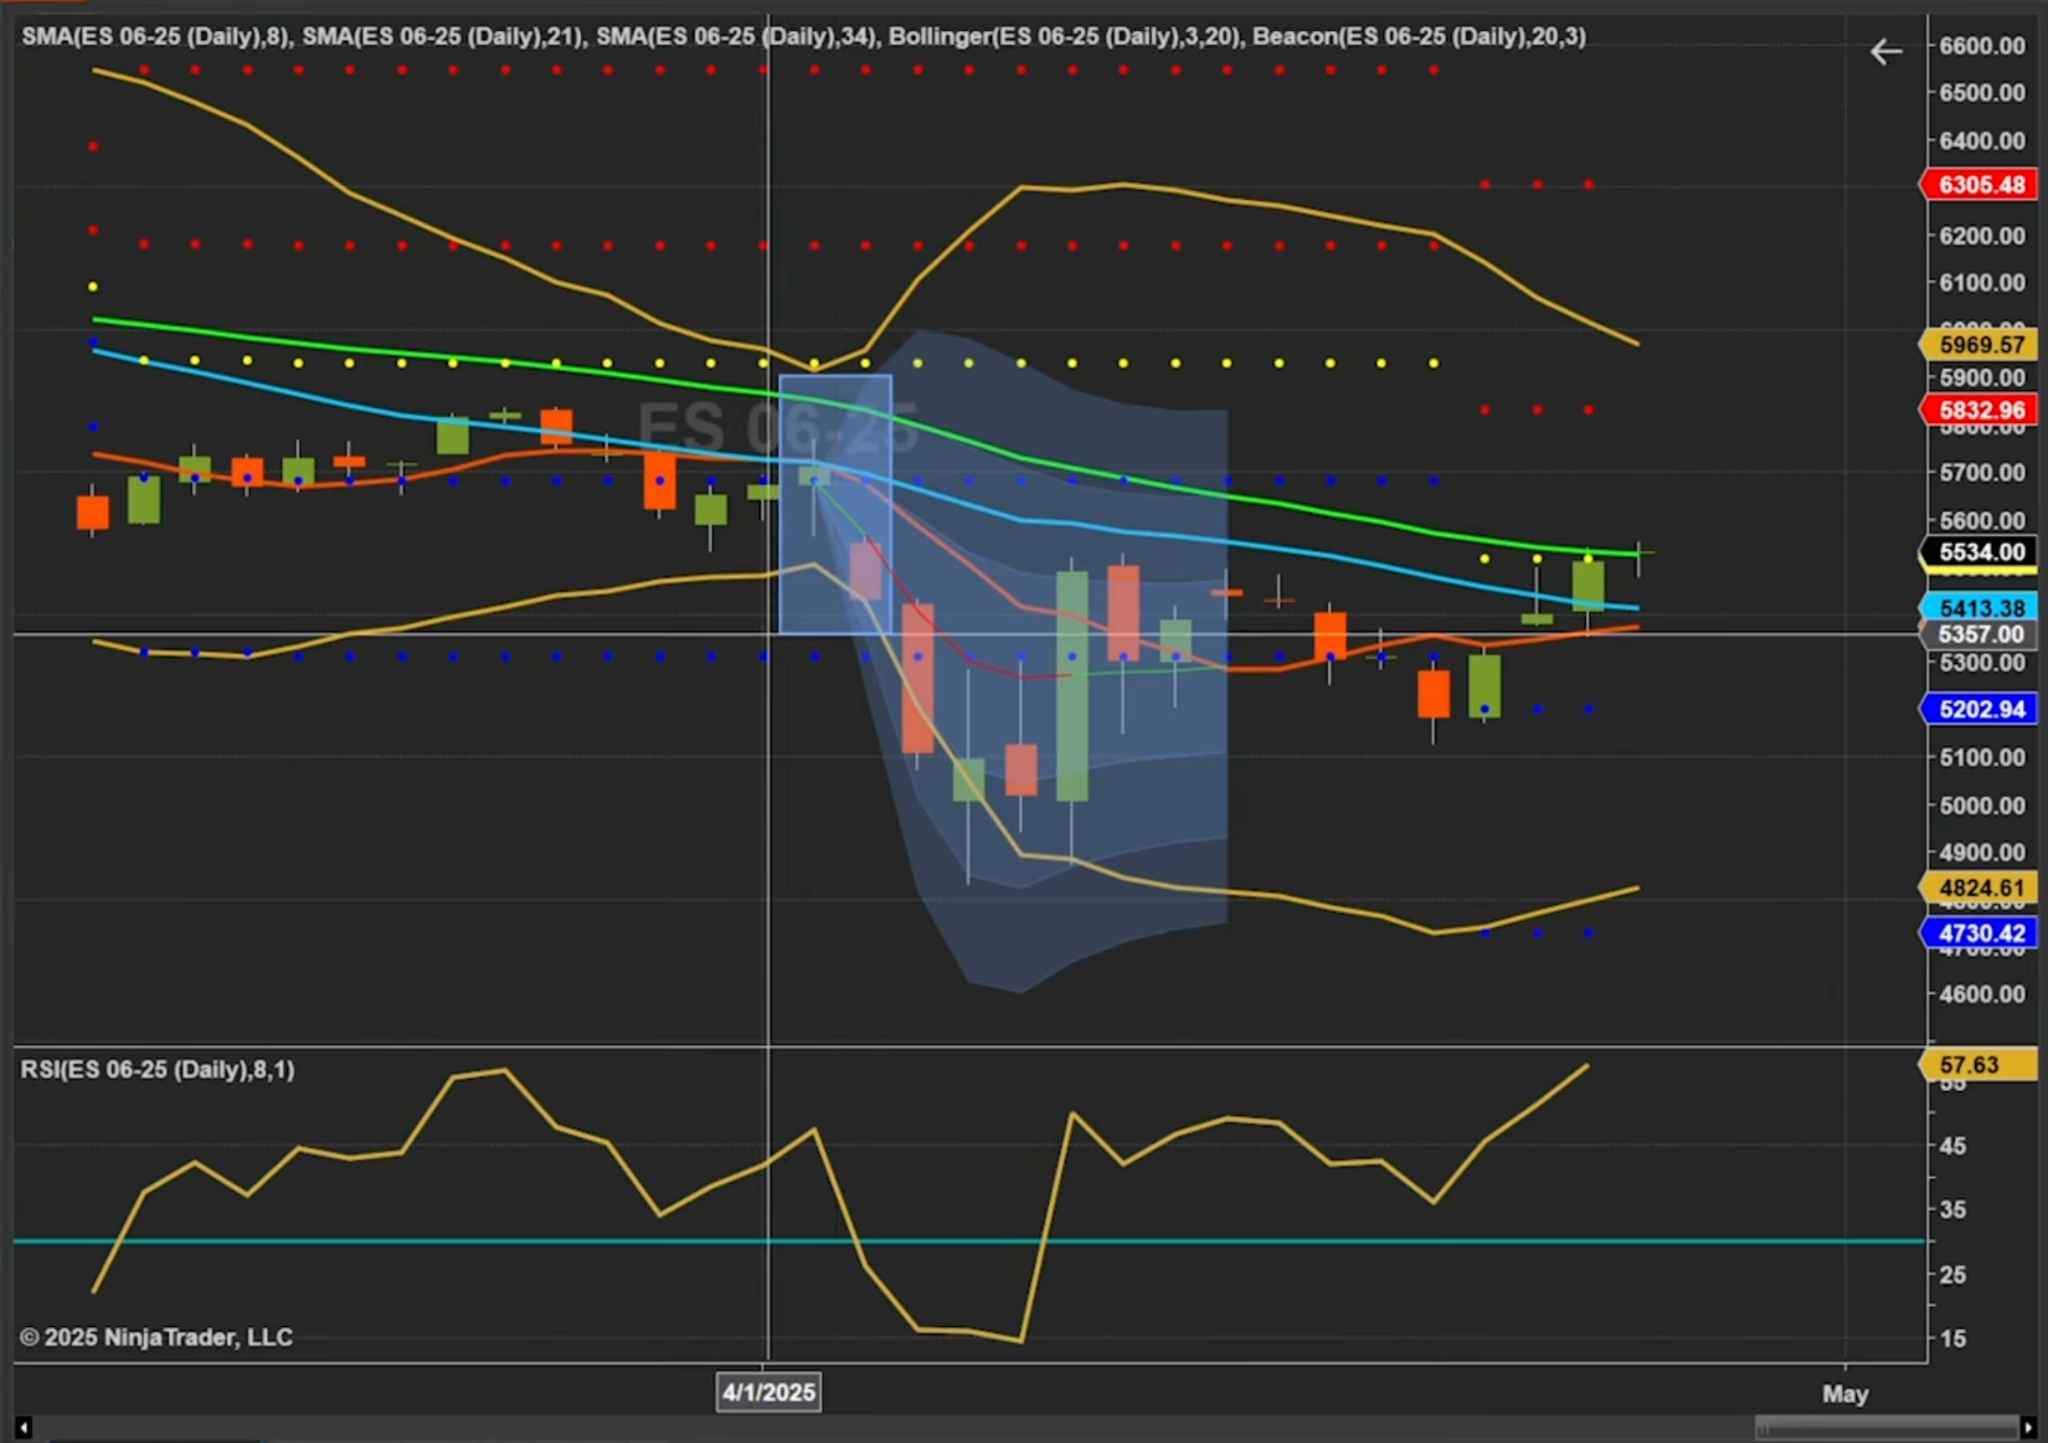
Core Indicator (Required)
Bollinger Bands:
- Length: 20
- Standard deviations: 3
- Purpose: identify environment fast (consolidation vs expansion vs mean reversion)
The 3-standard-deviation setting is intentional. It provides “enough room” for index volatility and avoids constant “overbought/oversold” noise you’d get with tighter bands.
Beacon (Anthony’s Tool)
Beacon: an automatic tool that draws the mean reversion Fib levels based on Bollinger Band peaks once the peaks are formed. It’s essentially an auto “fib overlay” for the mean reversion phase.
Tools (Do Not Use for Entries)
Moving averages:
Purpose: trend context + exit help
RSI (optional):
Purpose: only to confirm whether the market is oversold/overbought during a mean reversion opportunity. It does not generate entries.
Anchored VWAP (situational):
Used during extreme volatility to help manage exits and structure risk.
Strategy Setups
Consolidation (Two-Way Tape)
What it looks like (Daily chart)
- Bollinger Bands contract (they come in / narrow).
- Price becomes rangebound.
- Often follows a meaningful high or low (commonly forms after a move, not during clean trend progression).
What it means
- The market is likely to produce fake breakouts that snap back into the range.
- This is where traders get chopped up if they chase a bigger trend without adjusting.
Trading approach
- Two-way tape: can be long or short.
- Trade the edges of the range. Stay out of the middle.
- Expect stop-runs above recent highs/lows and reversion back into the range.
Execution rule
When daily is in consolidation:
- Drop down in timeframe (60-min / 30-min / sometimes 3-min).
- Reason: in consolidation, short-term technicals matter more.
Risk note
This is the environment most likely to chop up multi-day swing traders. If trading it, be selective and focus on edges.
Trend / Expansion (One-Directional Only)
What it looks like (Daily chart)
- Bollinger Bands go from flat to pointing outward.
- Bands expand (range expansion).
- Price touch the upper band in uptrends or the lower band in downtrends.
- Typically begins with a breakout from the prior consolidation range.
What it means
Once expansion is confirmed:
- Pick one direction and only trade that direction.
- No fading rallies in an up-expansion.
- No buying dips in a down-expansion.
Directional rules
Bullish expansion
Bands expanding upward + price breaks out → Long-only
Bearish expansion
Bands expanding downward + breakdown → Short-only
Targets inside expansion
Anthony uses two main target ideas:
Bigger picture targets
- Higher timeframe levels (weekly highs/lows, major reference points)
- Also includes referencing other trusted “big picture” levels (the concept is: use larger context targets)
“Unfinished Business” target (Bollinger Peak concept)
- A prior Bollinger Band peak becomes a future target.
- Logic: when the band peaked before and price later trends again, that prior peak is treated as an objective (“unfinished business”) in the next directional move.
Position vehicle
Most often: options on futures
- Why: allows staying with the move through volatility and avoids impossible futures stops.
- Typical selection: calls/puts 3 to 5 days out (not too far out, focused on the next directional push).
- Management: scale out into targets/levels.
Mean Reversion = Pullback Phase (Defined Trigger + Target)
What it looks like (Daily chart)
- After an expansion move, the market stops extending.
- Bollinger Bands start coming back in (contracting). This is the “you missed the top/bottom” phase — the strategy does not try to nail tops or bottoms.
Core concept
Mean reversion changes posture:
- Even if the primary trend is up, mean reversion means: no longer long
- You can trade against the primary trend, but that’s where discretion = smaller sizing
The Mean Reversion Trigger and Target
Anthony uses a Fibonacci-style framework, but not in the traditional way:
- Instead of fibbing “price,” it’s applied to the Bollinger Band peak-to-peak move (he describes it as using a fib on volatility rather than price).
Key levels used:
- 30%
- 50% (main target)
- 70%
Bearish mean reversion rule:
- Once there is a daily close below the 30% line, the target becomes 50%.
- Action: buy puts or short futures until a daily close back above the relevant level.
- Exit idea: once 50% is hit, the mean reversion objective is considered done.
What happens after 50% hits?
This becomes the “hands in pocket” zone:
- Price may chop and consolidate
- Or it may transition into a new expansion phase
- The strategy waits for the environment to become clear again.
Execution Rules
Daily Process (Non-negotiable)
- Open the daily chart.
- Identify environment using Bollinger Bands:
- contracting = consolidation
- expanding = trend
- contracting after a peak + Beacon levels = mean reversion phase
- Set posture:
- consolidation = two-way edges
- expansion = one direction only
- mean reversion = trade to 50%, smaller size if against primary trend
- Only then drop to a lower timeframe to improve execution.
Entry Guidelines
This system is not a “one candle entry signal.” Entries are built from:
- Environment + direction first
- Then execution tools (lower timeframe structure, order flow tools, etc.) to improve entry quality
In practice:
- Expansion: enter after breakout/confirmation; manage as trend continuation
- Consolidation: enter near range edges; avoid center
- Mean reversion: execute after daily trigger (close below 30% line), aim for 50%
Stops and Risk Management (Matches His Discretion)
Position sizing is the biggest discretion
- Risk is managed in dollars, not in “one contract every time.”
- If the risk distance is large, the size must shrink.
Futures vs options decision
If the stop becomes unrealistically wide on futures:
- Use options instead (risk is predefined by the premium)
- Often, out-of-the-money puts/calls are used so the risk is capped and survivable.
Key stop logic in volatility
During extreme volatility and gaps:
- The “correct” stop may be above a key high (or below a key low), which is often too large for futures sizing.
- This is where options become the primary tool.
Trade Management and Exits
Anthony repeatedly highlights that the hardest part is:
- targets
- exits
- stop placement
Tools used to solve this:
- 8/21/34 moving averages (exit context, not entry signals)
- anchored VWAP (when volatility is extreme)
Anchored VWAP method (situational but important)
- Anchor VWAP to the candle/level where the tape turned (key high/low)
- Use VWAP + 1/2/3 standard deviation bands as a framework:
- “Can it stay below VWAP?” (bear case)
- Use deviation bands as trim/exit guides
Pros and Cons of the Strategy
This strategy is designed to deliver high-quality, repeatable setups — but like any trading strategy, there are key things to understand before using it.
Note: The cons listed here aren’t disadvantages. They are things to be aware of — important characteristics that require patience, discipline, and proper management to make the strategy work effectively.
Pros
- This framework makes the market easy to understand.
- It reduces overtrading.
- It prevents fading strong trends.
- It works in both bull and bear markets.
- It simplifies decision-making.
Cons
- It requires patience.
- The in-between phases are difficult.
- Targets are discretionary.
- Volatility and news can disrupt structure.
- Sometimes the correct trade is no trade.
Trade Breakdown – Bearish Expansion Into Mean Reversion
Context
- The market was in a downtrend for the year.
- There was a consolidation zone where Bollinger Bands contracted.
- Then bands expanded down → idea became short-only.
Volatility complication (gap + extreme range)
- A key high formed where “the tape turned.” Because of the gap and the distance needed for a proper stop (above the high), managing risk with futures became difficult.
- Solution used: buy out-of-the-money puts (risk defined by premium).
How to Backtest This Futures Trading Strategy
The fastest way to test this Futures Trading Strategy is with TradeZella's automated no-code backtesting. Define your rules in plain English, hit run, and TradeZella runs them across 11+ years of historical data in seconds, then shows you every individual trade along with your win rate, profit factor, and expectancy instantly, without you stepping through a single chart. It is the quickest way to see whether the setup holds up before you risk a dollar.
You can also test it manually by replaying the market bar by bar. Load 11+ years of historical data, set up your daily chart with Bollinger Bands at length 20 and 3 standard deviations the way you trade live, and replay price bar by bar. Read the environment first: contracting bands mean consolidation, so trade the edges; expanding bands mean trend, so pick one direction only; contracting bands after a peak mean the mean reversion phase, where you trade the pullback to the 50% level on a daily close below the 30% line. Drop to the 60-minute or 30-minute chart only to refine entries, size in dollars rather than fixed contracts, and use your execution timeframes to place the trade. Use automatic position sizing and drag your stop and target directly on the chart. Every backtested trade gets logged automatically with your entry, exit, position size, and P&L. Tag each environment, consolidation, expansion, and mean reversion, so you can compare them, add notes, and review the same way you would a live trade. After 30 to 50 trades, you can see your win rate, profit factor, and expectancy in each environment. Manual replay is the best way to build screen time and a real feel for the setup.
When you start trading live, import your live trades into TradeZella, the AI trading journal that does the journaling for you. Your backtest results and live results live in the same platform, so you always know how the strategy performs in testing vs how it performs with real money, without switching between tools or maintaining separate spreadsheets.
Start Backtesting This Strategy Using TradeZella
Frequently Asked Questions
What is this Futures Trading Strategy?
This Futures Trading Strategy is a swing trading framework that trades better by first identifying the market environment instead of forcing one setup every day. Starting on the daily chart, you answer a single question: is the market in consolidation, trend or expansion, or mean reversion? Once the environment is clear, execution becomes simple, and position size and approach adapt to each condition. It is designed mainly for index futures like the S&P, Nasdaq, and Russell, traded as a 1 to 5 day swing.
How do you identify the market environment with Bollinger Bands?
The strategy uses Bollinger Bands set to length 20 and 3 standard deviations on the daily chart. Contracting bands signal consolidation, expanding bands that point outward signal trend or expansion, and bands contracting after a peak signal the mean reversion phase. The 3 standard deviation setting is intentional, giving enough room for index volatility and avoiding the constant overbought or oversold noise you get from tighter bands.
What are the three market environments and how do you trade each?
In consolidation the tape is two-way, so you trade the edges of the range and avoid the middle, expecting stop-runs that snap back. In expansion you pick one direction only, long-only in an up-expansion and short-only in a down-expansion, and never fade the trend. In mean reversion you change posture and trade the pullback to a defined target, using smaller size if you are trading against the primary trend. Knowing the environment first is what prevents overtrading and fading strong trends.
How does the mean reversion trigger and target work?
Rather than fibbing price, the strategy applies a Fibonacci framework to the Bollinger Band peak-to-peak move, essentially a fib on volatility, using the 30%, 50%, and 70% levels. In a bearish mean reversion, once there is a daily close below the 30% line, the target becomes the 50% level, and you buy puts or short futures until a daily close back above the relevant level. Once 50% is hit, the mean reversion objective is considered done and the market enters a hands-in-pocket zone until the environment is clear again.
What instruments, timeframe, and tools does this strategy use?
It is built for index futures (S&P, Nasdaq, Russell), with the daily chart as the primary timeframe and the 60-minute, 30-minute, or sometimes 3-minute charts used only to refine entries, holding 1 to 5 days. The required indicator is Bollinger Bands at 20 length and 3 standard deviations, with moving averages and RSI used only for context and exits, not entries, and anchored VWAP used in extreme volatility. The position vehicle is often options on futures, since premium-defined risk lets you stay with the move when a proper futures stop would be too wide.
Can I backtest this Futures Trading Strategy?
Yes. You can test this strategy using TradeZella's backtesting with 11+ years of historical futures data. Replay the daily chart with Bollinger Bands at 20 and 3 standard deviations, classify the environment, set the matching posture, and execute, including the mean reversion trigger on a daily close below the 30% line targeting 50%. Every trade logs automatically with entry, exit, position size, and P&L, and you can tag consolidation, expansion, and mean reversion trades separately. After 30 to 50 trades you can see your win rate, profit factor, and expectancy in each environment before risking real money.
What is TradeZella backtesting?
TradeZella backtesting lets you test a trading strategy against 11+ years of historical market data across forex, futures, stocks, and crypto, down to seconds-level timeframes. You can do it two ways. Replay the market bar by bar and place trades as if you were trading live, with your own timeframes, automatic position sizing, and stops and targets you drag right on the chart, and every trade logs automatically with entry, exit, size, and P&L. Or use automated no-code backtesting: define your strategy rules in plain English and the engine runs them across years of data in seconds, returning every individual trade it took with the exact setup drawn on the chart, so you see why each trade fired instead of just an equity curve. Zella AI then analyzes the results and flags what to fix.