


Built For
Instruments: Stocks/Futures/Crypto
Trading Style: Swing Trading
Strategy Overview
This strategy is built around a simple but powerful idea: price moves in repeating, measured patterns within a trend. Instead of relying on complex indicators or multiple tools, this approach focuses on identifying small trend structures and projecting the next move based on them.
At its core, the strategy measures how far price retraces during a pullback and uses that same distance to anticipate the next move in the direction of the trend. These repeating structures act as a guide to determine whether a trend is continuing, weakening, or about to reverse.
In Marci’s view, the power of this pattern comes from the same idea behind Fibonacci retracements and extensions. It is a simple way of seeing those relationships without having to draw every level manually.
At a deeper level, this strategy reflects the ongoing balance between buyers and sellers. While traders may use different tools, the goal is the same: understanding which side is in control and whether that pressure is strengthening or fading.
To support this, Bollinger Bands are used as a context tool to determine whether the price is trading in a “normal range” or is stretched too far, helping identify exhaustion and potential turning points.
This method can be applied across all timeframes, but it is most effective on higher timeframes when identifying major market tops, bottoms, and long-term opportunities.
Core Concept: The “Little RZY” Structure
The foundation of this strategy is a repeating price pattern that forms during trends.
In a downtrend, the price does not move straight down. It drops, pulls back, and then continues lower. This pullback forms a small structure that can be measured.
To identify it clearly:
- Price makes an initial strong move (impulse).
- A bounce (pullback) follows.
- A downward trendline can be drawn across the highs of that pullback.
- One of the candles within this structure forms the lowest low.
The key idea is simple:
Measure the distance from the lowest point of that structure to the trendline directly above it. That exact distance is then projected downward from the low to estimate the next move.
This same concept applies in reverse for uptrends.
Each Little RZY should be treated as its own structure with its own trendline and measured move. It is not meant to be viewed as one continuous trendline across the entire trend.
Strategy Rules
1. Identify the Trend First
Before applying the setup, determine whether the market is trending.
In a downtrend:
- Price continues forming lower highs and lower lows.
- Multiple “Little RZY” structures appear one after another.
- Each one projects the price further down.
In an uptrend:
- Price forms higher highs and higher lows.
- The same structure appears inverted.
If the price begins to move sideways and these structures stop forming, the trend may be weakening or ending.
2. Wait for the Initial Move and Pullback
The setup begins after a clear directional move.
You do not enter during the initial drop or rally.
You wait for:
- A strong move
- Followed by a bounce (pullback)
This pullback is where the structure begins forming.
3. Draw the Trendline
Once the pullback begins:
- Draw a trendline across the pullback highs (in a downtrend)
- Or across the pullback lows (in an uptrend)
This trendline defines the structure.
4. Measure the Move
Find the candle within the structure that has the lowest low (for shorts) or highest high (for longs).
Then:
- Measure vertically from that candle up to the trendline
- This distance represents the expected continuation move
Project that same distance:
- Downward in a downtrend
- Upward in an uptrend
This becomes your target.
5. Entry Logic
For short positions:
- Wait for the pullback to form and begin rejecting the trendline
- Enter as the price starts moving back in the direction of the trend
For long positions:
- Wait for the pullback to complete
- Enter as the price begins pushing upward again
A key idea is patience. The setup forms after the bounce—not during the impulse.
6. Stop Loss Placement
Stops are based on structure, not random levels.
For shorts:
- Place the stop above the trendline or recent swing high
- Ideally, wait for a confirmed close above the trendline before invalidating
For longs:
- Place the stop below the trendline or recent swing low
Avoid placing stops too tight, as price may retest the trendline before continuing.
7. Profit Target
The primary target is the measured move:
- The same distance from low to trendline, projected outward
The strategy assumes that price tends to complete these moves once the structure forms.
Partial exits can be considered, but the core idea is to allow the full move to play out.
8. Use Bollinger Bands for Context
Bollinger Bands are used to determine whether the price is stretched.
- The middle band represents “normal price” (mean)
- The upper and lower bands represent extremes
Key insights:
- If the price is near or beyond the outer bands, it is “out of reality.”
- Markets tend to revert back toward the middle
Best conditions:
- In a downtrend, early structures forming near the upper band are higher probability
- In an uptrend, early structures forming near the lower band are stronger
As price moves further toward extremes, the trend begins to weaken.
9. Trend Continuation vs. Exhaustion
Early structures in a trend are the most reliable.
- The first and second “Little RZY” patterns often produce strong continuation moves
- Later structures become weaker as the market gets exhausted
In general, the first one or two Little RZYs in a fresh trend tend to be the strongest. By the fourth or fifth pattern, the move often becomes exhausted and more vulnerable to a bounce or reversal.
When:
- The structures become smaller
- Price reaches extreme Bollinger levels
- Or the market starts moving sideways
This signals that the trend may be ending.
10. Invalid Conditions
The setup is no longer valid if:
- Price breaks and closes beyond the trendline
- The structure becomes too extended or irregular
- Price collapses sharply without forming a proper pullback
When invalidated, wait for a new structure to form.
How This Strategy Identifies Market Bottoms
This method is particularly effective during market crashes.
As price falls:
- Multiple measured structures form
- Each projects a continuation lower
Eventually:
- One of these projections aligns with key support or broader context
- Price becomes extended (out of Bollinger range)
- The market begins to stall or consolidate
At this stage:
- The measured move provides a zone where the bottom is likely forming
- Confirmation can come from a move back above the Bollinger midline
This allows traders to anticipate reversals rather than react to them.
Timeframe Considerations
This strategy works on all timeframes, but:
Higher timeframes:
- Provide more reliable structures
- Are better for identifying major reversals and investment entries
Lower timeframes:
- Offer more setups
- Require faster decision-making and more experience
A common approach is:
- Identify direction on higher timeframes
- Execute on lower timeframes
If the structure is unclear on one timeframe, zooming into a lower timeframe can make the Little RZY easier to see. What looks like sideways movement may reveal a clearer structure.
Execution Note
These patterns are easier to explain in hindsight than they are to catch perfectly in real time. You will miss some setups, identify some late, and misread others. Consistent chart time and repetition are required to improve recognition.
Trade Breakdown
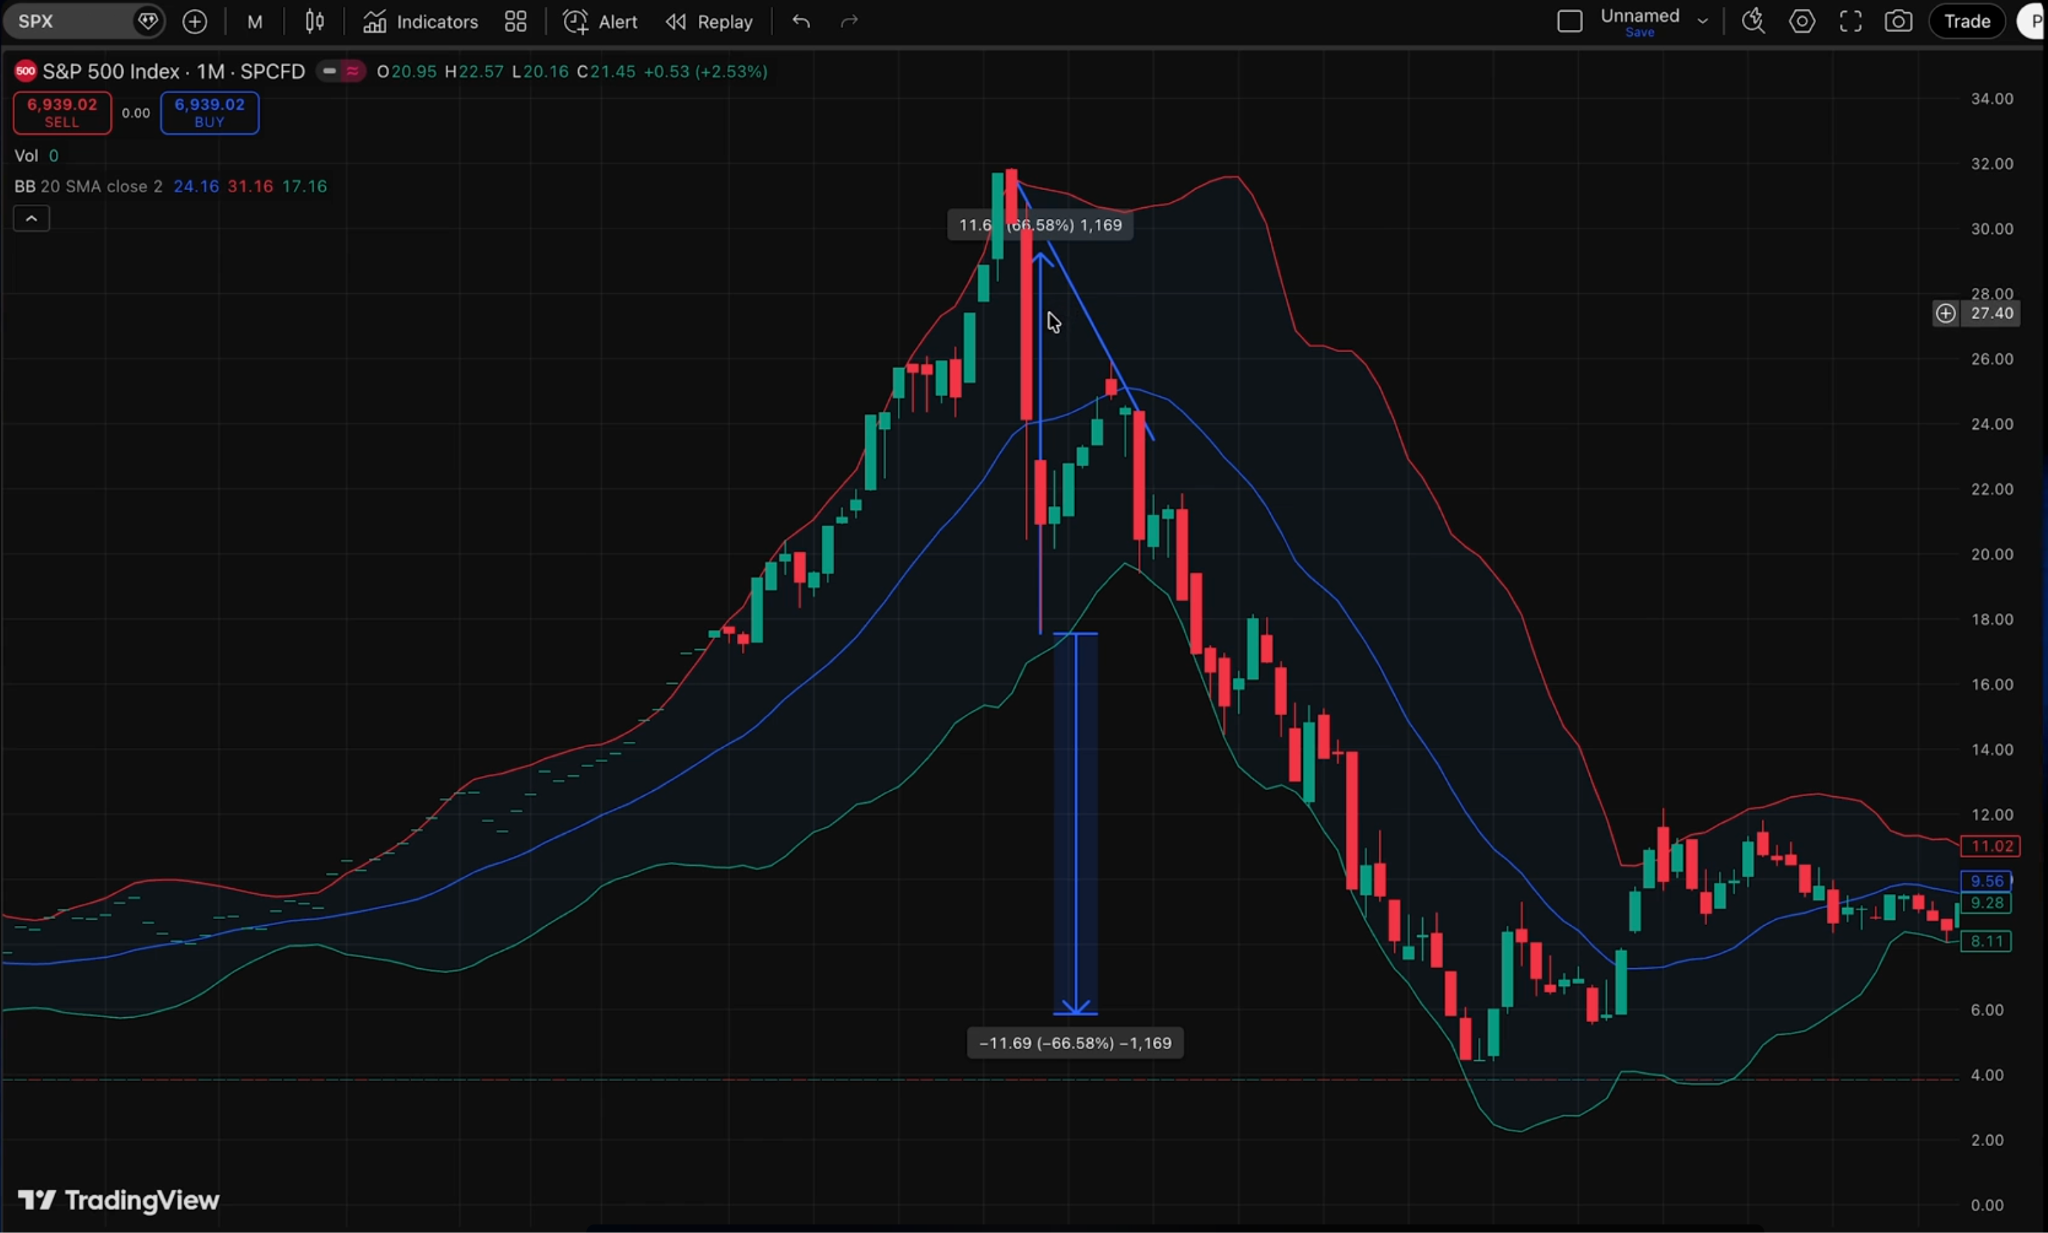
Trade Example: Short Setup (Downtrend “Little RZY”)
Step 1: Identify the Trend
Price is in a clear downtrend, consistently forming lower highs and lower lows, showing strong selling pressure.
Step 2: Wait for the Move and Pullback
Price makes a strong move downward. After the drop, it begins to bounce upward. This bounce is important, as it forms the structure needed for the setup.
Step 3: Form the Structure
As price pulls back, a trendline can be drawn across the highs of the bounce. Within this structure, identify the candle that creates the lowest low.
Step 4: Measure the Move
From that lowest low, measure straight up to the trendline. This distance represents the expected continuation move.
Step 5: Project the Target
Take that same measured distance and project it downward from the low. This gives a clear target for where price is likely to move next.
Step 6: Entry
Once the pullback is formed and price begins to move back down, a short position can be taken in the direction of the trend.
Step 7: Stop Loss
The stop is placed above the trendline or recent swing high. If price closes above the trendline, the setup is considered invalid.
Step 8: Outcome
Price continues downward and completes the measured move, reaching the projected target.
How to Backtest This Measured Move Trend Strategy
You can test this Measured Move Trend Strategy before risking real money using TradeZella's backtesting. Load 11+ years of historical data, set up your chart with Bollinger Bands the way you trade live, and replay price bar by bar, ideally on higher timeframes where the structures are cleaner. Confirm the trend, wait for a strong move followed by a pullback, then draw a trendline across the pullback highs in a downtrend or lows in an uptrend to define the Little RZY structure. Measure from the lowest low or highest high to the trendline, project that same distance in the direction of the trend for your target, and enter as price rejects the trendline and resumes the trend. Place your stop above the trendline or swing high for shorts, below for longs, and use Bollinger Bands to favor early structures forming near the outer band. Use automatic position sizing and drag your stop and target directly on the chart. Every backtested trade gets logged automatically with your entry, exit, position size, and P&L. Tag each structure by its position in the trend, first, second, or later, so you can see where the edge concentrates, add notes, and review the same way you would a live trade. After 30 to 50 trades, you can see your win rate, profit factor, and expectancy on this specific setup, giving you a real picture of how it is likely to perform in live market conditions before you risk a dollar.
When you start trading live, import your live trades into TradeZella, the AI trading journal that does the journaling for you. Your backtest results and live results live in the same platform, so you always know how the strategy performs in testing vs how it performs with real money, without switching between tools or maintaining separate spreadsheets.
TradeZella is also introducing automated no-code backtesting, where you define your rules and run the backtest, and then it shows you how the strategy would have performed over years of historical data without you needing to step through a single chart.
Start Backtesting This Strategy Using TradeZella
Frequently Asked Questions
What is the Measured Move Trend Strategy?
The Measured Move Trend Strategy is built on the idea that price moves in repeating, measured patterns within a trend. It identifies small trend structures, measures how far price retraces during a pullback, and projects that same distance to anticipate the next move in the trend direction. It is the same relationship behind Fibonacci retracements and extensions, seen without drawing every level, with Bollinger Bands added as context to judge whether price is in a normal range or stretched too far.
What is the "Little RZY" structure?
The Little RZY is the repeating pullback structure that forms during trends. In a downtrend, price makes a strong impulse down, bounces, and then continues lower; that bounce forms a small structure you can draw a downward trendline across the highs of, with one candle inside making the lowest low. The same idea applies inverted in an uptrend. Each Little RZY is treated as its own structure with its own trendline and measured move, not one continuous trendline across the whole trend.
How do you measure and project the move?
After drawing the trendline across the pullback, you find the candle within the structure that has the lowest low for shorts or the highest high for longs, then measure vertically from that candle to the trendline. That distance represents the expected continuation, so you project the same distance downward in a downtrend or upward in an uptrend to set your target. The strategy assumes price tends to complete these moves once the structure forms, so the measured move is the primary target.
How are Bollinger Bands used for context?
Bollinger Bands judge whether price is stretched. The middle band represents normal price or the mean, and the outer bands represent extremes. When price is near or beyond the outer bands it is out of reality and markets tend to revert toward the middle. In a downtrend, early structures forming near the upper band are higher probability, and in an uptrend, early structures near the lower band are stronger. As price pushes toward the extremes, the trend begins to weaken, and a move back above the midline can confirm a bottom is forming.
Why are early structures stronger than later ones?
Early structures in a fresh trend are the most reliable, so the first and second Little RZY patterns often produce strong continuation moves. By the fourth or fifth pattern, the trend tends to be exhausted and more vulnerable to a bounce or reversal. When the structures get smaller, price reaches extreme Bollinger levels, or the market starts moving sideways, it signals the trend may be ending. A close beyond the trendline, an irregular or overextended structure, or a sharp collapse with no proper pullback invalidates the setup.
Can I backtest the Measured Move Trend Strategy?
Yes. You can test this strategy using TradeZella's backtesting with 11+ years of historical data. Replay price with Bollinger Bands, confirm the trend, wait for the impulse and pullback, draw the trendline, measure and project the move, and enter as price rejects the trendline and resumes the trend, with the stop beyond the trendline or swing. Every trade logs automatically with entry, exit, position size, and P&L, and you can tag each structure by its position in the trend to see where the edge concentrates. After 30 to 50 trades you can see your win rate, profit factor, and expectancy before risking real money.
What is TradeZella backtesting?
TradeZella backtesting lets you replay 11+ years of historical market data across forex, futures, stocks, and crypto and place trades as if you were trading live. Set up your timeframes the way you trade, use automatic position sizing, drag your stop and target directly on the chart, and every trade gets logged automatically with your entry, exit, position size, and P&L. TradeZella is also introducing automated no-code backtesting, where you define your strategy rules in plain English and the engine runs them across years of historical data, showing every individual trade executed with the results without you needing to do anything.