


Built For
Instruments: Futures
Trading Style: Day Trading/ Swing Trading
Strategy Overview
This strategy focuses on the Volatility Index (VIX) and how it directly affects the S&P 500 and its futures (ES), as well as how it can be used to understand strength or weakness in the market.
The VIX tells you whether there is pressure on the S&P 500.
- When pressure increases, ES struggles.
- When pressure decreases, ES can push higher.
Because VIX pricing comes directly from SPX options, it gives you a live reading of how much fear or stress exists in the market. And since ES/NQ move closely together, knowing what the VIX is doing lets you understand whether a move in ES or NQ has real power behind it — or if it’s likely to fail.
This strategy helps you:
- Understand which side is in control (bulls or bears)
- Avoid getting trapped in fake breakouts and breakdowns
- Know when a move in ES/NQ is real or weak
- Add a reliable confirmation layer to your existing strategy
- Time high-probability continuation moves
- Time high-probability reversal squeezes
- Use previous day highs/lows in a way that actually matters
The Foundation: What the VIX Really Shows
To understand this strategy, you need to understand a few key points:
What the VIX measures
- The VIX is a real-time measurement of expected volatility in the S&P over the next 30 days. It is calculated from SPX options, mainly put demand.
- More put demand → more fear → VIX goes up.
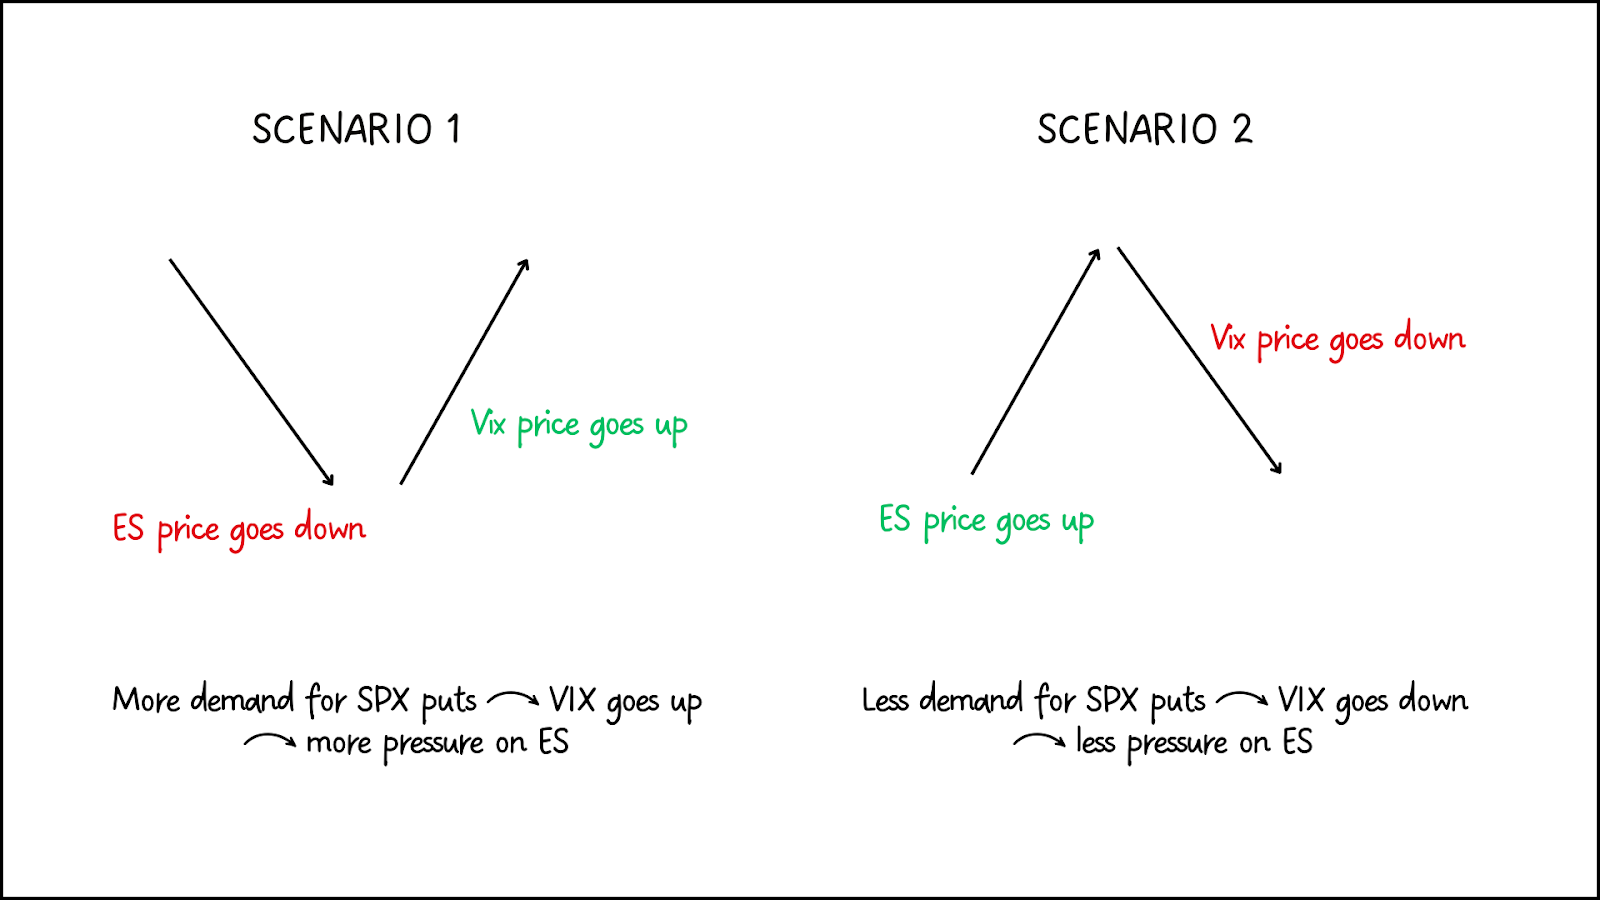
Simple relationship
- More demand for SPX puts → VIX goes up → more pressure on ES
- Less demand for SPX puts → VIX goes down → less pressure on ES
Why it matters for futures
About 90% of ES volume is algorithms.
- VIX rising triggers sell programs
- VIX dropping triggers buy programs
This is why the VIX often gives a better read on the market than price action alone.
How the VIX Affects ES and NQ
When the demand for S&P puts increases, VIX rises. That rise adds pressure to the S&P. When demand for puts drops, VIX falls, and that takes pressure off. Because ES and NQ tend to move together, you can use VIX movement to get a better understanding of which moves are real and which ones are likely to fail.
A helpful way to think about it is with the analogy Dylan used:
- When VIX is low, ES is like a hiker going up a mountain with no weight. It’s easier to climb.
- When VIX is high, ES is climbing with a heavy backpack. It’s harder to make progress, and any climb is more likely to fail.
So when VIX is weak and trending down, ES has a better chance of holding support and pushing higher. When VIX is strong and trending up, ES is more likely to struggle, and rallies often fail.
Put simply
- Weak VIX → easier for ES to go up
- Strong VIX → harder for ES to go up
Using Previous Day Levels With the VIX
Previous day highs and lows become extremely powerful when you combine them with VIX behavior. The way the VIX reacts at the same moment ES or NQ hits these levels can tell you whether a move is likely to continue or fail.
You compare: ES/NQ breaking the previous day’s low or high, where the VIX is relative to its previous day's high/low
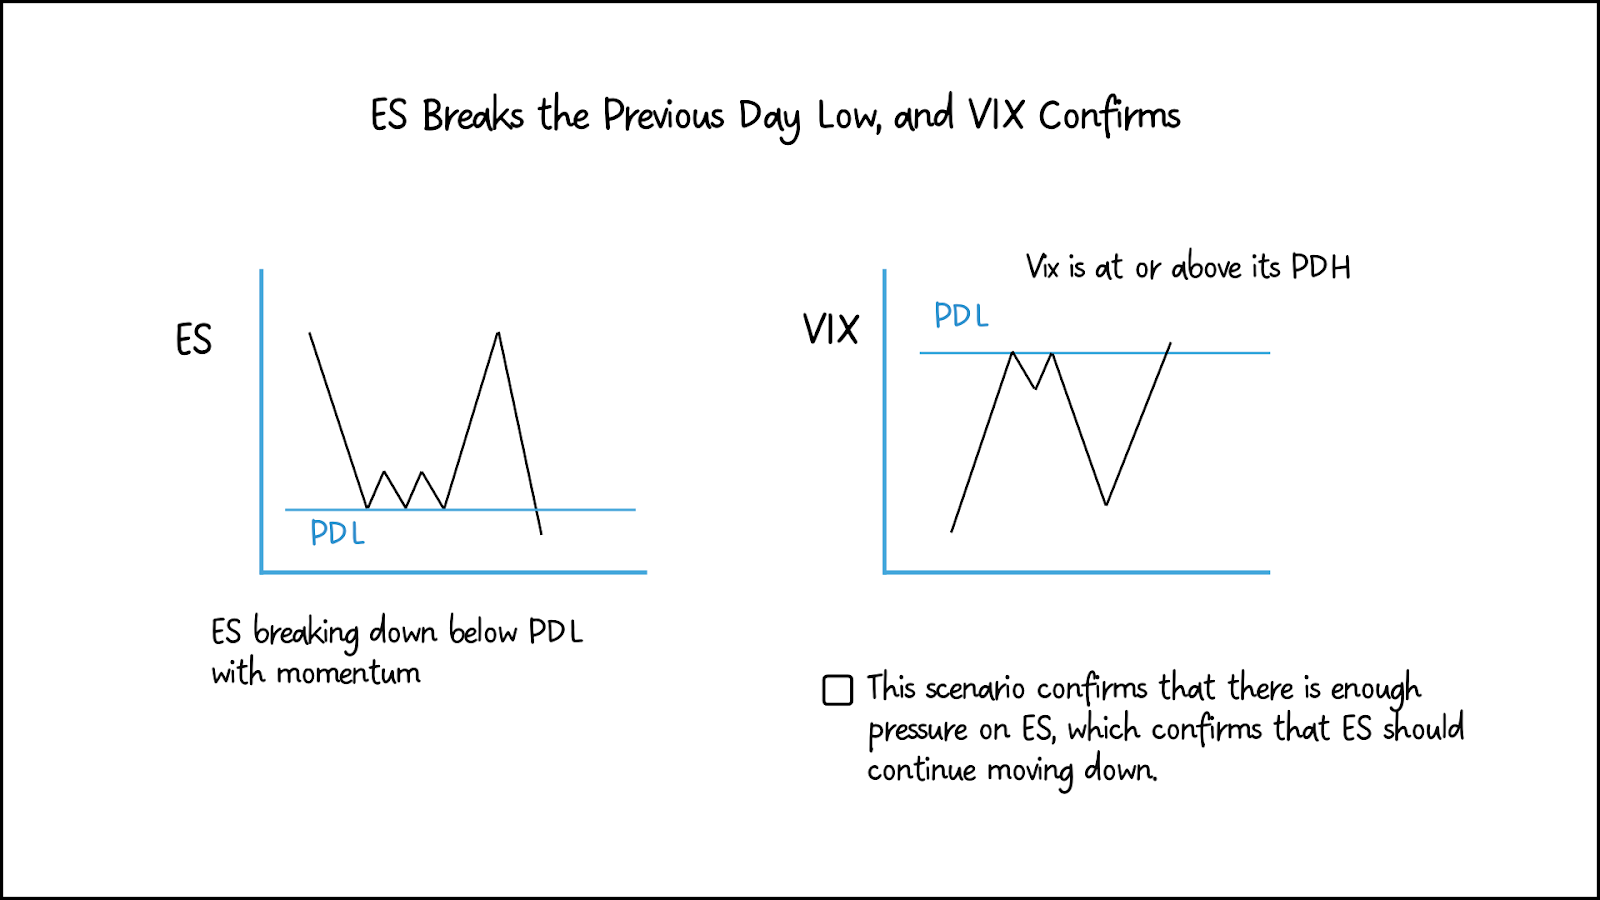
ES Breaks the Previous Day Low, and VIX Confirms
When ES breaks below the previous day’s low (PDL), the VIX should normally be rising and sitting at or above its previous day’s high.
This means:
- Put demand is increasing
- Pressure is being added
- The move down has higher odds of continuing
When ES breaks the low and VIX confirms, the downside usually has real strength behind it.
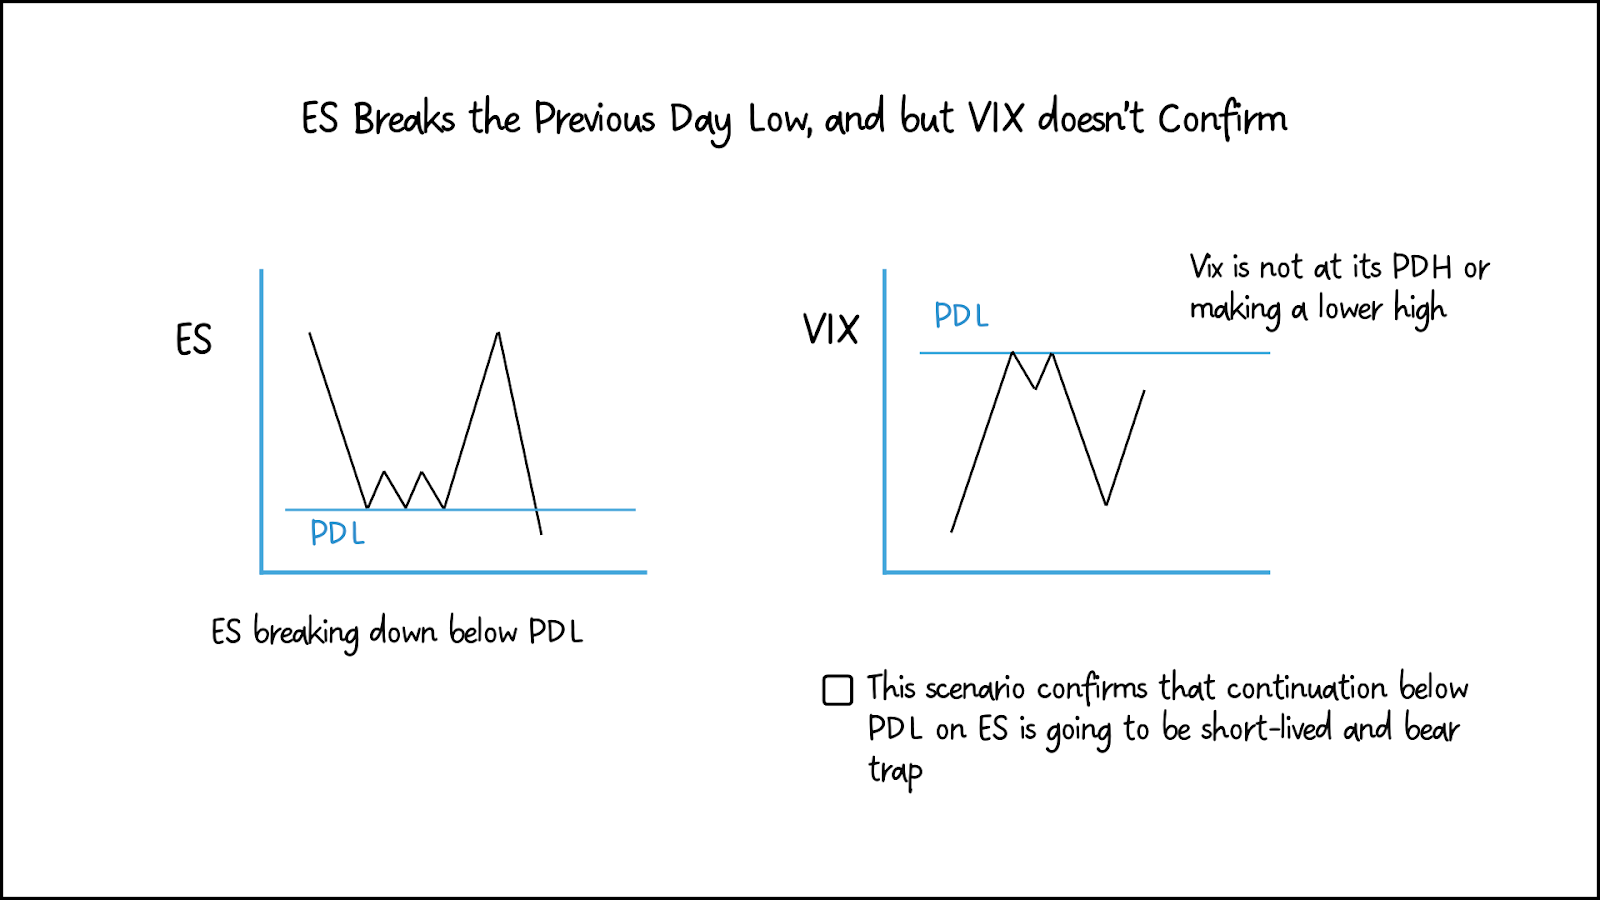
ES Breaks the Previous Day Low, but VIX Does Not Confirm
If ES breaks below the PDL, but the VIX is not doing its part — meaning:
- The VIX is not at its previous day high
- The VIX is making a lower high instead of a higher high
This tells you:
- The pressure is not there
- Institutions are not aggressively hedging
- The breakdown has a good chance of failing
- ES often snaps back above the level, trapping shorts
This is one of the simplest ways to avoid shorting a fake breakdown.
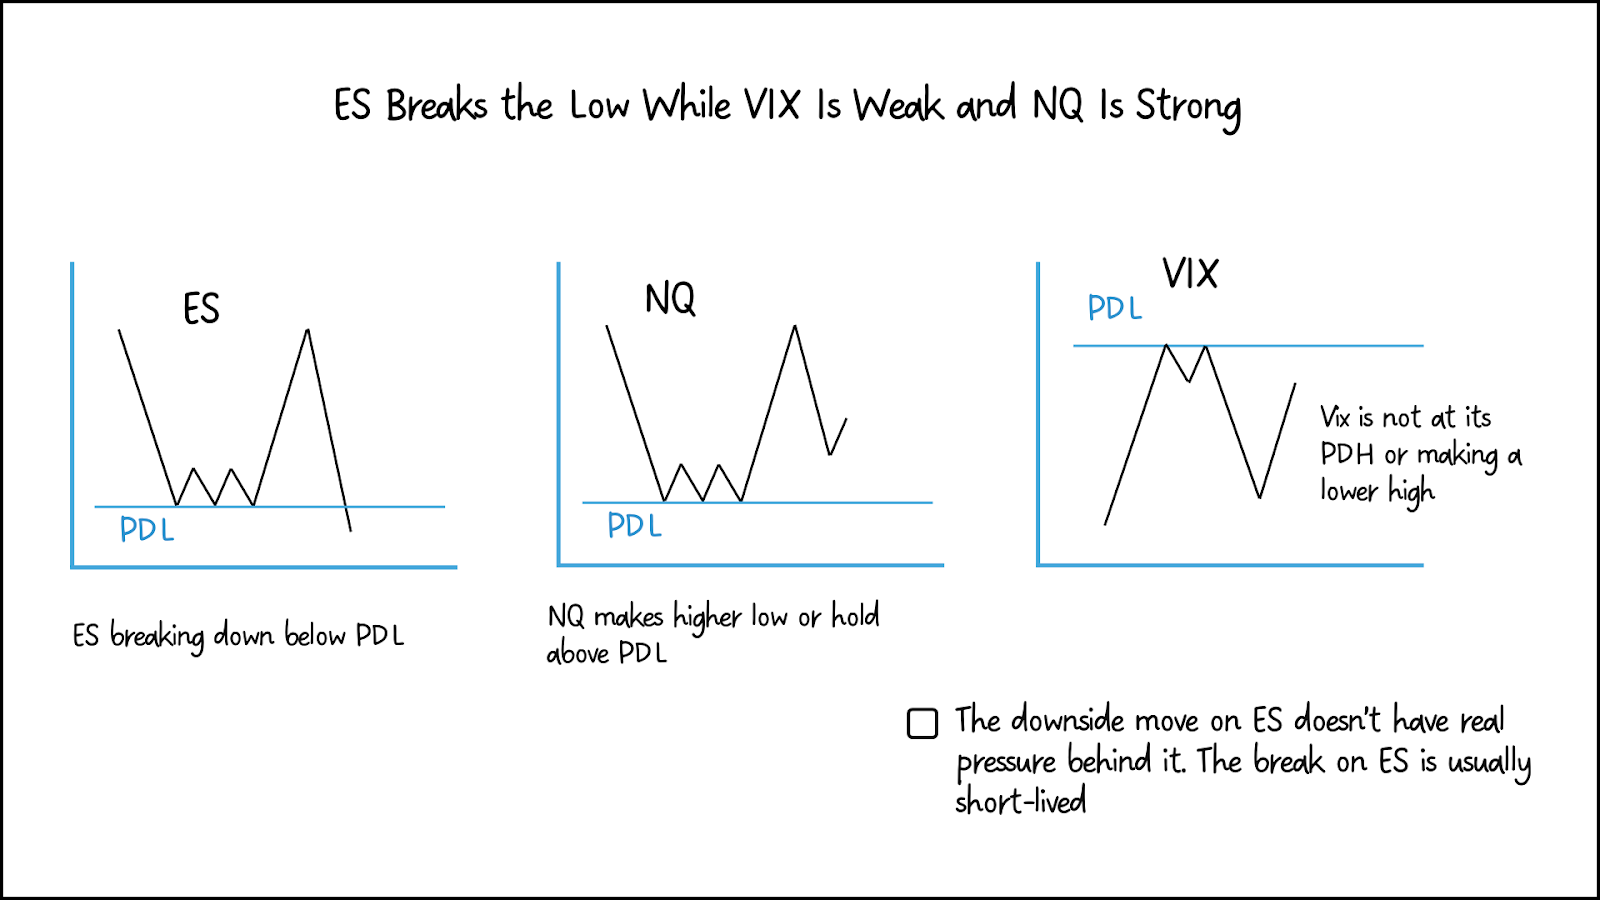
ES Breaks the Low While VIX Is Weak and NQ Is Strong
When ES breaks below the previous day’s low, you want to see the VIX confirming that move.
If it doesn’t, the breakdown is usually weak.
Here’s the simple version:
- ES breaks below the previous day's low
- NQ holds above its own low or makes a higher low
- VIX is weak and not at its previous day's high
What that means:
- The downside move on ES doesn’t have real pressure behind it
- NQ is showing relative strength
- The break on ES is usually short-lived
What ES normally does next:
Once ES gets back above the previous day’s low, it often snaps back up and squeezes higher because the breakdown didn’t have proper confirmation.
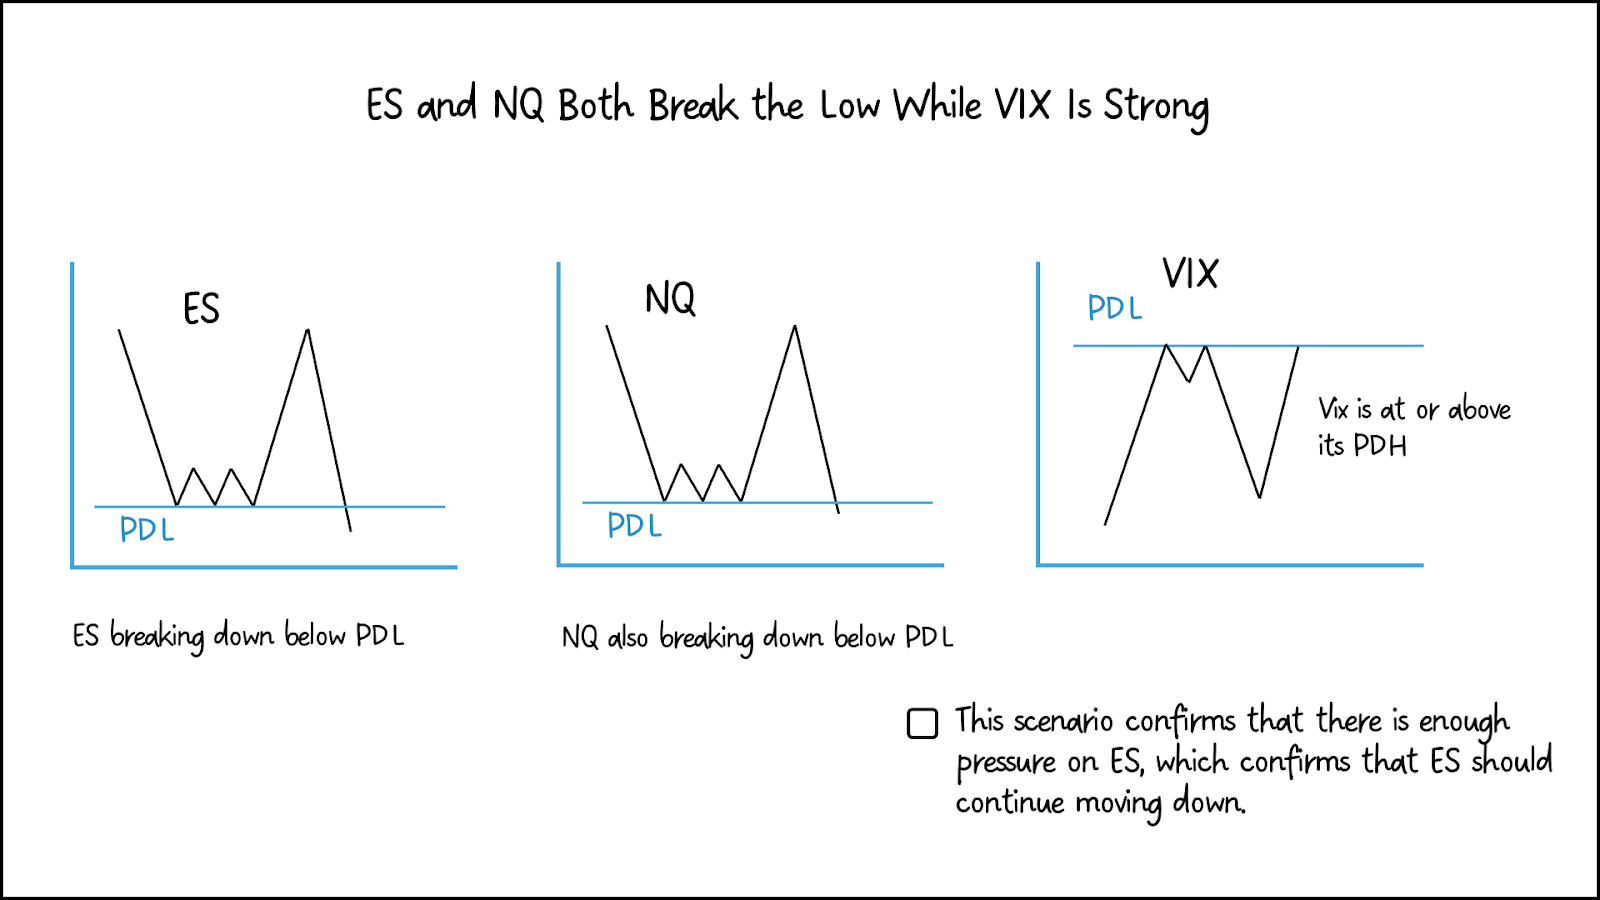
ES and NQ Both Break the Low While VIX Is Strong
When ES breaks below the previous day’s low, the move is only meaningful if the VIX supports it.
If both ES and NQ break their lows and the VIX is strong, the downside usually has real power.
Here’s the simple version:
- ES breaks below the previous day's low
- NQ also breaks below its previous day's low
- VIX is strong and at or above its previous day's high
What that means:
- Put demand is increasing
- Pressure is being put on the market
- Sellers are in control
- The move has a higher chance of continuing lower
What ES normally does next:
ES usually keeps moving down rather than reversing, because everything is moving in sync: ES is weak, NQ is weak, and the VIX is confirming the pressure.
Note: The VIX is priced only from S&P 500 (SPX) options, so it reflects pressure directly on ES, not NQ. NQ is only used as an extra layer of confirmation by showing relative strength or weakness alongside ES.
When the VIX Moves First
Sometimes the VIX reaches its previous day's high before ES or NQ breaks their previous day's lows.
This shows that pressure is building early.
What this means:
- The demand for S&P puts is increasing
- Institutions are expecting near-term turbulence
- Sell programs can start triggering before ES moves
- The VIX is giving a “head start” signal that the downside is coming
Why it matters:
Even if ES hasn’t broken the previous day’s low yet, the rise in the VIX tells you that when it does break, the move has a higher chance of continuing.
This makes VIX a leading indicator in certain moments.
Using VIX Support and Resistance
The VIX reacts to support and resistance the same way any price chart does. When it reaches an important area, ES often reacts at the same time.
When VIX hits support:
- The VIX can bounce
- A bounce adds pressure to ES
- ES tends to struggle or turn lower if it’s near resistance
When VIX hits resistance:
- The VIX can turn down
- Pressure is removed from ES
- ES has an easier time holding support or pushing higher
Pairing VIX support with ES resistance — or VIX resistance with ES support — creates strong turning points
The 1% Rule
A simple rule helps identify when something is “off.”
If ES is up 1% or more and the VIX is also up 1% or more:
- Pressure is rising while ES is rising
- ES strength becomes fragile
- Moves into resistance are more likely to fail
If ES is down 1% or more and the VIX is also down 1% or more:
- Pressure is being removed
- ES weakness is fragile
- Support is more likely to hold
This rule helps avoid chasing extended moves.
The VIX Natural Floor at Major Highs
At all-time highs or major multi-year highs, the VIX often reaches a “natural floor.”
When the VIX gets extremely low:
- Put options become very cheap
- Fund managers hedge more aggressively
- The VIX can rise even if ES is still holding up
Because of this, a rising VIX at all-time highs doesn’t always mean ES is about to break down. Context from ES levels is needed when the market is in uncharted territory.
Pros and Cons of the Strategy
This strategy is designed to deliver high-quality, repeatable setups — but like any trading strategy, there are key things to understand before using it.
Note: The cons listed here aren’t disadvantages. They are things to be aware of — important characteristics that require patience, discipline, and proper management to make the strategy work effectively.
Pros
- Helps identify which side has control
- Makes previous day levels far more meaningful
- Filters out weak breakdowns and fakeouts
- Confirms when a move has real strength
- Works on all timeframes
- Adds clarity to ES/NQ movement
- Offers early warning when pressure is building
Cons
- Requires watching multiple charts
- Needs matching timeframes across ES, NQ, and VIX
- Can give false signals at all-time highs
- Requires some discretion
- Must avoid taking the same trade on multiple instruments
Trade Breakdown
Long VIX Futures at Contract Lows
This setup formed when the VIX reached a key support level at the exact same time the S&P was failing to break out at all-time highs. When those two conditions line up together, the imbalance in pressure creates a clear opportunity.
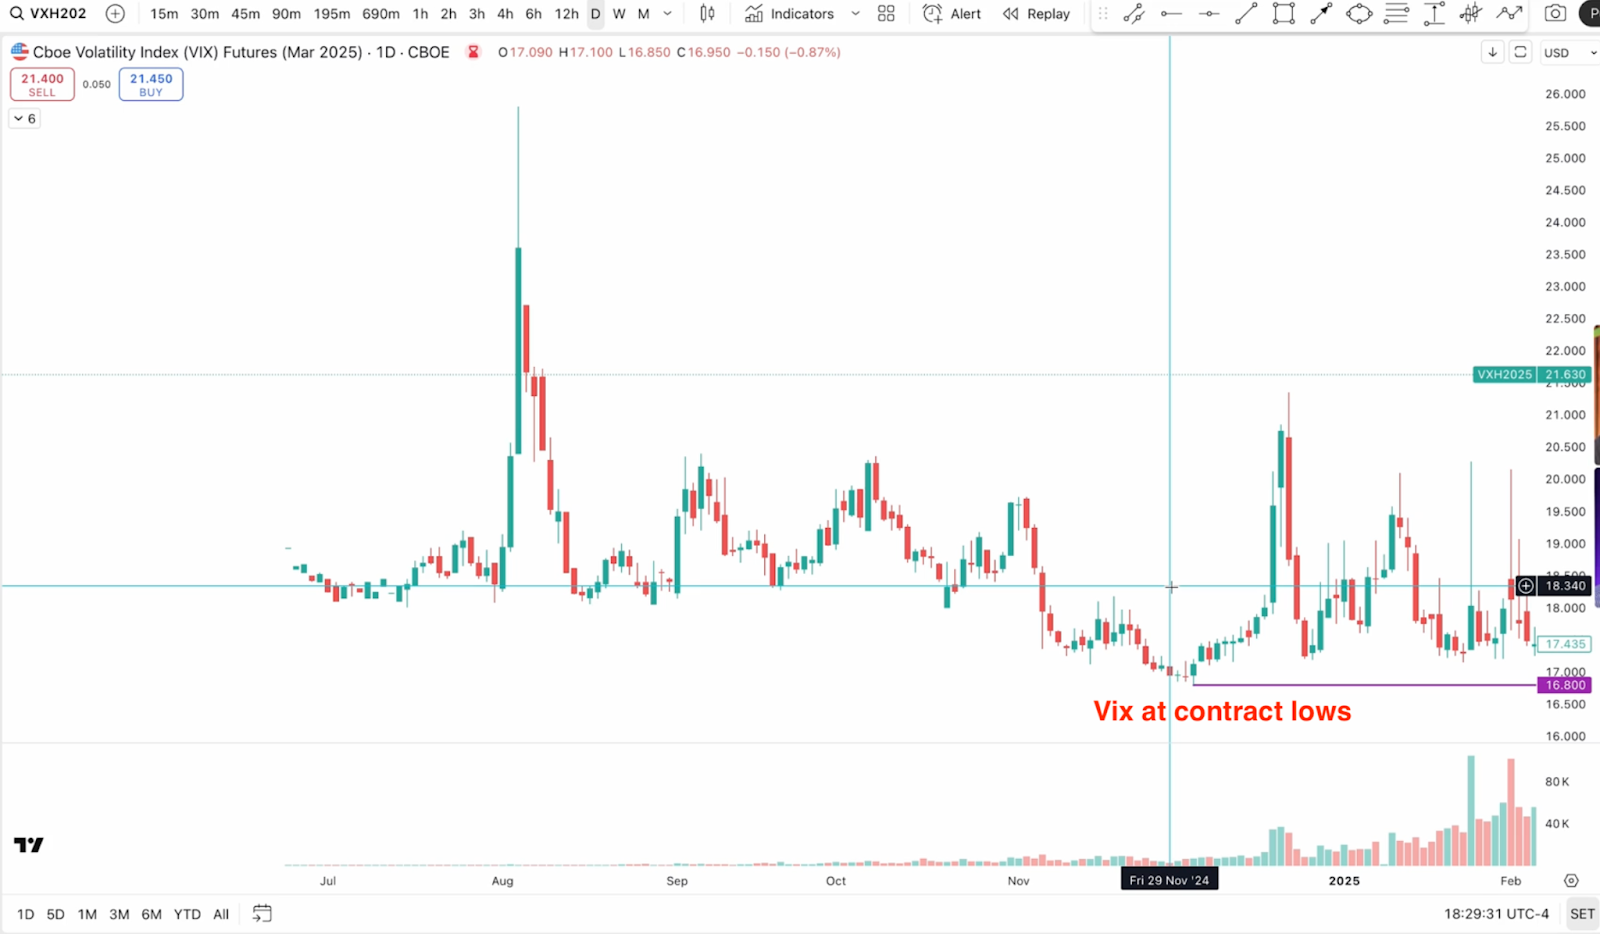
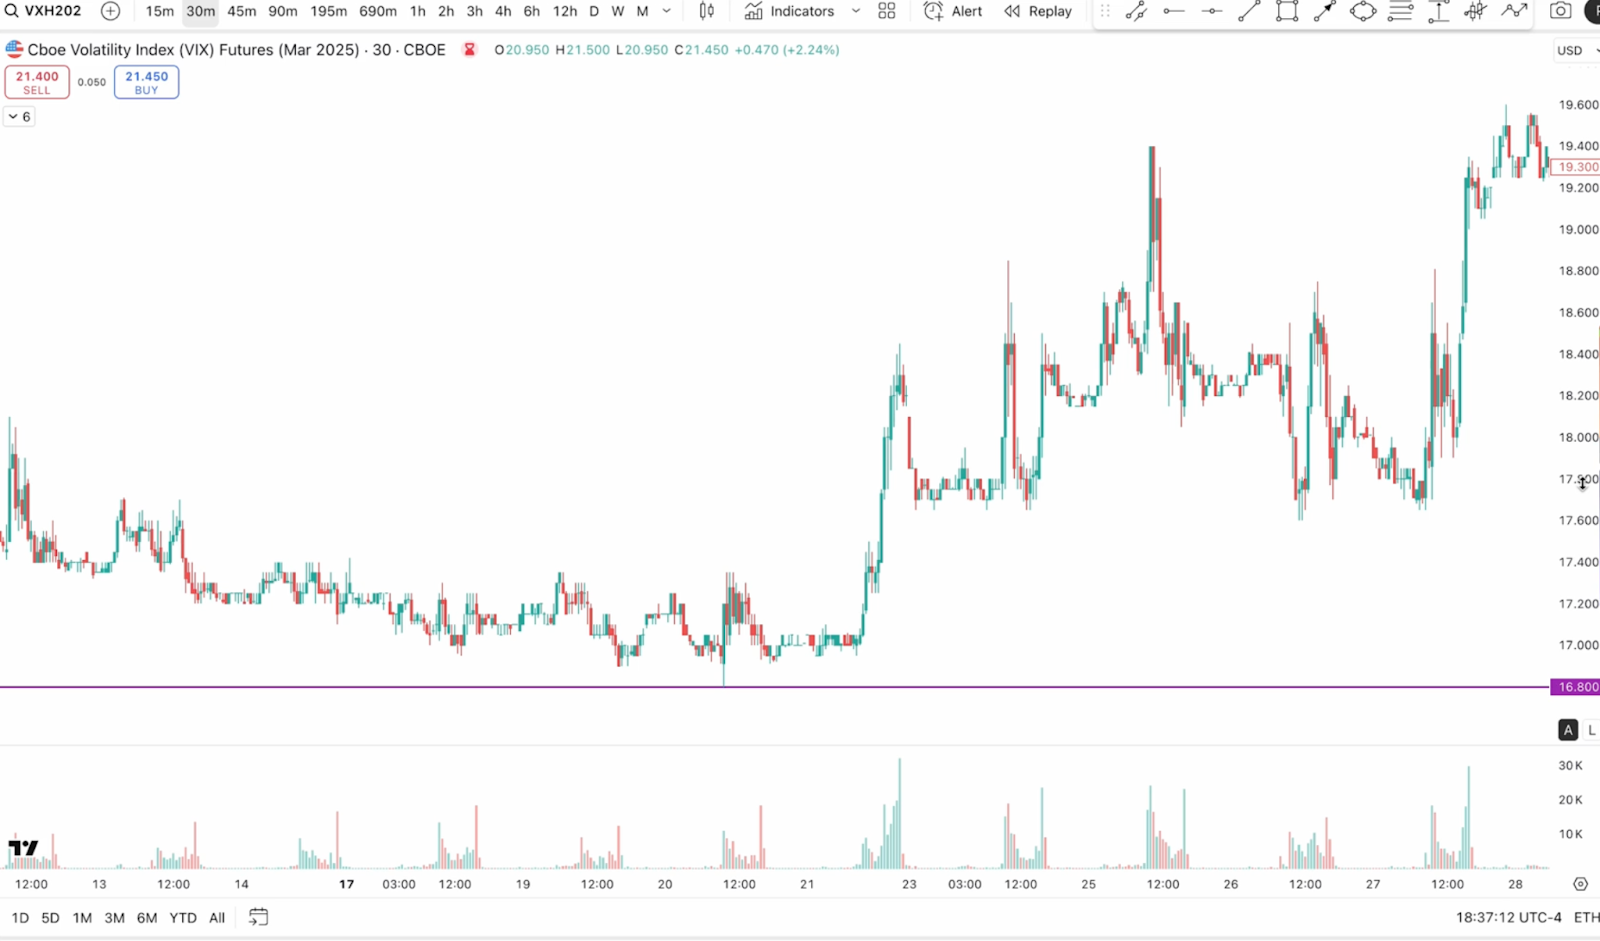
VIX Forms a Double Bottom at Contract Lows
The VIX futures contract had a well-defined contract low near 16.8.
Price returned to this level and formed a double bottom, showing that volatility had likely reached a floor for that contract.
A double bottom at a contract low signals:
- Volatility has limited room to fall
- A bounce in VIX is highly possible
- A bounce would add pressure onto ES
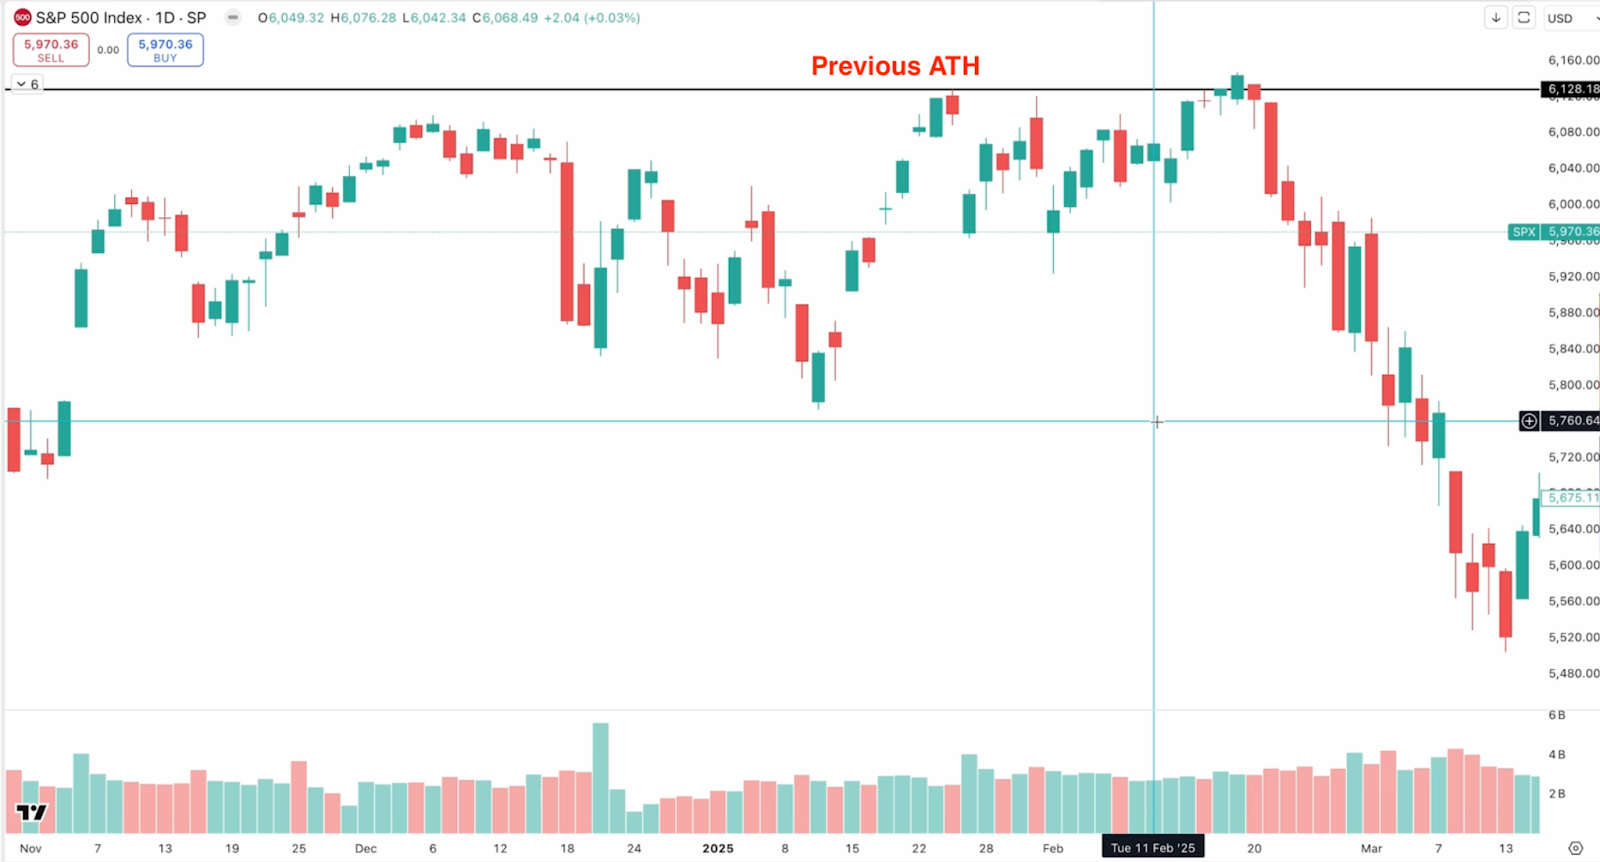
ES Fails a Breakout at All-Time Highs
At the same time, VIX was testing its contract low, ES was struggling to break through its all-time high area.
This failure showed:
- Sellers were active at the highs
- Buyers could not sustain momentum
- If volatility rose, ES would likely pull back
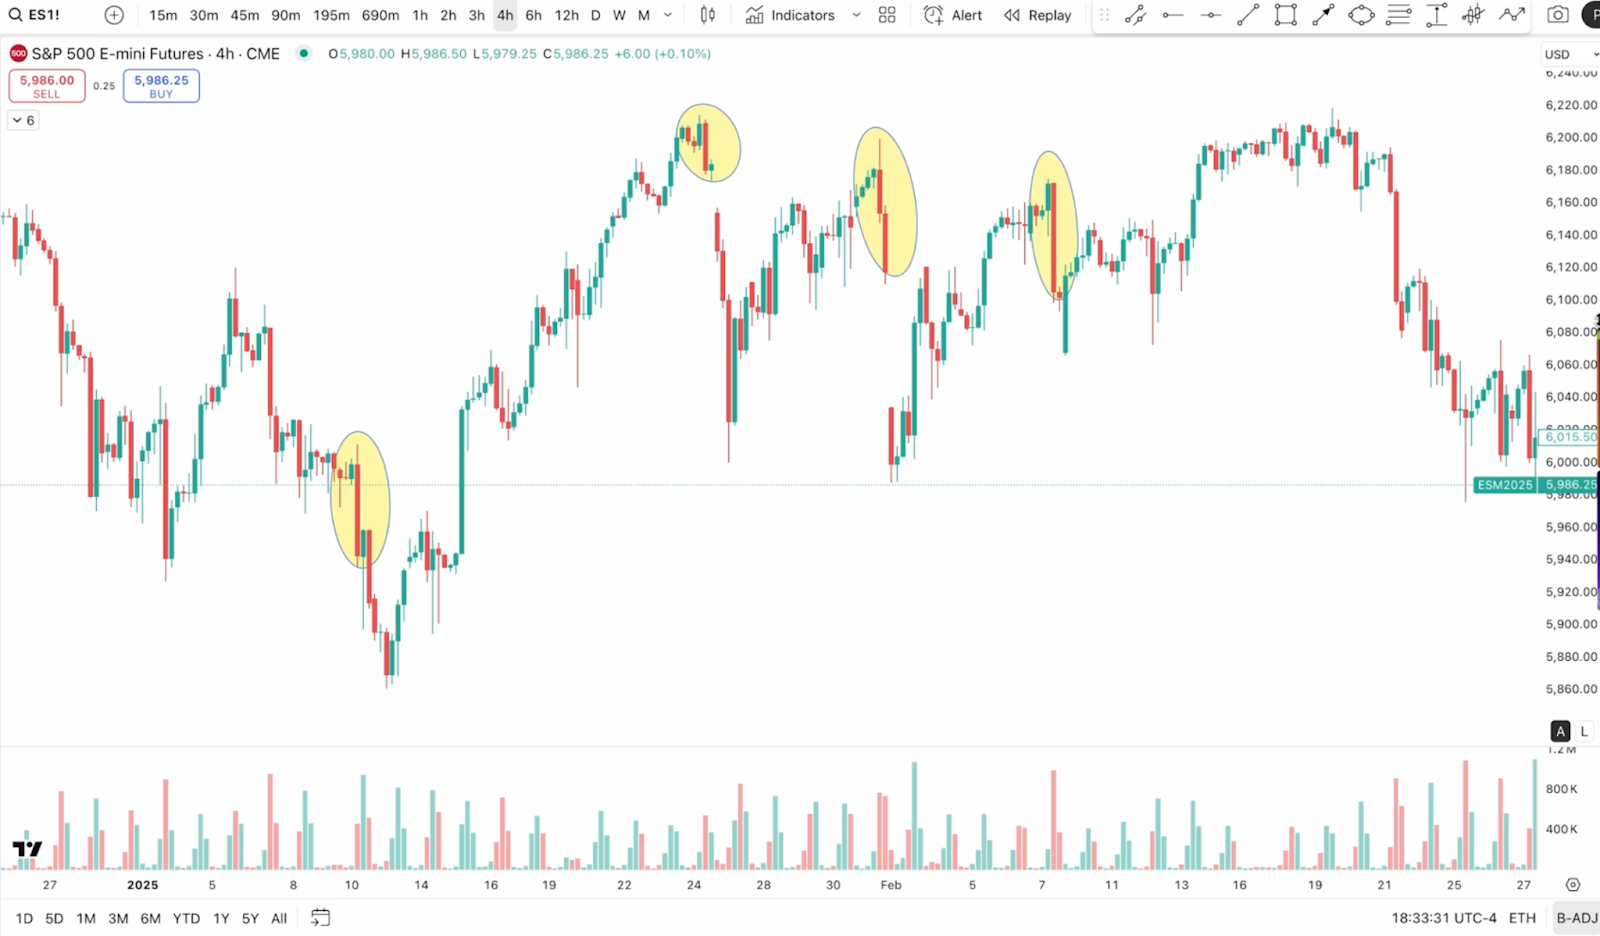
A Recent Pattern Was in Play
There was a recurring pattern in the market at this time: The S&P had sold off on four of the previous five Fridays
The VIX bounce occurred on Thursday, heading directly into another Friday session where selling pressure had been common.
This pattern added helpful context:
- The market had been showing weakness at the end of the week
- A volatility bounce the day before increased the chance ES would struggle again
Why This Setup Was Worth Taking
With:
- VIX forming a double bottom at contract lows
- ES failing at all-time highs
- A recent pattern favoring end-of-week selling
- A clean time-of-day alignment
These conditions created a clear imbalance. A bounce in VIX here would naturally push ES lower.
Combining VIX support and ES resistance created an edge worth putting risk on.
The Result
The long VIX futures trade delivered a 6:1 R outcome.
The core components of the setup:
- VIX bounced strongly from contract lows
- ES rolled over as pressure increased
- The move aligned cleanly with the broader context
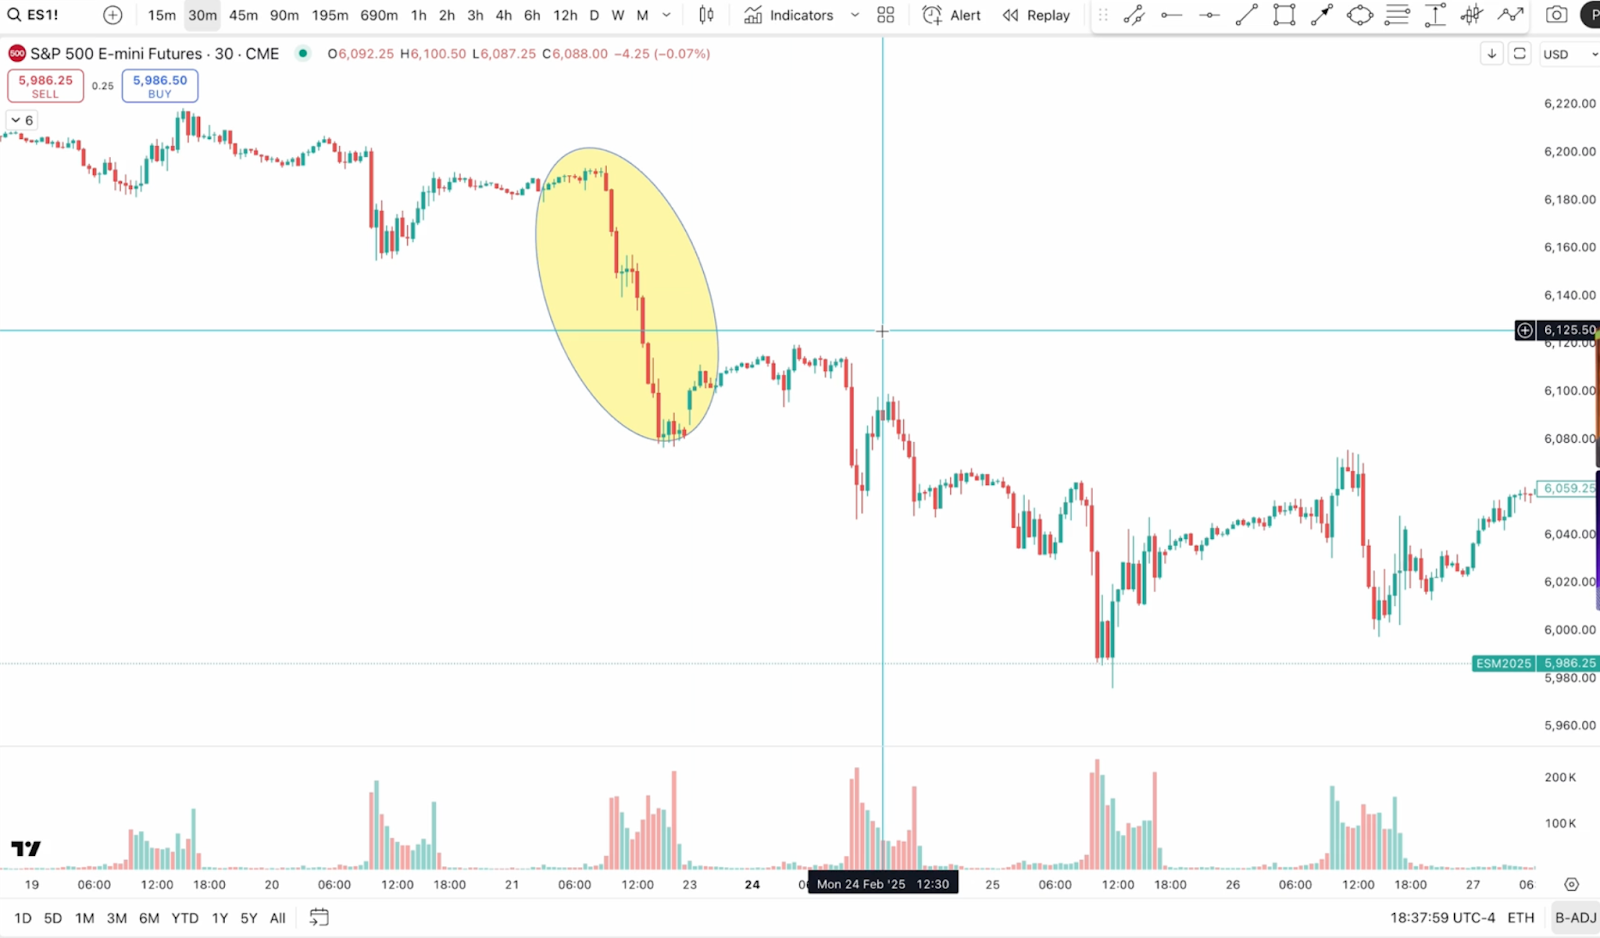
This example shows how powerful the system becomes when VIX support and ES resistance line up together.
How to Backtest This VIX Futures Strategy
The fastest way to test this VIX Futures Strategy is with TradeZella's automated no-code backtesting. Define your rules in plain English, hit run, and TradeZella runs them across 11+ years of historical data in seconds, then shows you every individual trade along with your win rate, profit factor, and expectancy instantly, without you stepping through a single chart. It is the quickest way to see whether the setup holds up before you risk a dollar.
You can also test it manually by replaying the market bar by bar. Load 11+ years of historical data, set up ES, NQ, and the VIX side by side on multiple charts the way you trade live, and replay the session bar by bar. Mark the previous day highs and lows on all three, then watch how the VIX behaves at the exact moment ES or NQ tests a key level: a break of the previous day low with the VIX rising at or above its own prior high confirms downside, while a weak VIX or a relatively strong NQ warns of a fake breakdown and a likely snap-back squeeze. Apply the 1% rule and VIX support and resistance for context, take the trade only when the pieces align, and define risk against the invalidation level. Use automatic position sizing and drag your stop and target directly on the chart. Every backtested trade gets logged automatically with your entry, exit, position size, and P&L. Tag confirmed breaks versus failed-breakdown squeezes so you can compare them, add notes, and review the same way you would a live trade. After 30 to 50 trades, you can see your win rate, profit factor, and expectancy on this specific setup. Manual replay is the best way to build screen time and a real feel for the setup.
When you start trading live, import your live trades into TradeZella, the AI trading journal that does the journaling for you. Your backtest results and live results live in the same platform, so you always know how the strategy performs in testing vs how it performs with real money, without switching between tools or maintaining separate spreadsheets.
Start Backtesting This Strategy Using TradeZella
Frequently Asked Questions
What is the VIX Futures Strategy?
The VIX Futures Strategy is a volatility-based futures approach built around the relationship between the VIX, ES, and NQ. The VIX shows whether there is pressure on the S&P 500: when pressure rises, ES struggles, and when it falls, ES can push higher. By watching what the VIX is doing when ES or NQ tests a key level, you can tell whether a move has real power or is likely to fail, which makes it a reliable confirmation layer for timing continuations and reversal squeezes.
What does the VIX measure and how does it affect ES and NQ?
The VIX is a real-time measure of expected S&P 500 volatility over the next 30 days, calculated mainly from SPX put demand. More put demand means more fear, so the VIX rises and adds pressure to ES; less put demand means the VIX falls and removes pressure. Because roughly 90% of ES volume is algorithmic, a rising VIX triggers sell programs and a falling VIX triggers buy programs. A useful analogy: when the VIX is low, ES climbs the mountain with no weight, and when the VIX is high, it climbs with a heavy backpack and rallies fail more easily.
How do you use previous day levels with the VIX?
You compare ES or NQ breaking the previous day high or low against where the VIX sits relative to its own previous day levels. If ES breaks the previous day low while the VIX is rising at or above its prior high, put demand is increasing and the downside has real strength. If ES breaks the low but the VIX is making a lower high or is not at its prior high, the pressure is not there, and the breakdown often fails and snaps back, trapping shorts. The strongest downside comes when ES and NQ both break their lows and the VIX is strong.
What is the 1% Rule?
The 1% Rule flags when something is off. If ES is up 1% or more and the VIX is also up 1% or more, pressure is rising while ES rises, so the strength is fragile and moves into resistance are more likely to fail. If ES is down 1% or more and the VIX is also down 1% or more, pressure is being removed, so the weakness is fragile and support is more likely to hold. It helps you avoid chasing extended moves.
What instruments does this strategy use, and how is NQ used?
The strategy is traded on index futures, primarily ES, with the VIX as the pressure gauge and NQ as an extra confirmation layer. Because the VIX is priced only from S&P 500 options, it reflects pressure directly on ES, not NQ. NQ is used to read relative strength or weakness alongside ES, for example a breakdown on ES looks weak if NQ holds above its own low or makes a higher low. The strategy also works across timeframes and can use VIX support and resistance and the VIX natural floor at all-time highs for context.
Can I backtest the VIX Futures Strategy?
Yes. You can test this strategy using TradeZella's backtesting with 11+ years of historical data. Set ES, NQ, and the VIX side by side, mark the previous day levels on each, and replay the session to see whether the VIX confirms or rejects each ES or NQ break before taking the trade. Every trade logs automatically with entry, exit, position size, and P&L, and you can tag confirmed breaks versus failed-breakdown squeezes to see which produce your edge. After 30 to 50 trades you can see your win rate, profit factor, and expectancy before risking real money.
What is TradeZella backtesting?
TradeZella backtesting lets you test a trading strategy against 11+ years of historical market data across forex, futures, stocks, and crypto, down to seconds-level timeframes. You can do it two ways. Replay the market bar by bar and place trades as if you were trading live, with your own timeframes, automatic position sizing, and stops and targets you drag right on the chart, and every trade logs automatically with entry, exit, size, and P&L. Or use automated no-code backtesting: define your strategy rules in plain English and the engine runs them across years of data in seconds, returning every individual trade it took with the exact setup drawn on the chart, so you see why each trade fired instead of just an equity curve. Zella AI then analyzes the results and flags what to fix.