


Built For
Instruments: Stocks
Trading Style: Day Trading
Strategy Overview
This strategy focuses on one specific moment in the market, when a strong move becomes unsustainable and starts to collapse.
When a stock moves up quickly, it begins to attract attention. Early buyers get in first, then momentum traders follow, and eventually late buyers enter because they don’t want to miss out. At that point, the trade becomes crowded. Most of the demand has already entered the market.
The trend may still look strong, but it is no longer being driven by new buyers. It is being held up by existing participants, and that makes it fragile.
The goal of this strategy is to recognize when a parabolic move is reaching its final stage, wait for clear confirmation instead of guessing the top, and then either exit long positions into strength or enter short with a defined setup.
The move that follows is usually fast and happens within the same day.
This is not something that appears every day. It requires patience. But when everything aligns, it tends to produce very high-probability opportunities.
What Is a Parabolic Exhaustion Move
A parabolic exhaustion move is the final phase of an aggressive uptrend, where price starts accelerating quickly and often moves almost vertically before reversing.
This is not a slow-topping process. It is a sudden shift.
Leading into this phase, price moves faster, candles become larger, and gaps may appear. Traders are no longer entering carefully; they are chasing the move.
Volume increases, and more participants are involved than at any earlier stage. The trade becomes crowded. At this point, there are very few new buyers left. Most of the demand has already been used. Because of that, even a small amount of selling can push the price lower very quickly.
This happens because of how markets behave. As price rises, more people buy. As more people buy, the price goes higher. This attracts even more buyers. This continues until almost everyone is already in the trade.
Once that happens, it only takes a small trigger for the move to collapse.
The quantum computing stocks in late 2024 are a good example. They had already made strong moves, and when negative news came out, they dropped immediately. The pressure was already there — the news only triggered the move.
The Three Core Components
Every valid setup is built on three things working together.
First, the stock must have already made a strong move from a recent base. This is what creates the crowded condition.
Second, the way the move happened must show acceleration. It should not be slow and controlled. It should show urgency, with strong candles and fast movement.
Third, there must be an exhaustion day. This is the day when the price stops going up, loses strength, and begins to break down. The strategy focuses on capturing that moment, not predicting it.
If any of these are missing, the setup is not valid.
Filter 1: Size of the Move
The first step is making sure the stock has moved enough to be considered extended.
This depends on the size of the company.
Smaller companies move more aggressively, so they need a larger percentage move. Larger companies move more slowly, so smaller moves can still be significant.
A small-cap stock generally needs to move around 200 percent or more from its last base. A mid-cap stock usually requires around 100 percent. A large-cap stock can qualify with a move closer to 50 percent.
The move should always be measured from the most recent base, not the absolute bottom. A simple way to find this base is the last time price touched the 20-day moving average before the strong move began.
When the move is much larger than these levels, it enters what can be considered an extreme zone. In those cases, the probability of a sharp reversal increases, and the move down can be more aggressive.
Filter 2: Structure of the Move
After confirming the size of the move, the next step is to understand how the move developed.
Some stocks move up slowly with small candles. These trends are controlled, and traders have time to enter and exit. These do not create strong exhaustion setups.
Other stocks move up but include regular pullbacks. These pullbacks release pressure, which reduces the chance of a sharp reversal.
The type of move you want to see is different.
The best setups happen when the move becomes aggressive. Price starts accelerating, candles become large, and the slope becomes steep. In some cases, there are gaps between sessions. This creates urgency and traps traders.
Often, the strongest setups come from a combination of both conditions. A stock may move up gradually for some time, and then suddenly shift into a fast, aggressive phase. This traps both early buyers and late chasers at the same time.
Additional Signs That Strengthen the Setup
There are a few extra signs that can make the setup stronger.
One is volume. When volume reaches the highest levels seen in recent history, it often means the final wave of buyers has entered the trade. At that point, the market is saturated.
Another is psychological price levels. Round numbers like 100, 300, or 500 attract attention. When price reaches these levels for the first time after a strong move, it often triggers reactions from traders.
These are not required, but when they are present, the setup becomes stronger.
Types of Stocks
Different types of stocks behave differently during exhaustion.
Strong, well-known stocks that have been trending for a long time usually produce smaller but still meaningful drops. These are often around 10 to 20 percent, and sometimes more if the move was extreme.
Stocks driven by hype or strong themes tend to drop faster and more aggressively. These can move 20 to 40 percent or more in a single day.
Newly listed stocks, or IPOs, can also produce sharp moves. These are less predictable, but they often fall somewhere in between.
The Exhaustion Day
Even when everything else is in place, the trade is not valid until the exhaustion day appears.
This is identified by a clear change in behavior.
Price stops making higher highs. Lower highs begin to form, followed by lower lows. The trend that looked strong starts to fail.
VWAP becomes the key level to watch.
On a true exhaustion day, price moves below VWAP and is unable to reclaim it. Sometimes price will move back toward VWAP briefly, but the move is weak and gets rejected. This rejection confirms that buyers are no longer in control.
If the price stays above VWAP and continues higher, the setup is not active.
Timing the Trade
This setup only exists within a short window.
The exhaustion day usually happens on the same day as the final push higher, or the following day. If nothing happens within two days, the setup should be ignored.
This prevents forcing trades when the trend is still strong.
Entry Execution
Entries are based on confirmation.
The first type of entry comes when price breaks its upward structure and starts forming lower highs and lower lows. This is earlier and carries more risk.
A stronger entry happens when the price breaks the structure and loses VWAP at the same time. This shows that the shift is more meaningful.
The best entry occurs when the price tries to move back above VWAP and fails. This confirms that buyers cannot regain control and usually leads to the next move lower.
If price reclaims VWAP strongly and continues higher, the setup is no longer valid.
Managing Risk
Risk should always be controlled.
A common stop level is the high of the day or the most recent lower high. If price breaks that level, the setup has failed.
Partial profits should be taken once the trade moves in your favor. After that, the stop can be moved to break-even.
The trade should be closed before the end of the day. Holding overnight increases risk and is not part of the strategy.
If the setup fails once, a second attempt can be taken. If it fails again, it is best to move on.
The Risk-Free Add
After taking partial profits and moving the stop to break-even, the remaining position is protected.
At this point, if price returns to VWAP and fails again, additional size can be added.
Because the stop is already at break-even, the added position does not increase overall risk. If the trade fails, earlier profits cover the loss. If it works, the position is larger during the strongest part of the move.
Expected Move
Before entering any trade, it is important to estimate how much the stock can realistically move.
Stronger, more stable stocks usually move around 10 to 20 percent. More volatile or hype-driven stocks can move 20 to 40 percent or more. IPOs often fall somewhere in between.
If a large part of the move has already happened, for example after a big gap down, the trade may no longer be worth taking.
Trade Breakdown
Trade Example: SMCI
SMCI was a strong AI stock that had been trending higher for a long time before accelerating sharply in early 2024.
The move met all the conditions. It had a strong prior move, large expansion candles, high volume, and was approaching a key level.
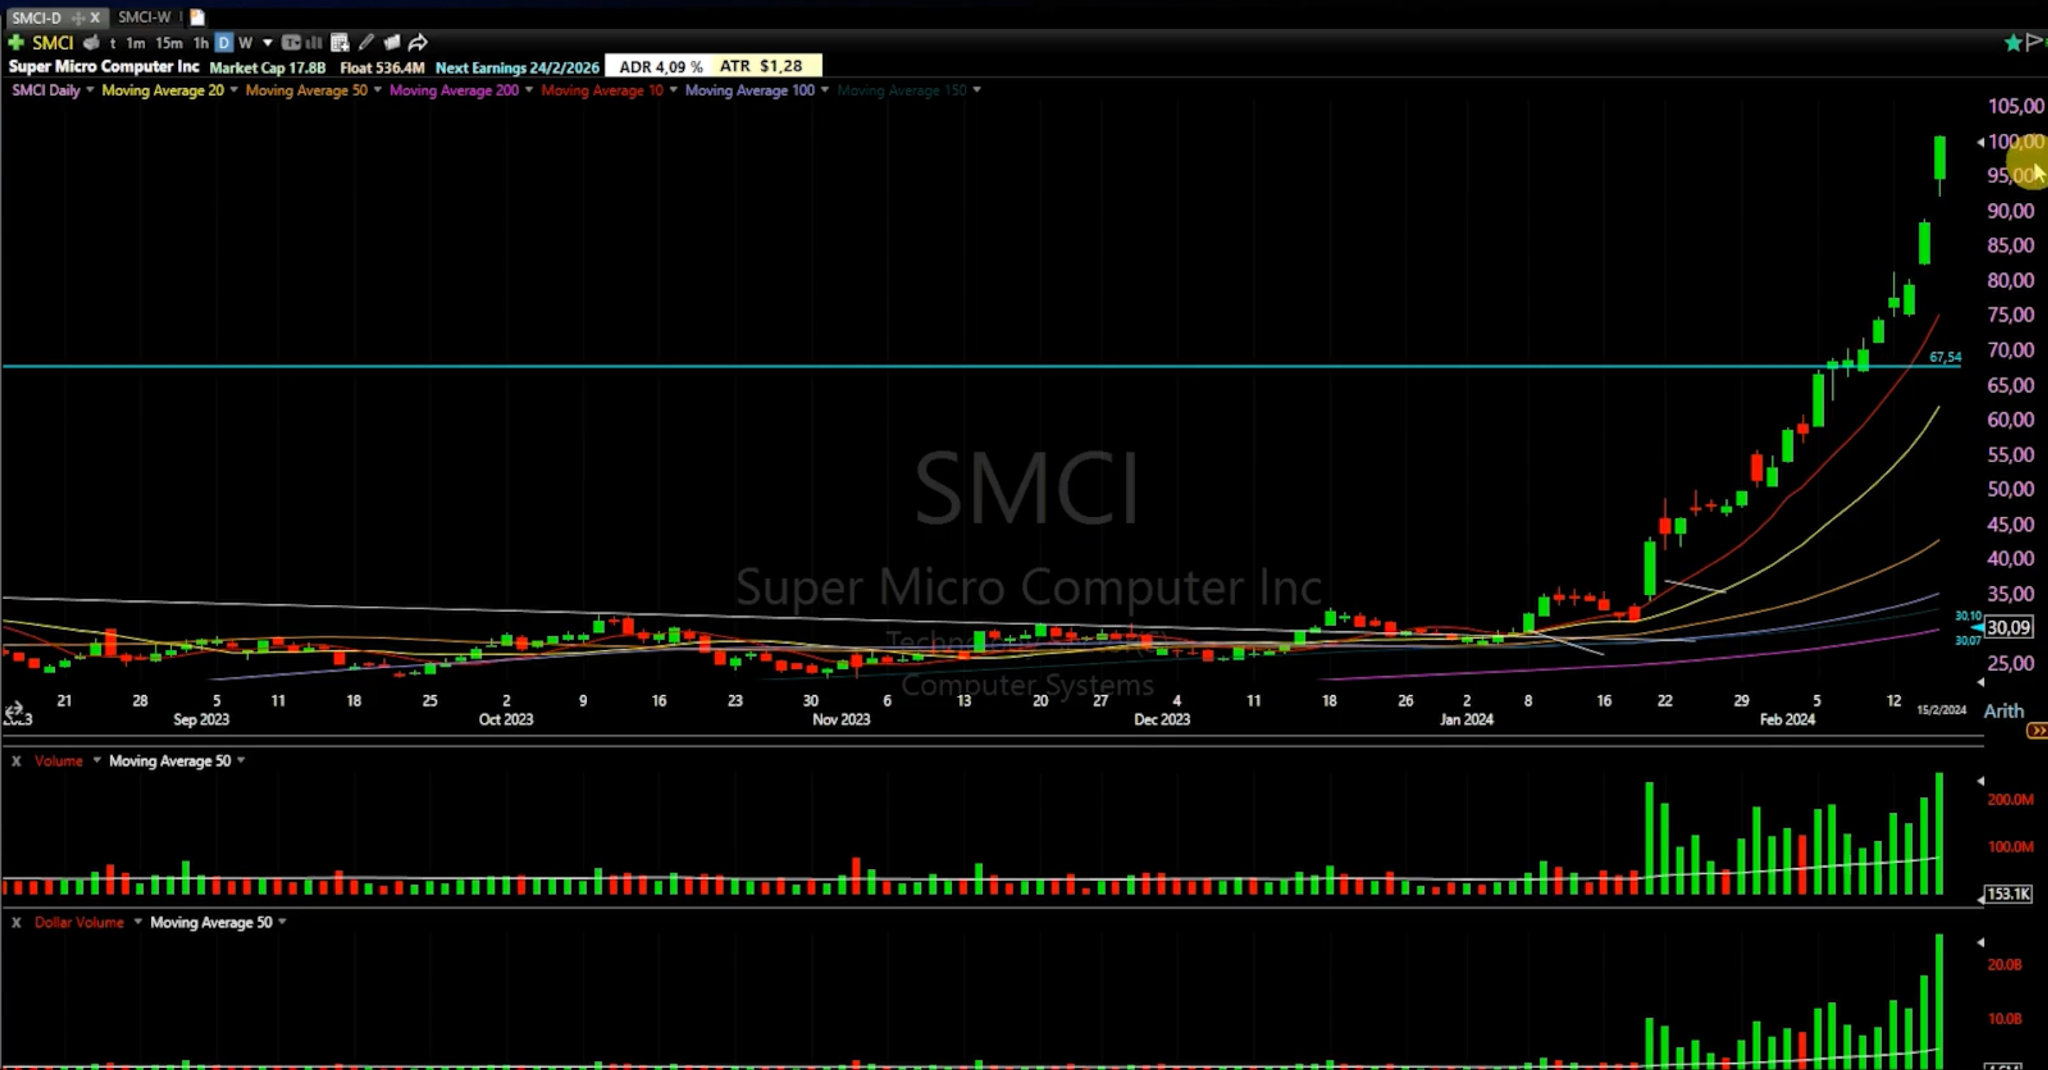
On the exhaustion day, price began to show weakness early. It formed lower highs, moved below VWAP, and then tried to reclaim it. That move failed.
The short entry was taken at the VWAP rejection, with the stop placed at the high of the day.
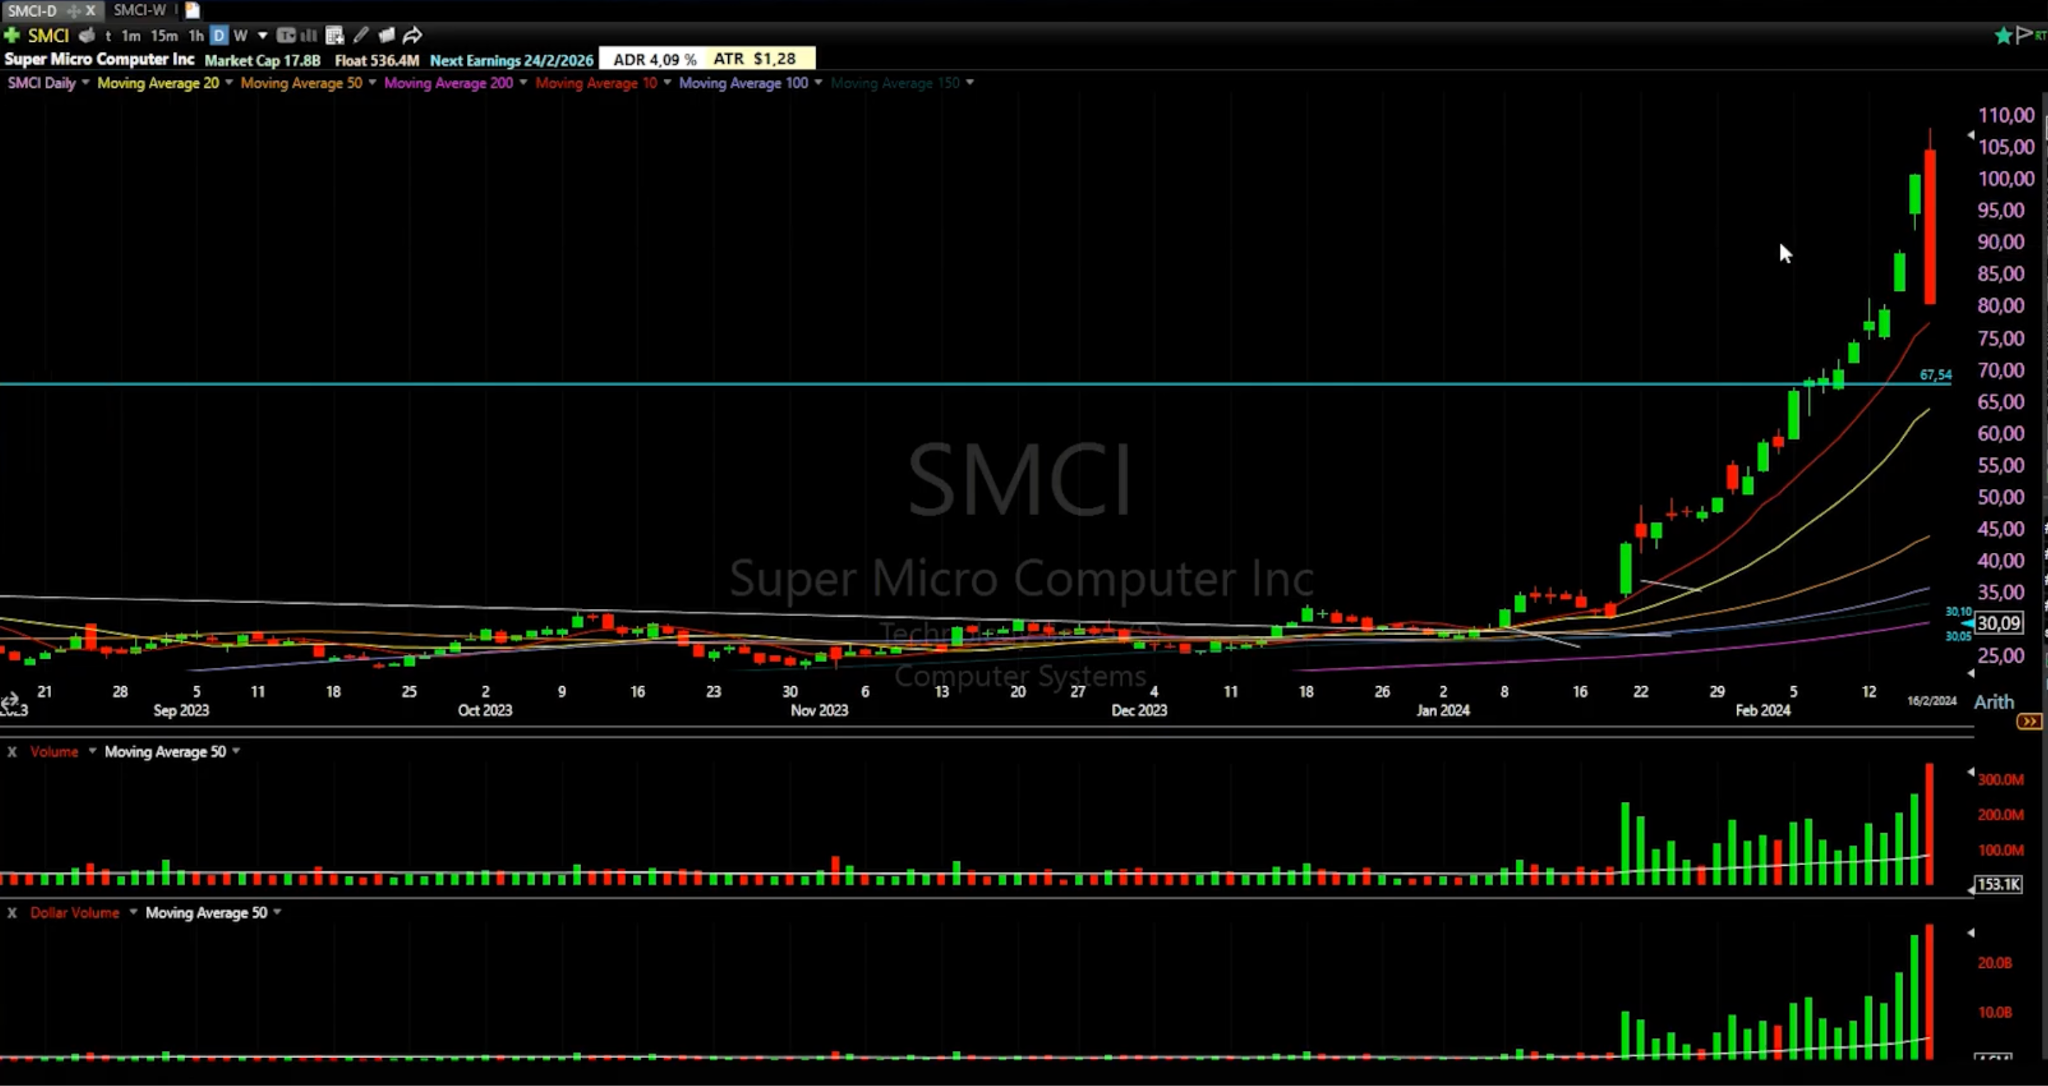
The stock dropped around 23 to 24 percent in a single day, which was in line with expectations. That day also marked the end of the larger uptrend.
How to Backtest This Parabolic Short Strategy
You can test this Parabolic Short Strategy before risking real money using TradeZella's backtesting. Load 11+ years of historical data, set up your chart with VWAP and the 20-day moving average the way you trade live, and replay sessions bar by bar. Confirm the three core components: a strong prior move from the recent base, accelerating structure with large expansion candles, and an exhaustion day. Measure the move from the last touch of the 20-day moving average and check it clears the size filter for the stock's market cap, then wait for the exhaustion day where price loses VWAP and fails to reclaim it. Enter on the VWAP rejection, place your stop at the high of the day or the most recent lower high, take partials, and use the risk-free add if price fails VWAP again. Close before the end of the day, since the strategy does not hold overnight. Use automatic position sizing and drag your stop and target directly on the chart. Every backtested trade gets logged automatically with your entry, exit, position size, and P&L. Tag setups by stock type and how many filters aligned, add notes, and review the same way you would a live trade. After 30 to 50 trades, you can see your win rate, profit factor, and expectancy on this specific setup, giving you a real picture of how it is likely to perform in live market conditions before you risk a dollar.
When you start trading live, import your live trades into TradeZella, the AI trading journal that does the journaling for you. Your backtest results and live results live in the same platform, so you always know how the strategy performs in testing vs how it performs with real money, without switching between tools or maintaining separate spreadsheets.
TradeZella is also introducing automated no-code backtesting, where you define your rules and run the backtest, and then it shows you how the strategy would have performed over years of historical data without you needing to step through a single chart.
Start Backtesting This Strategy Using TradeZella
Frequently Asked Questions
What is the Parabolic Short Strategy?
The Parabolic Short Strategy is a rules-based framework for trading the exhaustion top of parabolic moves. It targets the single day when a stock runs out of buyers and collapses sharply. As a stock accelerates, early buyers, momentum traders, and late chasers all pile in until the trade is crowded and held up by existing participants rather than new demand, which makes it fragile. The goal is to recognize that final stage, wait for confirmation instead of guessing the top, then exit longs into strength or enter short, with the move that follows usually fast and same-day.
What is a parabolic exhaustion move?
A parabolic exhaustion move is the final phase of an aggressive uptrend, where price accelerates quickly and often moves almost vertically before reversing. It is a sudden shift, not a slow top. Candles get larger, gaps may appear, volume rises, and traders chase rather than enter carefully, so the trade becomes crowded with very few new buyers left. Because most demand is already used, even a small amount of selling can push price lower fast, and a minor trigger like negative news can collapse the move since the pressure was already there.
What are the three core components?
Every valid setup needs three things together. First, a strong prior move from a recent base, which creates the crowded condition. Second, acceleration in how the move happened, with urgency, strong candles, and fast movement rather than slow and controlled action. Third, an exhaustion day, when price stops going up, loses strength, and begins to break down. The strategy focuses on capturing that exhaustion day rather than predicting it, and if any of the three components is missing, the setup is not valid.
How big does the move need to be?
The size filter depends on market cap, measured from the most recent base, the last time price touched the 20-day moving average before the run. A small-cap stock generally needs to move around 200% or more, a mid-cap around 100%, and a large-cap closer to 50%. When the move is much larger than these levels, it enters an extreme zone where the probability of a sharp reversal rises and the drop can be more aggressive. Highest-ever volume and first-time tests of round numbers like 100, 300, or 500 strengthen the setup further.
What is the exhaustion day and how do you enter?
The exhaustion day is when behavior clearly changes: price stops making higher highs, lower highs and lower lows form, and the trend that looked strong starts to fail. VWAP is the key level, and on a true exhaustion day price moves below VWAP and cannot reclaim it. The earliest entry is the break of upward structure, a stronger entry is the break of structure plus losing VWAP, and the best entry is when price tries to reclaim VWAP and fails. The setup only exists within a short window, the same day or the next, and you exit before the close rather than holding overnight.
Can I backtest the Parabolic Short Strategy?
Yes. You can test this strategy using TradeZella's backtesting with 11+ years of historical data. Replay sessions bar by bar, confirm the prior move, acceleration, and size filter from the 20-day moving average base, then wait for the exhaustion day and short the VWAP rejection with the stop at the high of day. Every trade logs automatically with entry, exit, position size, and P&L, and you can tag setups by stock type and filter alignment. After 30 to 50 trades you can see your win rate, profit factor, and expectancy before risking real money.
What is TradeZella backtesting?
TradeZella backtesting lets you replay 11+ years of historical market data across forex, futures, stocks, and crypto and place trades as if you were trading live. Set up your timeframes the way you trade, use automatic position sizing, drag your stop and target directly on the chart, and every trade gets logged automatically with your entry, exit, position size, and P&L. TradeZella is also introducing automated no-code backtesting, where you define your strategy rules in plain English and the engine runs them across years of historical data, showing every individual trade executed with the results without you needing to do anything.