Expectancy in Trading: The Metric That Actually Predicts Profitability
Expectancy in Trading: The Metric That Actually Predicts Profitability
Expectancy is the average amount you make or lose per trade, and it's the single best predictor of whether a strategy is profitable over time. Learn the formula, see how three real setups compare, and find out which of your strategies to keep and which to cut.
class SampleComponent extends React.Component {
  // using the experimental public class field syntax below. We can also attach
  // the contextType to the current class
  static contextType = ColorContext;
  render() {
    return <Button color={this.color} />
  }
}
Last Updated: March 26, 2026
Trading expectancy is the one metric that tells you whether your strategy makes money before you've traded it long enough to be sure. Not win rate. Not profit factor. Expectancy. Specifically: the average amount you make (or lose) per dollar risked, per trade, across your entire sample
A positive expectancy means that over enough trades, your strategy makes money. A negative expectancy means it doesn't, no matter how good any individual week looks. Most traders never calculate it. The ones who do stop guessing about whether their edge is real.
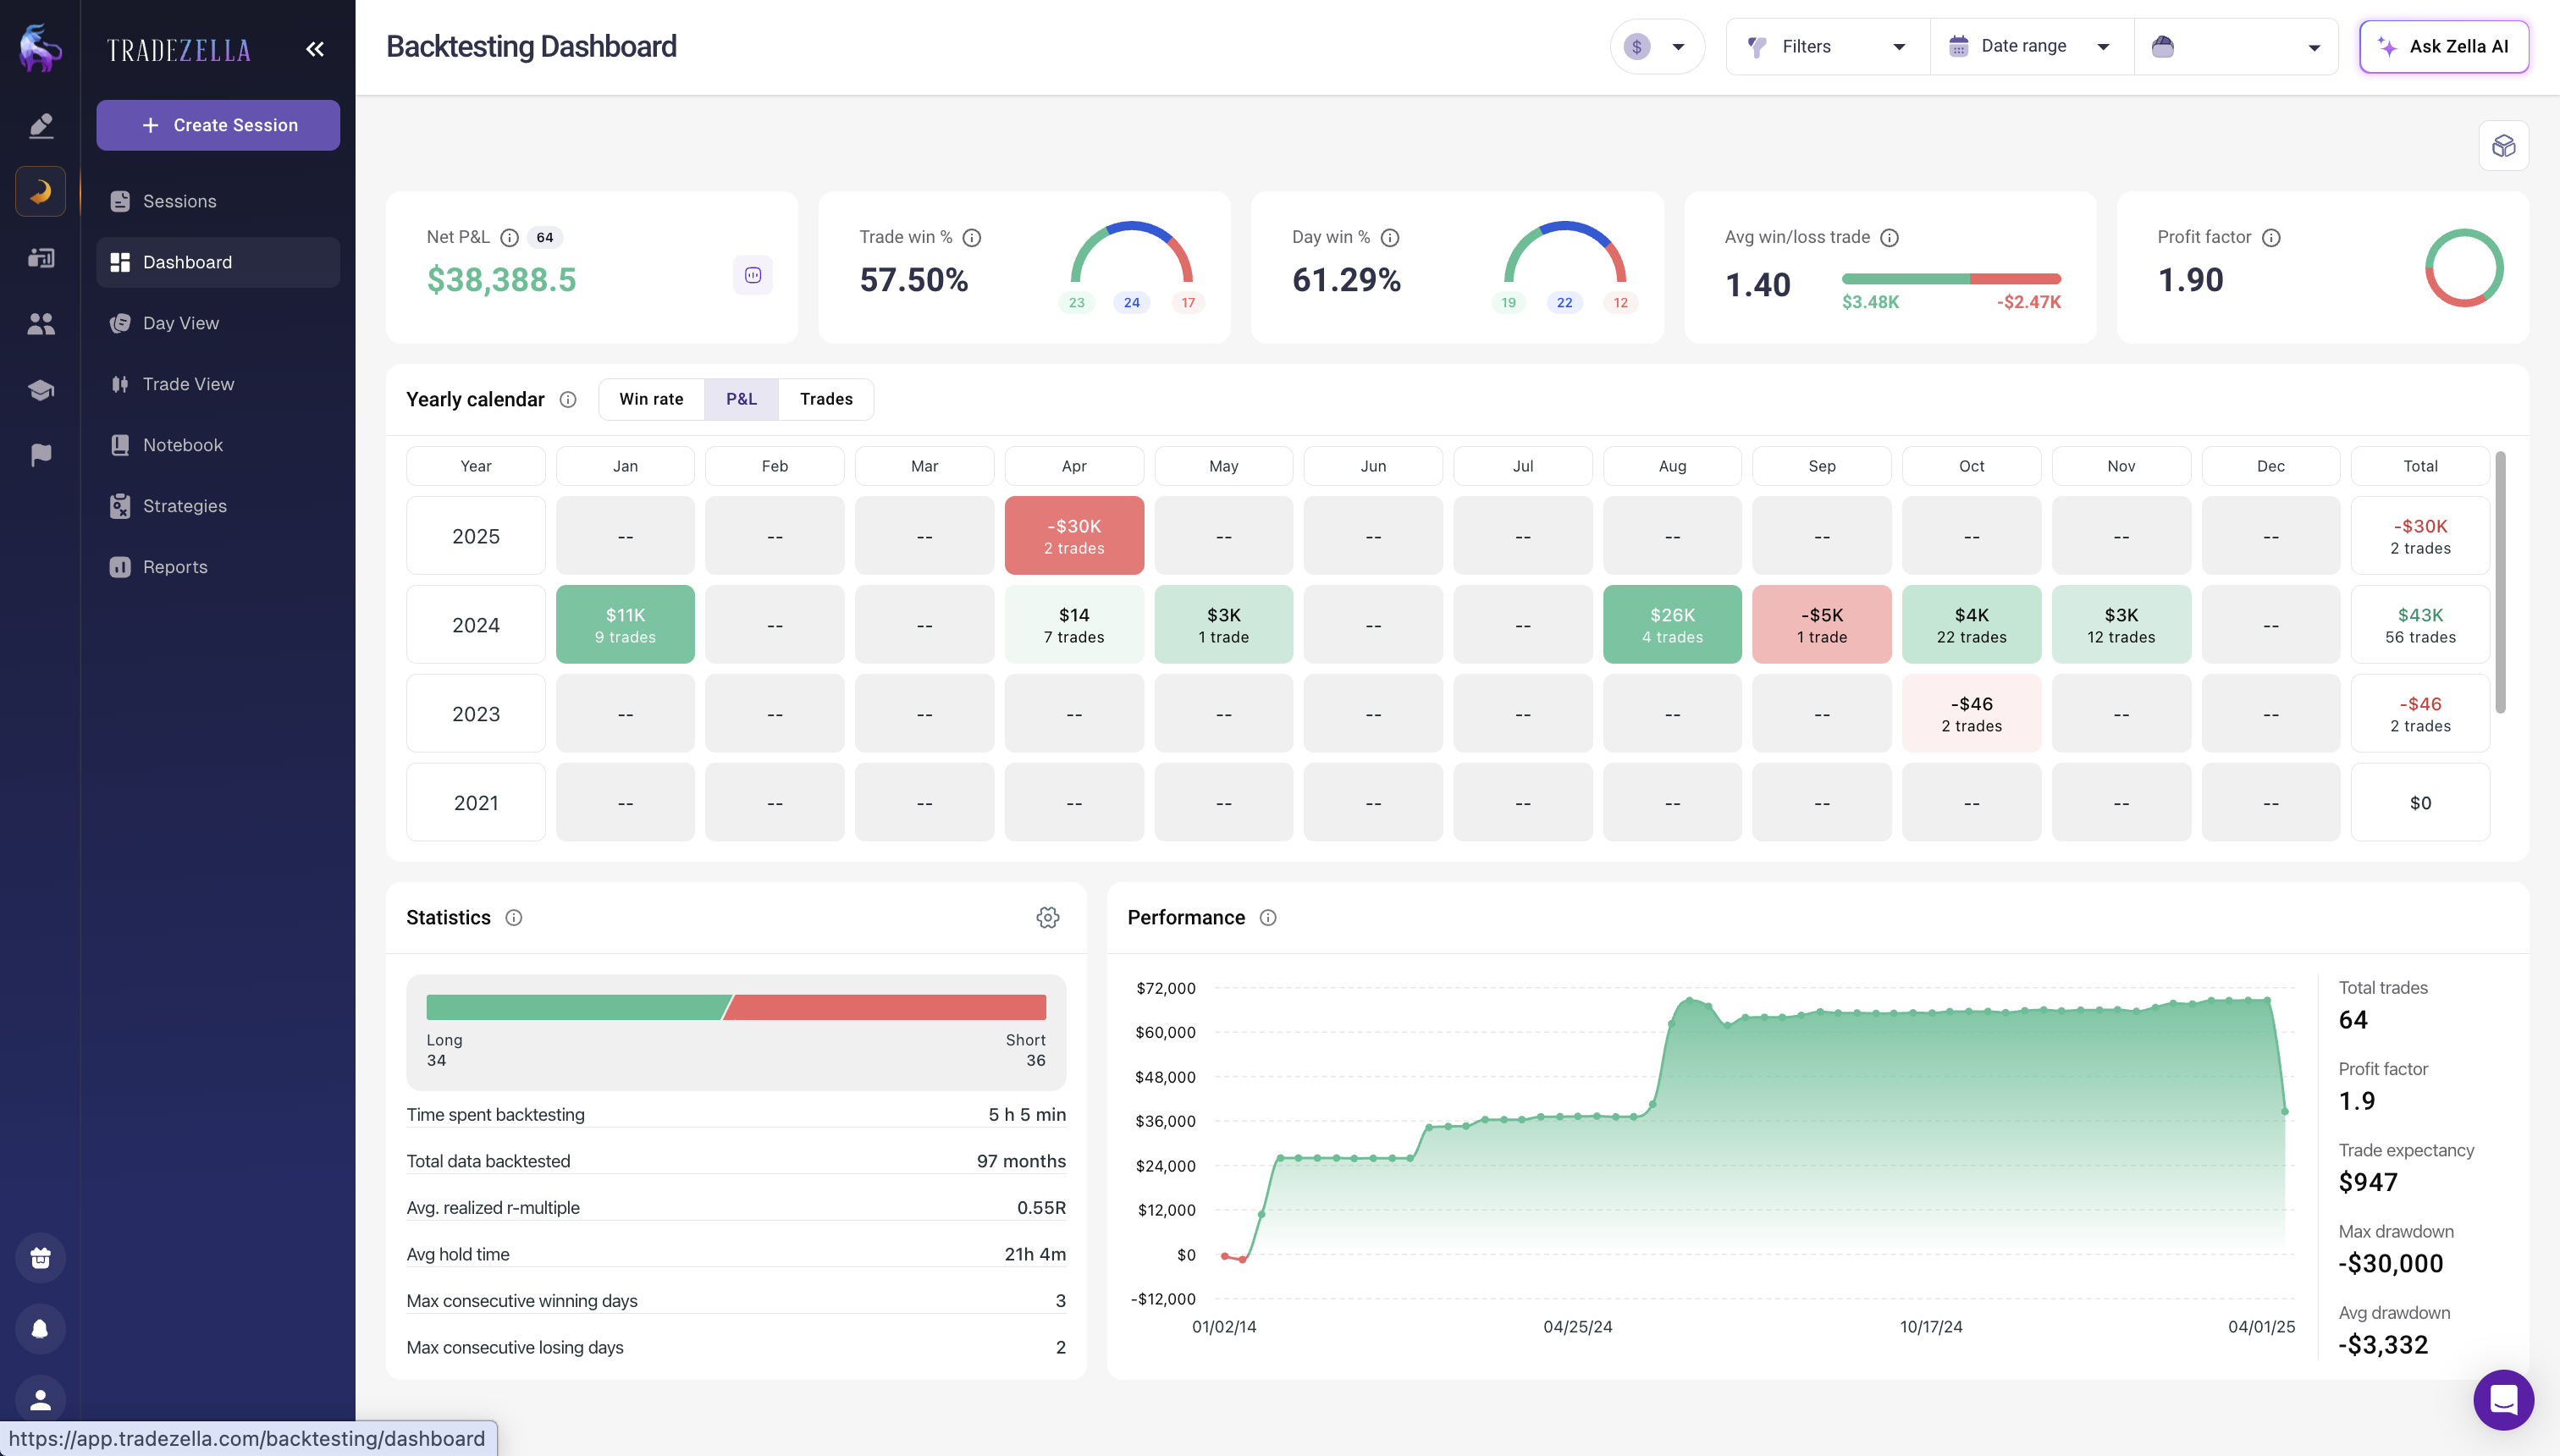
TradeZella's showing expectancy calculated for a strategy alongside win rate and profit factor
Here's the formula, what the numbers actually mean, and how to use expectancy to decide which of your setups to keep and which to cut.
What Is the Trading Expectancy Formula?
The formula for trading expectancy is:
Expectancy = (Win Rate x Average Win) - (Loss Rate x Average Loss)
Example: Win rate 45%, average win $400, average loss $250.
Expectancy = (0.45 x $400) - (0.55 x $250) = $180 - $137.50 = $42.50 per trade
Every time you take this setup, you expect to make $42.50 on average. Over 100 trades, that's $4,250 in profit from this setup alone.
Now change one variable: if your average losing trade grows to $350 (you're moving your stop, letting losers run):
Expectancy = (0.45 x $400) - (0.55 x $350) = $180 - $192.50 = -$12.50 per trade
Same win rate. Same average win. But you're now losing money purely because your losses are bigger than they should be. This is what expectancy reveals that win rate alone never would.
This is also why mechanical stop losses matter so much. Every time you widen a stop or let a loser run, you're directly attacking the "Average Loss" side of the expectancy equation.
What Counts as "Good" Expectancy?
There's no universal good expectancy because it depends entirely on your trade frequency and position sizing. The more useful framing: expectancy positive = strategy has an edge. Expectancy negative = it doesn't.
For traders who want a benchmark, most profitable retail traders operate in the $25-$150 per trade expectancy range. What matters more than the number: is your expectancy stable over time, or is it declining? A declining expectancy tells you your edge is eroding.
Expectancy also explains why different strategy types need different win rates. A scalper with 60% win rate and small wins might have the same expectancy as a trend follower with 35% win rate and large wins. The formula doesn't care how you get there, it only cares that the math works.
Strategy Type
Typical Win Rate
Avg Win : Avg Loss
Expected Expectancy/Trade
Scalper
55-65%
1:1 to 1.5:1
$15-$80
Day Trader
45-55%
1.5:1 to 2.5:1
$40-$150
Swing Trader
40-50%
2:1 to 3:1
$60-$200
Trend Follower
30-40%
3:1 to 5:1
$80-$300
How Does Expectancy Look Across Different Setups?
Imagine a trader with three setups in their journal over 60 days:
Setup A: VWAP Bounce (40 trades, 58% win rate, avg win $320, avg loss $195) Expectancy = $103.70 per trade
Setup B: Breakout Entry (35 trades, 42% win rate, avg win $510, avg loss $290) Expectancy = $46 per trade
Setup C: Gap and Go (28 trades, 36% win rate, avg win $380, avg loss $310) Expectancy = -$61.60 per trade
Setup C feels exciting. But the expectancy is negative. This trader is losing money every time they take that setup, and they probably didn't know it because some Gap and Go wins were big and memorable.
The action: eliminate Setup C. Double down on Setup A.
Metric
Setup A: VWAP Bounce
Setup B: Breakout Entry
Setup C: Gap and Go
Trades
40
35
28
Win Rate
58%
42%
36%
Average Win
$320
$510
$380
Average Loss
$195
$290
$310
Expectancy/Trade
+$103.70
+$46.00
-$61.60
Total P&L
+$4,148
+$1,610
-$1,725
Verdict
Keep & scale
Keep
Cut or refine
In TradeZella, your analytics reports calculate expectancy by strategy automatically. You can see all three setups side by side with win rate, average win, average loss, and expectancy calculated.
What to do: Pull up your strategy performance breakdown in your journal. Find the setups with negative expectancy. Stop trading them for 30 days and measure the impact on your overall P&L.
How Many Trades Do You Need to Trust Your Expectancy?
Expectancy calculated over 8 trades is meaningless. The number becomes trustworthy around 30-50 trades and statistically solid around 100+.
The rule of thumb: don't make major strategy decisions based on fewer than 30 trades per setup. Don't treat an expectancy number as definitive until you have 50+. At 100 trades, you have a real answer.
In TradeZella, every trade tagged to the right strategy builds toward a meaningful sample. At 100 tagged trades per setup, you know whether that setup has an edge.
If you want to reach a reliable sample faster without risking real money, backtesting your setup against historical data lets you build a 100+ trade sample in hours instead of months.
Does Trading Expectancy Change in Different Market Conditions?
A strategy can have positive expectancy in trending markets and negative expectancy in choppy, range-bound markets. Filter your journal analytics by date range to isolate trending versus choppy market periods. If expectancy drops sharply in certain conditions, that tells you when to trade smaller or not at all.
This is also why profit factor and expectancy should be tracked together. Profit factor gives you the overall health check. Expectancy, filtered by condition, tells you exactly when your edge exists and when it doesn't. Both metrics are calculated automatically in TradeZella's analytics and can be filtered by date range, time of day, day of week, and custom tags.
For prop firm traders, this is especially important. If your expectancy drops in certain market conditions and you're in the middle of a challenge evaluation, knowing when to sit out can be the difference between passing and blowing through your drawdown limit.
HIGH Expectancy vs. Profit Factor: What's the Difference?
Use profit factor to measure your strategy overall. Use expectancy to measure individual setups and make setup-level decisions. Most traders benefit from tracking both.
Here's the simplest way to think about it: profit factor answers "is my overall trading profitable?" Expectancy answers "is this specific setup worth taking?" When you break expectancy down by strategy in TradeZella, you can see exactly which setups are pulling your profit factor up and which are dragging it down.
Both metrics also depend on your risk-reward ratio. A setup with a 2:1 risk-reward and a 40% win rate has positive expectancy. The same setup at 1:1 risk-reward and 40% win rate has negative expectancy. You can check the math on any trade before entering using the free calculator.
How to Improve Your Expectancy
There are only three levers that move expectancy. Understanding them gives you a clear action plan instead of vague "trade better" advice.
1. Increase your average win. Hold winners longer. Use trailing stops. Target the next resistance level instead of settling for 1:1. This is the highest-leverage change most traders can make because they're already cutting winners short.
2. Decrease your average loss. Use tighter, mechanical stop losses. Don't move stops further away from your entry. If your planned risk is $200, your actual loss should be $200, not $350 because you "gave it room."
3. Increase your win rate (carefully). Better entries, better timing, and only taking A+ setups can push win rate up. But don't chase win rate at the expense of average win size. A win rate increase from 45% to 50% means nothing if your average win drops from $400 to $250 in the process.
The easiest path for most traders: focus on lever #2 first. Cutting your average loss by $50 per trade across 100 trades saves $5,000. That's usually faster and more reliable than trying to find bigger winners.
Use a position size calculator to make sure your risk per trade is consistent. Inconsistent sizing creates noise in your expectancy calculation and makes it harder to know if your edge is real.
Expressing Expectancy in R-Multiples
Some traders prefer to measure expectancy in R-multiples instead of dollar amounts. R is your risk per trade. If you risk $200 per trade and your expectancy is $80 per trade, your expectancy is 0.4R.
This is useful because it normalizes expectancy across different account sizes and position sizes. A trader risking $100 per trade with 0.4R expectancy and a trader risking $1,000 per trade with 0.4R expectancy have the same quality of edge, just different scale.
In R-multiple terms, most profitable strategies produce between 0.2R and 0.6R expectancy per trade. Anything above 0.5R sustained over 100+ trades is an excellent edge.
TradeZella reports showing expectancy in R-multiple
Expectancy = (Win Rate x Average Win) - (Loss Rate x Average Loss). It's the average amount you make per trade.
Positive expectancy = strategy has an edge. Negative expectancy = it doesn't, regardless of how exciting individual trades feel.
Use expectancy to compare setups side by side. The setup that "feels" best and the setup with the highest expectancy are often different setups.
Expectancy is only meaningful over 30+ trades per setup. Don't make major decisions on fewer trades.
The same setup can have different expectancy in different market conditions. Filter by date range and market type to find when your edge exists.
Three levers to improve expectancy: increase average win, decrease average loss, or increase win rate carefully. Cutting losses is usually the fastest fix.
Track expectancy in TradeZella alongside profit factor and win rate for each strategy. The full picture prevents you from fixating on one number.
Frequently Asked Questions
What is expectancy in trading?
Expectancy is the average profit or loss per trade over a large sample. Calculated as (Win Rate x Average Win) - (Loss Rate x Average Loss), it tells you whether a trading strategy makes money over time. TradeZella calculates expectancy automatically for every strategy you trade.
What is a good trading expectancy?
Any positive expectancy means your strategy has an edge. Most profitable retail traders operate in the $25-$150 per trade range. More important: your expectancy should be positive and stable over time. A declining expectancy, even if still positive, signals that your edge may be eroding.
How many trades do I need to calculate expectancy?
At least 30 trades per setup for a preliminary reading. 50+ for a reasonably reliable estimate. 100+ for a statistically sound conclusion. TradeZella shows your trade count alongside expectancy so you always know how much confidence to place in the number.
Can I have a positive expectancy with a low win rate?
Yes. A 35% win rate with a 4:1 average win-to-loss ratio produces a positive expectancy. Many profitable trading strategies win less than half their trades. Use the free Risk-Reward Calculator to check whether your target risk-reward ratio supports positive expectancy at your current win rate.
What should I do if one of my setups has negative expectancy?
Stop trading it. If you have 50+ trades and the expectancy is clearly negative, the setup doesn't have an edge. Refine the entry criteria and track a new sample, or remove it and focus on your positive-expectancy setups. In TradeZella, you can archive the strategy and start a refined version as a new strategy to track the improvement separately.