How to Maintain a Trading Log That Actually Improves Performance
How to Maintain a Trading Log That Actually Improves Performance
Most traders quit journaling because they're doing it wrong. Learn the system that turns your trading log from abandoned spreadsheet into your biggest edge. Includes a sample entry template.
class SampleComponent extends React.Component {
  // using the experimental public class field syntax below. We can also attach
  // the contextType to the current class
  static contextType = ColorContext;
  render() {
    return <Button color={this.color} />
  }
}
How to Maintain a Trading Log That Actually Improves Performance
You know you should keep a trading log. Every mentor, every course, every successful trader says the same thing. Yet here you are, either not journaling at all, or filling out entries you never look at again. The gap between knowing and doing feels massive, and you're not alone. Most traders who start logging quit within weeks because they're doing it wrong.
Last updated: February 2026
The real problem isn’t discipline. Traders with 20.5 billion trades journaled through platforms like TradeZella aren’t more motivated, they’ve just removed the friction. Here’s why most trading logs fail:
Manual entry takes too long: 15–30 minutes per day leads to abandonment within weeks
Data sits unused: logging without reviewing is a diary, not a performance tool
No connection to analytics: raw data without automated reports generates no insights
The solution is a log that captures data automatically and turns it into practical performance analytics.
In this guide, you'll learn why your brain resists journaling, what to track beyond profit and loss, how to build consistency through automation, and how to run weekly reviews that surface practical takeaways. By the end, you'll have a framework for turning your trading log from an abandoned spreadsheet into your most powerful performance tool.
In This Guide
TL;DR: Most traders abandon their trading logs because manual entry takes too long and the data sits unused. The solution is automated capture combined with structured review. TradeZella's automated trade journaling syncs with 500+ brokers to capture every trade instantly, while custom templates and tagging surface the patterns that spreadsheets hide, helping you identify what's actually working and eliminate what isn't.
What Is a Trading Log?
A trading log is a structured record of every trade you take, capturing not just the financial outcome but the reasoning, emotions, and market conditions that led to each decision, designed to reveal patterns that improve future performance. Unlike a simple transaction history from your broker, a proper trading log connects:
Quantitative data: entries, exits, position sizes, P&L
Qualitative context: why you took the trade, how you felt, what setup triggered it
That combination is what actually explains your results.
Trading logs have evolved significantly from handwritten notebooks and basic spreadsheets. Early approaches focused purely on P&L tracking, missing the psychological and strategic dimensions that separate consistent traders from inconsistent ones. Modern tools recognize that the numbers alone don't tell you enough. You need context.
Modern trading journals like TradeZella combine automated trade capture with structured input for the qualitative details that matter. Connect your broker (MetaTrader 4 & 5, Interactive Brokers, Charles Schwab, Tradovate, and 500+ others), and every trade syncs automatically. The workflow looks like this:
Auto-captured: timestamps, prices, position sizes, commissions, fees
You add: setup type, emotional state, market conditions, rule adherence
Analytics surface: patterns across both layers
For example, you might discover patterns like "your breakout trades have a 67% win rate on Tuesdays before 10am, but only 31% after lunch."
Why Your Trading Log Matters
Breaking the Cycle of Repeated Mistakes
You've watched yourself make the same error multiple times. Same setup looked good, same emotional trigger kicked in, same regret afterward. Without documentation, you're relying on memory to spot these patterns, and your brain is unreliable. We naturally minimize our failures and misremember the sequence of events.
The cycle continues because patterns buried in raw trade data stay invisible. You might sense that you "trade emotionally sometimes," but that vague awareness doesn't change behavior. You need specifics: which emotions, which conditions, how much they cost you.
Custom mistake tagging transforms vague awareness into specific, fixable problems. Label every trade with error categories:
Overconfidence: ignoring risk rules after a winning streak
FOMO: chasing extended moves with poor reward-to-risk
Revenge trading: oversizing after losses to “make it back”
Early exits: closing winners before target out of fear
Rule violations: trades that didn’t meet your own entry criteria
After 30 days of tagged data, most traders discover that 2–3 specific mistakes account for the majority of their losses. Fixing even one of them can transform your results.
The Data Behind Consistent Profitability
100,000+ active traders have journaled through TradeZella, contributing to more than 20.5 billion trades logged on the platform. That scale reveals something important: traders who review their logs weekly show measurably different results than those who log and forget.
The difference isn't motivation. Consistent traders simply have better feedback loops. They know their win rate by setup type, their average hold time on winners versus losers, their performance by time of day and day of week. Amateur traders operate on feeling and hope.
Win rate by strategy: which setups actually make money over 30+ trades
Profit factor by time of day: find your most and least profitable trading windows
Expectancy per setup: your average profit per trade by strategy type
Drawdown analysis: how deep your losing streaks get and how long recovery takes
R-multiple distribution: whether you’re cutting winners short or letting losers run
These reports update in real time as new trades sync from your broker. No formulas, no manual calculations.
Creating Control in a Chaotic Market
Trading can feel random. Markets gap against you, news hits unexpectedly, and some days nothing makes sense. Without structure, that chaos bleeds into your psychology. You start second-guessing everything, overtrading to "make back" losses, or freezing when good setups appear.
A well-maintained trading log creates an island of control within market uncertainty. You can't control what the market does, but you can control how you respond, document, and learn. That sense of agency matters psychologically.
Building structured routines around your trading creates consistency in a chaotic market. A daily logging routine should include:
Pre-market: review your plan, check for news events, set daily risk limits
During trading: trades sync automatically; tag emotions and setup type in real time
Post-market: 2–3 minutes to add context notes and mistake tags to each trade
Weekly: 30-minute review: analyze patterns, identify one action item for next week
How a Trading Log Works
Building an effective trading log involves three connected stages: capturing the right data, organizing it for analysis, and reviewing it systematically. TradeZella handles each stage through purpose-built features that work together.
Stage 1: Data Capture
The foundation is getting trade data into your log consistently. Miss a trade, and your analysis becomes unreliable. Rely on manual entry, and you'll eventually fall behind or quit.
Automated capture eliminates the failure point that kills most trading logs. Supported platforms include:
Stocks/Options: Interactive Brokers, Charles Schwab, Webull, Tastytrade
Futures: NinjaTrader, Tradovate, Rithmic, Sierra Chart
Prop firm platforms: all major evaluation and funded account platforms
500+ total integrations covering every major platform. CSV import handles everything else.
The platform supports unlimited trading accounts in one place, which matters if you're managing multiple prop firm accounts or separating strategies across brokers. Everything consolidates into a single view with automatic statistics calculation.
Stage 2: Context Enrichment
Raw trade data tells you what happened. Context tells you why. The second stage involves adding the qualitative layer that transforms your log from a transaction record into a learning tool.
Strategy tagging lets you categorize each trade by setup type: "breakout," "reversal," "news event," or whatever categories match your approach. You add notes on market conditions, your emotional state entering the trade, and whether you followed your rules. Custom templates ensure you capture the same information consistently, making patterns easier to spot.
The Playbooks feature stores your standardized entry and exit rules, along with notes and images. When you tag a trade with a specific playbook, TradeZella tracks performance per strategy automatically. You see which setups actually make money over time versus which ones just feel good in the moment.
Stage 3: Pattern Recognition and Review
Data without review is wasted effort. The third stage is where your log delivers value: surfacing patterns you couldn't see in real time and guiding your improvement.
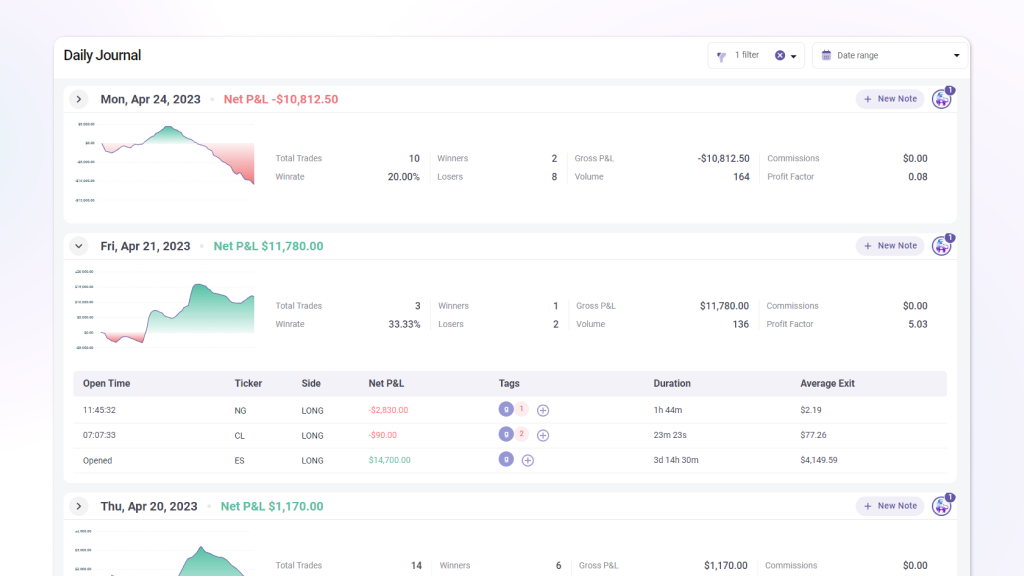
Analytical reports handle the pattern recognition automatically. TradeZella's 50+ reports let you filter by date range, instrument, strategy, or any tag combination, discovering your best trading day, worst time of day, which setups have positive expectancy, and which to stop trading entirely.
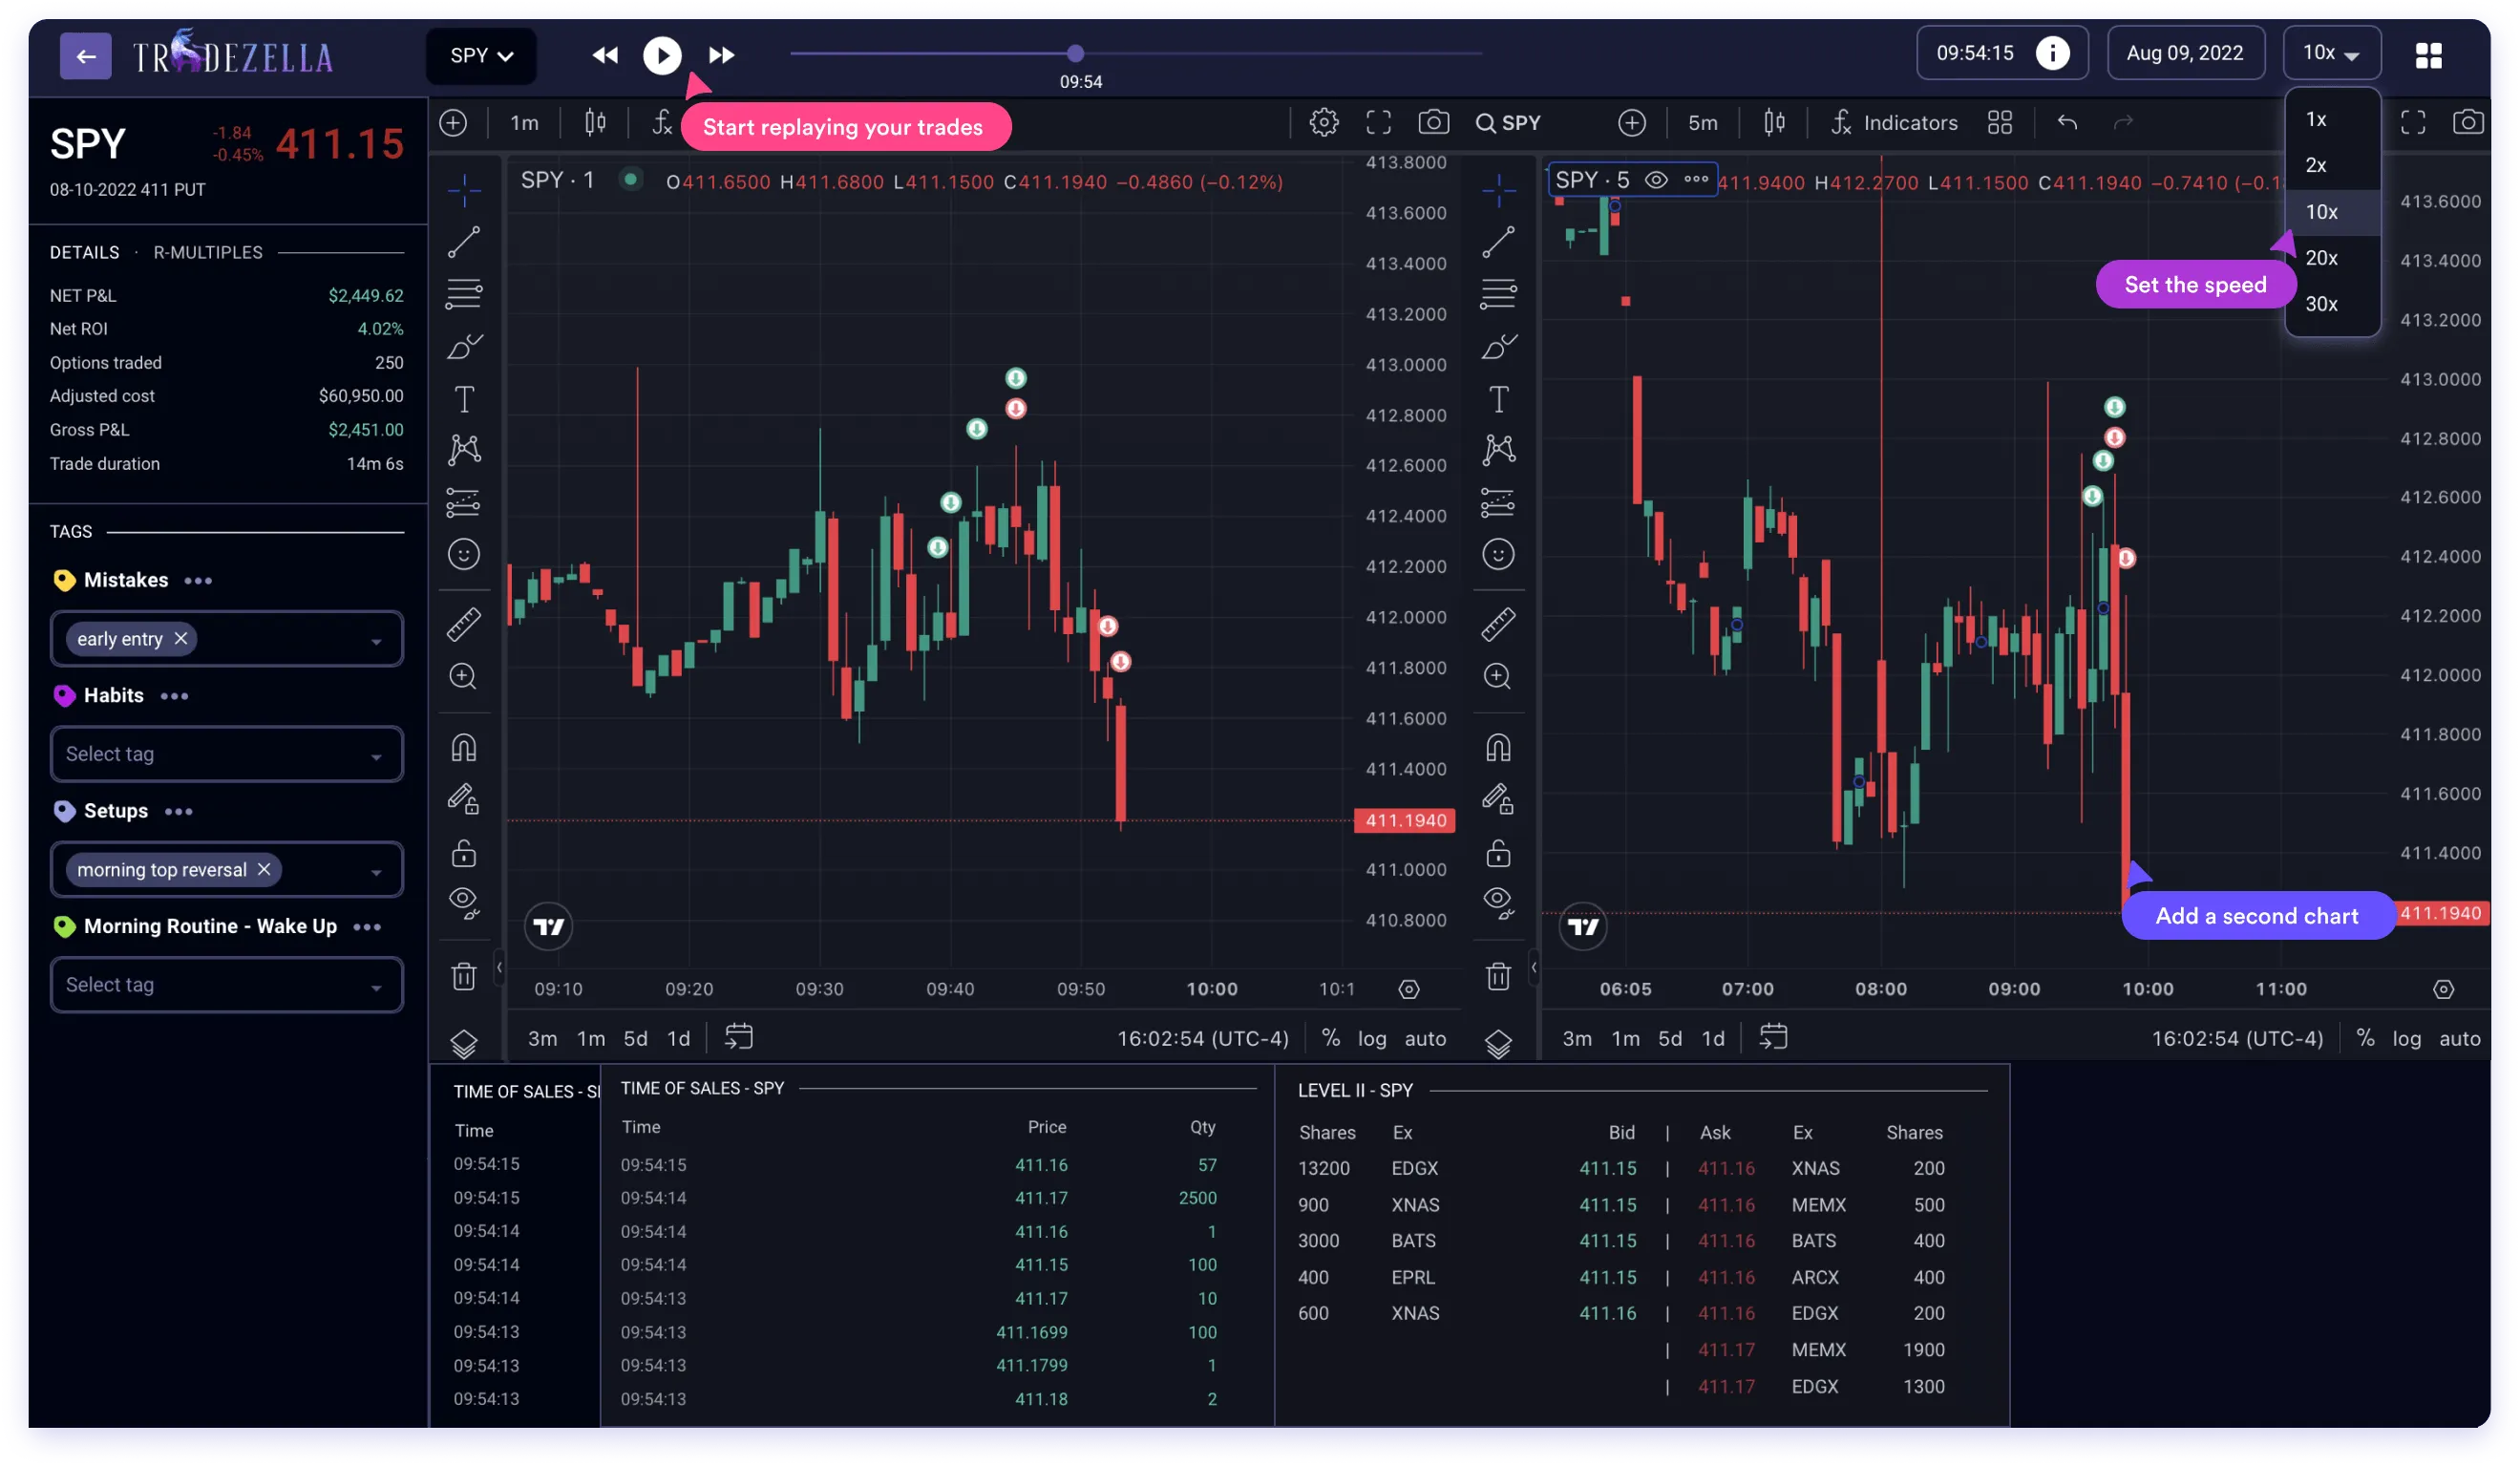
The Trade Replay feature takes analysis deeper by letting you review trades tick-by-tick with time and sales data and Level 2 market data. See exactly how price moved around your entry, with your execution plotted on the chart. Replay reveals whether your entries were well-timed or whether you're consistently getting filled at worse prices than you expected.
Sample Trading Log Entry Template
A complete log entry captures both the numbers and the story behind them. Here's a template that covers the essential fields:
Factor
Questions to Ask
How It Filters Strategies
Available Time
How many hours can you actively trade per day? Can you monitor positions, or only check periodically?
Eliminates scalping and active day trading for part-time traders. Favors swing/position trading for limited schedules.
Psychological Tolerance
Can you handle losing 6 of 10 trades if winners are bigger? Do you need frequent wins for confidence?
High win-rate needs → mean reversion, scalping. Comfort with low win-rate → trend following, breakout.
Risk Capacity
What's your maximum acceptable drawdown? How much can you lose before it affects your decision-making?
Strict drawdown limits → mean reversion, smaller position sizing. Higher tolerance → trend following, momentum.
Decision Speed
Do you think quickly under pressure, or need time to analyze?
Fast decisions → scalping, momentum. Deliberate analysis → swing, position trading.
Capital Available
Do you have enough to weather normal drawdowns for your strategy type?
Pattern day trading rules, minimum position sizes, and commission impact all vary by strategy and capital level.
With an automated journal like TradeZella, most of these fields populate automatically through broker sync. You add context through templates and tagging, and the platform calculates R-multiples, aggregates your mistake tags, and generates performance reports by setup type and emotional state.
Best Practices for Trading Log Success
Schedule Your Reviews Like Appointments
Logging without reviewing is collecting data you'll never use. The traders who improve are the ones who treat review time as non-negotiable. Block 30 minutes weekly on your calendar and protect it.
The challenge is that reviewing your losses feels uncomfortable. Your brain wants to move on and forget the bad trades. But avoidance is exactly why those patterns keep repeating.
Visual reporting makes reviews less painful. Instead of scrolling through rows of losing trades, you see aggregated statistics and trend charts. The emotional sting diminishes when you're looking at analytics rather than individual failures. Some traders find it helpful to review on Sunday evening, using the insights to prepare mentally for the week ahead.
Tag Emotions in Real Time
The accuracy of your emotional tagging degrades rapidly after a trade closes. What felt like "confident execution" in the moment might feel like "reckless gambling" an hour later when you see the result. Neither retrospective interpretation is accurate.
Build a habit of noting your emotional state before and immediately after each trade. Since TradeZella is browser-based, this is practical even if you're trading away from your primary setup. A quick tag takes seconds and preserves information that becomes valuable in aggregate.
Over time, you'll discover correlations between emotional states and outcomes that surprise you. Maybe your "nervous" trades actually outperform because nervousness makes you more careful with position sizing. Maybe your "bored" trades underperform because boredom leads you to force setups that aren't really there.
Let the Data Challenge Your Assumptions
Every trader has beliefs about their own performance. "I'm good at trading breakouts." "I shouldn't trade on Fridays." "My losses are just bad luck." Most of these beliefs are at least partially wrong.
Your trading log is a reality check. When you filter by setup type and see that your "best" strategy actually has a negative expectancy over 100 trades, that's uncomfortable but valuable. When you discover that Fridays are actually your most profitable day, you've saved yourself from an unnecessary restriction.
The 50+ reports in TradeZella exist specifically to surface these surprises. Don't just look at overall P&L. Segment your data by every dimension available. The findings that improve your trading rarely come from confirming what you already believe.
Build Playbooks That Evolve
Your first attempt at documenting a strategy won't be perfect. Trade it, log it, review it, and update the playbook based on what you learn. The written documentation should be a living document.
TradeZella's Playbooks feature makes this evolution trackable. You can see performance statistics per playbook over time. As you refine the rules, the data shows whether your refinements actually improve results.
Some traders find it helpful to share playbooks with trading partners or mentors for feedback. TradeZella's Mentor Mode enables this kind of collaborative improvement by letting you share trade data with trusted reviewers.
Common Mistakes That Sabotage Your Log
Logging Only P&L
If your trading log is just a record of what you made or lost, you're missing 90% of the value. The dollar outcome of a trade tells you almost nothing about whether it was a good decision or why it happened.
A +$500 trade could be an excellent execution of your strategy, or it could be a reckless gamble that happened to work. A -$200 trade could be a clear process violation, or it could be a well-executed position that simply hit your predetermined stop. Without context, you can't tell the difference.
The fix is capturing the story behind each number. Entry reasoning, setup type, emotional state, market conditions, whether you followed your rules. These qualitative fields transform your log from a scoreboard into a learning tool.
Inconsistent Entries
Sporadic logging is almost worse than no logging at all. If you only journal your winning trades, your data shows you're a genius. If you only journal on good days, your analytics paint an unrealistically rosy picture. Any analysis built on incomplete data leads to flawed conclusions.
The solution is automation. When TradeZella syncs directly with your broker, every trade appears whether you felt like logging it or not. Your job shrinks from "enter all trade data manually" to "add context tags and notes." That smaller task is maintainable long-term.
Prop firm candidates especially can't afford inconsistent records. The evaluation process requires demonstrable discipline, and gaps in your trading log raise questions about what you're hiding.
Reviewing Without Acting
Some traders log religiously, run weekly reviews, and generate beautiful reports. Then they go back to trading exactly the same way. The review becomes a ritual that feels productive but changes nothing.
Every review session should end with at least one specific action item. "I will not take trades before 9:45 AM this week." "I will reduce position size on counter-trend setups by 50%." "I will add a 'pre-trade checklist complete' tag and only take trades that qualify."
Write the action item in TradeZella's, track whether you followed it, and evaluate the impact in your next review. Analysis without implementation is entertainment, not improvement.
Frequently Asked Questions
What should I track in a trading log besides profit and loss?
Track entry and exit reasoning, emotional state, market conditions, setup type, and rule adherence. These qualitative fields explain why your results happened, not just what they were. Key fields to capture:
Setup type: which strategy triggered the trade
Emotional state: confidence level before and after
Market conditions: trend, volume, volatility
Rule adherence: did you follow your plan?
Mistake tags: what went wrong and why
Tools like TradeZella make this context capture consistent with custom templates and tagging, and the analytics engine correlates these qualitative fields with your outcomes to reveal patterns.
How long does it take to maintain a trading log each day?
With automated syncing, daily maintenance takes 5–10 minutes. Time breakdown:
Data entry: 0 minutes (trades sync automatically from your broker)
Tagging: 3–5 minutes (add emotions, mistakes, and strategy labels to each trade)
Context notes: 2–3 minutes (market conditions, what you were thinking)
Weekly review: 20–30 minutes once per week (pattern analysis, action items)
The qualitative tagging is where the value lives. Automated data capture frees your time for the reflection that actually drives improvement.
Can a trading log really help me pass prop firm evaluations?
Yes, because evaluations test discipline and consistency, which logging directly supports. Prop firms fail traders who:
Deviate from their own rules
Overtrade or size up recklessly
Can’t demonstrate a repeatable edge
A detailed trading log with mistake tagging shows you exactly when and why you violate your own guidelines.
How often should I review my trading log?
Review weekly at minimum, with a deeper monthly analysis. Recommended cadence:
Daily: 2–3 minutes tagging trades with emotions and mistakes (don’t skip this)
Weekly: 30-minute review: check win rate, mistake patterns, set one action item
Monthly: deeper analysis: compare this month to last, evaluate strategy-level performance
Quarterly: big picture: are you improving? Do you need to retire or add strategies?
The weekly review is the highest-use habit. Daily tagging takes minutes but makes the weekly review actually useful.
What's the difference between a trading log and a trading journal?
The terms are often used interchangeably, but there’s a useful distinction:
Trading log: emphasizes data capture: entries, exits, P&L, position sizes, timestamps
Trading journal: emphasizes reflection: why you took the trade, emotional state, lessons learned
Complete system: combines both: quantitative data plus qualitative context
The most effective approach merges both. Automated data capture handles the log side, freeing you to focus on the journal side, the reflective work that actually drives improvement.
Is a spreadsheet good enough for a trading log?
Spreadsheets work initially but fail at scale. The core problems with spreadsheets:
Manual entry takes 15-30 minutes daily
Calculation errors compound over time
No automated pattern recognition or analytics
Most traders quit because the effort outweighs the perceived benefit
Automated journals like TradeZella eliminate the manual entry barrier, while 50+ pre-built reports surface patterns that would require advanced spreadsheet skills to replicate. The time savings alone (16+ hours monthly for active traders) make the switch worthwhile.
How do I use my trading log to recover from a losing streak?
Filter your recent losses and look for common factors, then isolate the cause before trading more. Ask yourself:
Am I repeating the same flawed setup?
Am I trading at times when I historically underperform?
Am I sizing too aggressively for current conditions?
TradeZella's Trade Replay feature lets you watch losing trades tick-by-tick to understand exactly where execution broke down. Review without judgment first, identify the pattern, then create a specific rule change to address it before resuming full-size trading.
What metrics should I prioritize in my trading log analysis?
Focus on win rate by setup type, average R-multiple, and mistake tag frequency first. Overall P&L can mask problems if a few lucky trades inflate your numbers. Segmented analysis by strategy reveals which approaches actually have positive expectancy over your sample. TradeZella calculates these automatically, but start with three core questions:
Which setups actually make money over a meaningful sample?
How much do winners versus losers average (R-multiple)?
Which behavioral patterns cost me the most?
Key Takeaways
Your trading log transforms from a chore into a competitive advantage when you automate the tedious capture and focus your energy on meaningful review. The right tools turn raw trade data into practical takeaways that reveal exactly what's working and what needs to change.
Automate capture first. Manual logging fails because it takes too long. Connect your broker and let every trade sync automatically.
Track context, not just outcomes. Setup type, emotional state, and rule adherence matter more than P&L for understanding why you win or lose.
Review weekly with specific action items. Data without implementation changes nothing. End every review with one concrete adjustment.
Use tagging and analytics to surface patterns. TradeZella’s 50+ reports reveal findings that spreadsheets and memory can’t provide.
Stop guessing about your edge. Start proving it with data. Your next level as a trader begins with the discipline to log, the structure to review, and the tools to see patterns you couldn't see before.