Gap and Go Strategy: How to Select, Enter, and Track Gap Trades That Actually Work
Gap and Go Strategy: How to Select, Enter, and Track Gap Trades That Actually Work
The Gap and Go strategy trades in the direction of a stock's opening gap, capturing momentum in the first 30 to 90 minutes. This guide covers gap selection criteria, two entry methods, position sizing with dollar examples, four gap types, and how to use journal data to find which gaps actually make you money.
class SampleComponent extends React.Component {
  // using the experimental public class field syntax below. We can also attach
  // the contextType to the current class
  static contextType = ColorContext;
  render() {
    return <Button color={this.color} />
  }
}
Last Updated: May 28th, 2026
The Gap and Go strategy is a day trading method where a trader enters a position in the direction of a stock's opening gap, aiming to capture the momentum that caused the gap within the first 30 to 90 minutes of the session. A gap occurs when a stock opens at a price significantly higher or lower than its previous day's close, usually driven by earnings, news, or overnight demand shifts. The strategy works because gaps backed by real catalysts attract volume, and volume drives follow-through.
Gap and Go is one of the most popular day trading approaches for a reason: it exploits the burst of momentum that happens when a stock opens significantly higher or lower than its previous close. Traders who master it can capture fast moves in the first 30 to 60 minutes and be done before lunch.
But here is what most Gap and Go guides skip: the strategy does not work on every gap. The difference between a profitable Gap and Go trader and a struggling one is not the concept (the core idea is simple). It is knowing which gaps to trade, when to enter, and how to track your execution so you can separate the setups that work for you from the ones that do not.
This guide covers the complete Gap and Go framework: gap selection criteria, two entry methods with exact rules, risk per trade calculations with dollar examples on a $50,000 account, the four gap types and which ones to avoid, and how to use your journal data to find your personal trading edge within the strategy.
What Is a Gap and Go?
A gap occurs when a stock opens at a price significantly different from its previous day's close. The Gap and Go strategy trades in the direction of the gap, betting that the momentum that caused the gap will continue past the open.
Gaps happen for several reasons: earnings reports, pre-market news, sector momentum, and overnight supply/demand imbalances. Not all gaps are worth trading. The strategy works best on gaps caused by genuine catalysts rather than low-volume overnight drift.
Here is the core logic: if a catalyst is strong enough to move a stock 3% before the market opens, and volume confirms that real money is behind the move, the odds favor continuation in the first 30 to 60 minutes. The Gap and Go trader captures that initial push.
The strategy is most commonly used by day traders who want defined, time-limited setups. Unlike scalping strategies that require dozens of trades per day, Gap and Go focuses on one to three high-conviction setups in the morning session. That selectivity is what makes it manageable for traders working on their trading discipline.
Which Gaps Are Worth Trading?
Gap selection is everything. Most days produce 20 or more stocks gapping at the open, but only two to three meet all the criteria for a high-probability Gap and Go trade. Here is the filter checklist that separates tradeable gaps from noise.
The Gap Filter Checklist
Gap size: minimum 2% from previous close. Gaps smaller than 2% often lack the momentum needed for follow-through. Gaps larger than 10% can attract profit-taking early, which creates a fade risk. On a $50,000 account risking 1% per trade ($500), you want enough movement to give you a clean 2:1 risk-reward ratio within the first hour.
Catalyst: a clear reason for the gap. Earnings beats, partnership announcements, FDA approvals, analyst upgrades, and regulatory decisions create the most reliable gaps. If you cannot find the reason for the gap within 30 seconds of searching, skip it. Gaps without catalysts are more likely to fill.
Pre-market volume: significantly higher than average. A stock showing 5x to 10x its normal pre-market volume is attracting real institutional and retail interest. Low pre-market volume on a large gap is a warning sign. It means the gap may have been caused by a small number of orders in a thin market.
Float: context for move speed. Lower-float stocks (under 20 million shares) produce larger, faster moves because there are fewer shares available to absorb buying pressure. Higher-float stocks (over 100 million shares) produce more controlled, grindier moves. Neither is inherently better. Low-float gaps move faster but are harder to exit at your planned price. High-float gaps are slower but give you cleaner fills.
Price range: $5 to $100. Stocks under $5 have wider spreads relative to price, which eats into your edge. Stocks over $100 require larger dollar risk per share, which can force you into smaller position sizes that reduce your profit potential.
Relative volume at open: 3x or higher. Pre-market volume tells you interest exists. Relative volume at the open confirms it. If a stock has high pre-market volume but relative volume drops below 2x at the open, the gap may have already played out in pre-market.
How Do You Enter a Gap and Go Trade?
There are two primary entry methods for Gap and Go. Each has different characteristics, and your journal data will eventually tell you which one produces a better profit factor for your execution style.
Method 1: The Opening Range Breakout
This is the more aggressive approach. It captures the initial momentum push but produces more false breakouts.
Watch the first 5 minutes. Let the stock establish a range. Do not trade immediately at the open. The first few minutes are chaotic, spreads are wide, and fills are unpredictable.
Define the opening range. Note the high and low of the first 5-minute candle. This range becomes your trigger and your risk boundary.
Enter on the breakout. For a gap up, enter long when price breaks above the range high with volume confirmation (the breakout candle should have above-average volume). For a gap down, enter short below the range low.
Set your stop. Place your stop at the opposite side of the opening range. This is a structure-based stop that uses price action rather than an arbitrary percentage. See stop loss strategies for why structure stops outperform fixed-distance stops on momentum trades.
Set your target. First target at 1.5 to 2R. Take 50% off at the first target and trail the remainder using the 5-minute candle lows (for longs) or highs (for shorts).
Dollar example on a $50,000 account: Stock gaps up to $45.00. The 5-minute opening range is $44.50 to $45.50. You enter long at $45.55 (breakout above range high). Stop at $44.45 (below range low). Risk per share: $1.10. With 1% risk ($500), your position size is $500 / $1.10 = 454 shares. First target at 2R: $45.55 + $2.20 = $47.75. You sell 227 shares at $47.75 for $499 profit and trail the remaining 227 shares.
Method 2: The VWAP Hold
This is the more conservative approach. It waits for a pullback after the initial gap, producing fewer entries but higher-probability trades.
Wait for the pullback. After the gap, price often pulls back toward VWAP (Volume Weighted Average Price) within the first 15 to 30 minutes.
Watch for the bounce. If price touches or approaches VWAP and bounces with increasing volume, the gap direction is confirmed.
Enter on the bounce. Enter in the direction of the gap as price moves away from VWAP. The entry is cleaner because VWAP acts as a dynamic support/resistance level that institutional traders respect.
Set your stop. Stop just below VWAP (for longs) or just above VWAP (for shorts). This typically gives you a tighter stop than the opening range method, which means a larger position size for the same dollar risk.
Set your target. First target at the opening range high (or the pre-market high if available). Trail the remainder.
Dollar example: Same stock gaps to $45.00. VWAP is $44.80 after the first 20 minutes. Price pulls back to $44.85, bounces with volume. You enter long at $44.95. Stop at $44.70 (below VWAP). Risk per share: $0.25. With $500 risk, position size: $500 / $0.25 = 2,000 shares. First target at the opening range high of $45.50. You sell 1,000 shares at $45.50 for $550 profit, trail the rest.
Notice the difference: the VWAP method gave you a larger position (2,000 vs 454 shares) with the same $500 risk because the stop was tighter. But you waited longer for the entry, and if price never pulls back to VWAP, you miss the trade entirely. Your trade review process will show which method produces better results for you over 30 or more trades.
How Do You Manage Risk on Gap Trades?
Gap trades move fast, which means risk management errors compound faster than on slower setups. A revenge entry after a failed gap trade can blow through your daily loss limit in minutes. Your day trading risk management rules are non-negotiable on gap trades.
Position Sizing
Calculate position size from your stop distance, not from how much you want to buy. Use the TradeZella position size calculator to get the exact share count before every entry.
The formula: Position size = Dollar risk / Risk per share.
On a $50,000 account with 1% risk per trade ($500):
The dollar risk stays constant at $500. The share count adjusts. This is how consistent risk per trade works in practice.
Time-Based Exits
Most Gap and Go moves play out within 30 to 90 minutes of the open. If your position has not hit your first target within 60 minutes, consider closing at market. Time-based exits prevent you from turning a Gap and Go into a swing trade. The catalyst momentum fades after the first hour, and holding through lunch exposes you to mean-reversion risk.
Daily Trade Limit
Maximum two to three Gap and Go trades per day. This is a hard rule, not a guideline. On days with five or more quality gaps, the temptation to trade all of them leads to overtrading. Your best gap trade of the day is almost always one of the first two. After that, you are chasing.
Set a daily loss limit of $1,500 (3% of $50,000). If your first two gap trades both stop out for $500 each ($1,000 total loss), you have one more trade before you hit the limit. This forces you to be extremely selective on trade three. See day trading risk management for the full daily limit framework.
Partial Profit Taking
Take 50% off at the first target (1.5 to 2R). Move your stop to breakeven on the remaining shares. Trail using the 5-minute candle structure. This locks in profit on the portion that pays for the trade and lets the remainder run if momentum continues.
On a $500 risk trade with a 2R first target: you lock in $500 on the first half. The remaining shares are now a free trade. Even if the trailing stop gets hit at breakeven, you net $500 on the position. Your R-multiple on this trade is +1R, and the trailing portion has unlimited upside.
What Are the Four Types of Gaps?
Not all gaps behave the same way. Understanding which type of gap you are looking at changes whether you enter, how you size, and where you set your target.
Breakaway Gaps: A stock gaps out of a consolidation pattern or defined range. This is the best gap type for Gap and Go. The breakout from consolidation means supply/demand has shifted, and the stock is entering a new price range. Follow-through is strongest on breakaway gaps because there is less overhead resistance.
Continuation Gaps: A stock that is already trending gaps further in the same direction. Trade with caution. Check how far the stock has already run. A stock that has risen 20% over two weeks and then gaps up another 5% is more likely to attract profit-taking than a stock gapping out of a flat base. Filter for continuation gaps where the total move (trend plus gap) is still within a reasonable range for the stock's average volatility.
Exhaustion Gaps: The final gap before a reversal. Avoid these. Exhaustion gaps are the traps that blow up Gap and Go accounts. The stock gaps up on heavy volume, looks like a perfect setup, then reverses hard. The tell: exhaustion gaps usually happen after an extended run (3 or more consecutive gap days) and the volume, while high, produces a doji or shooting star candle in the first 5 minutes. If you see a gap after three consecutive gap-up days, skip it regardless of how good the catalyst looks.
Common Gaps: Small gaps with no catalyst. Avoid. Common gaps typically fill within the first hour, which means the Gap and Go direction trade loses. These gaps are caused by normal overnight order flow, not by any fundamental shift. If your pre-market scan shows a 2% gap with zero news and average volume, it is a common gap.
How Do You Use Journal Data to Find Your Gap and Go Edge?
The Gap and Go concept is simple. Every trader who reads this article will learn the same entry rules and risk management framework. What separates the traders who profit from the ones who do not is personalization. Your execution, your timing, your risk tolerance, and your emotional patterns create a unique fingerprint. Journal data reveals that fingerprint.
This is where the strategy stops being generic and starts being yours. Here is how to use your data to find your specific trading edge within Gap and Go.
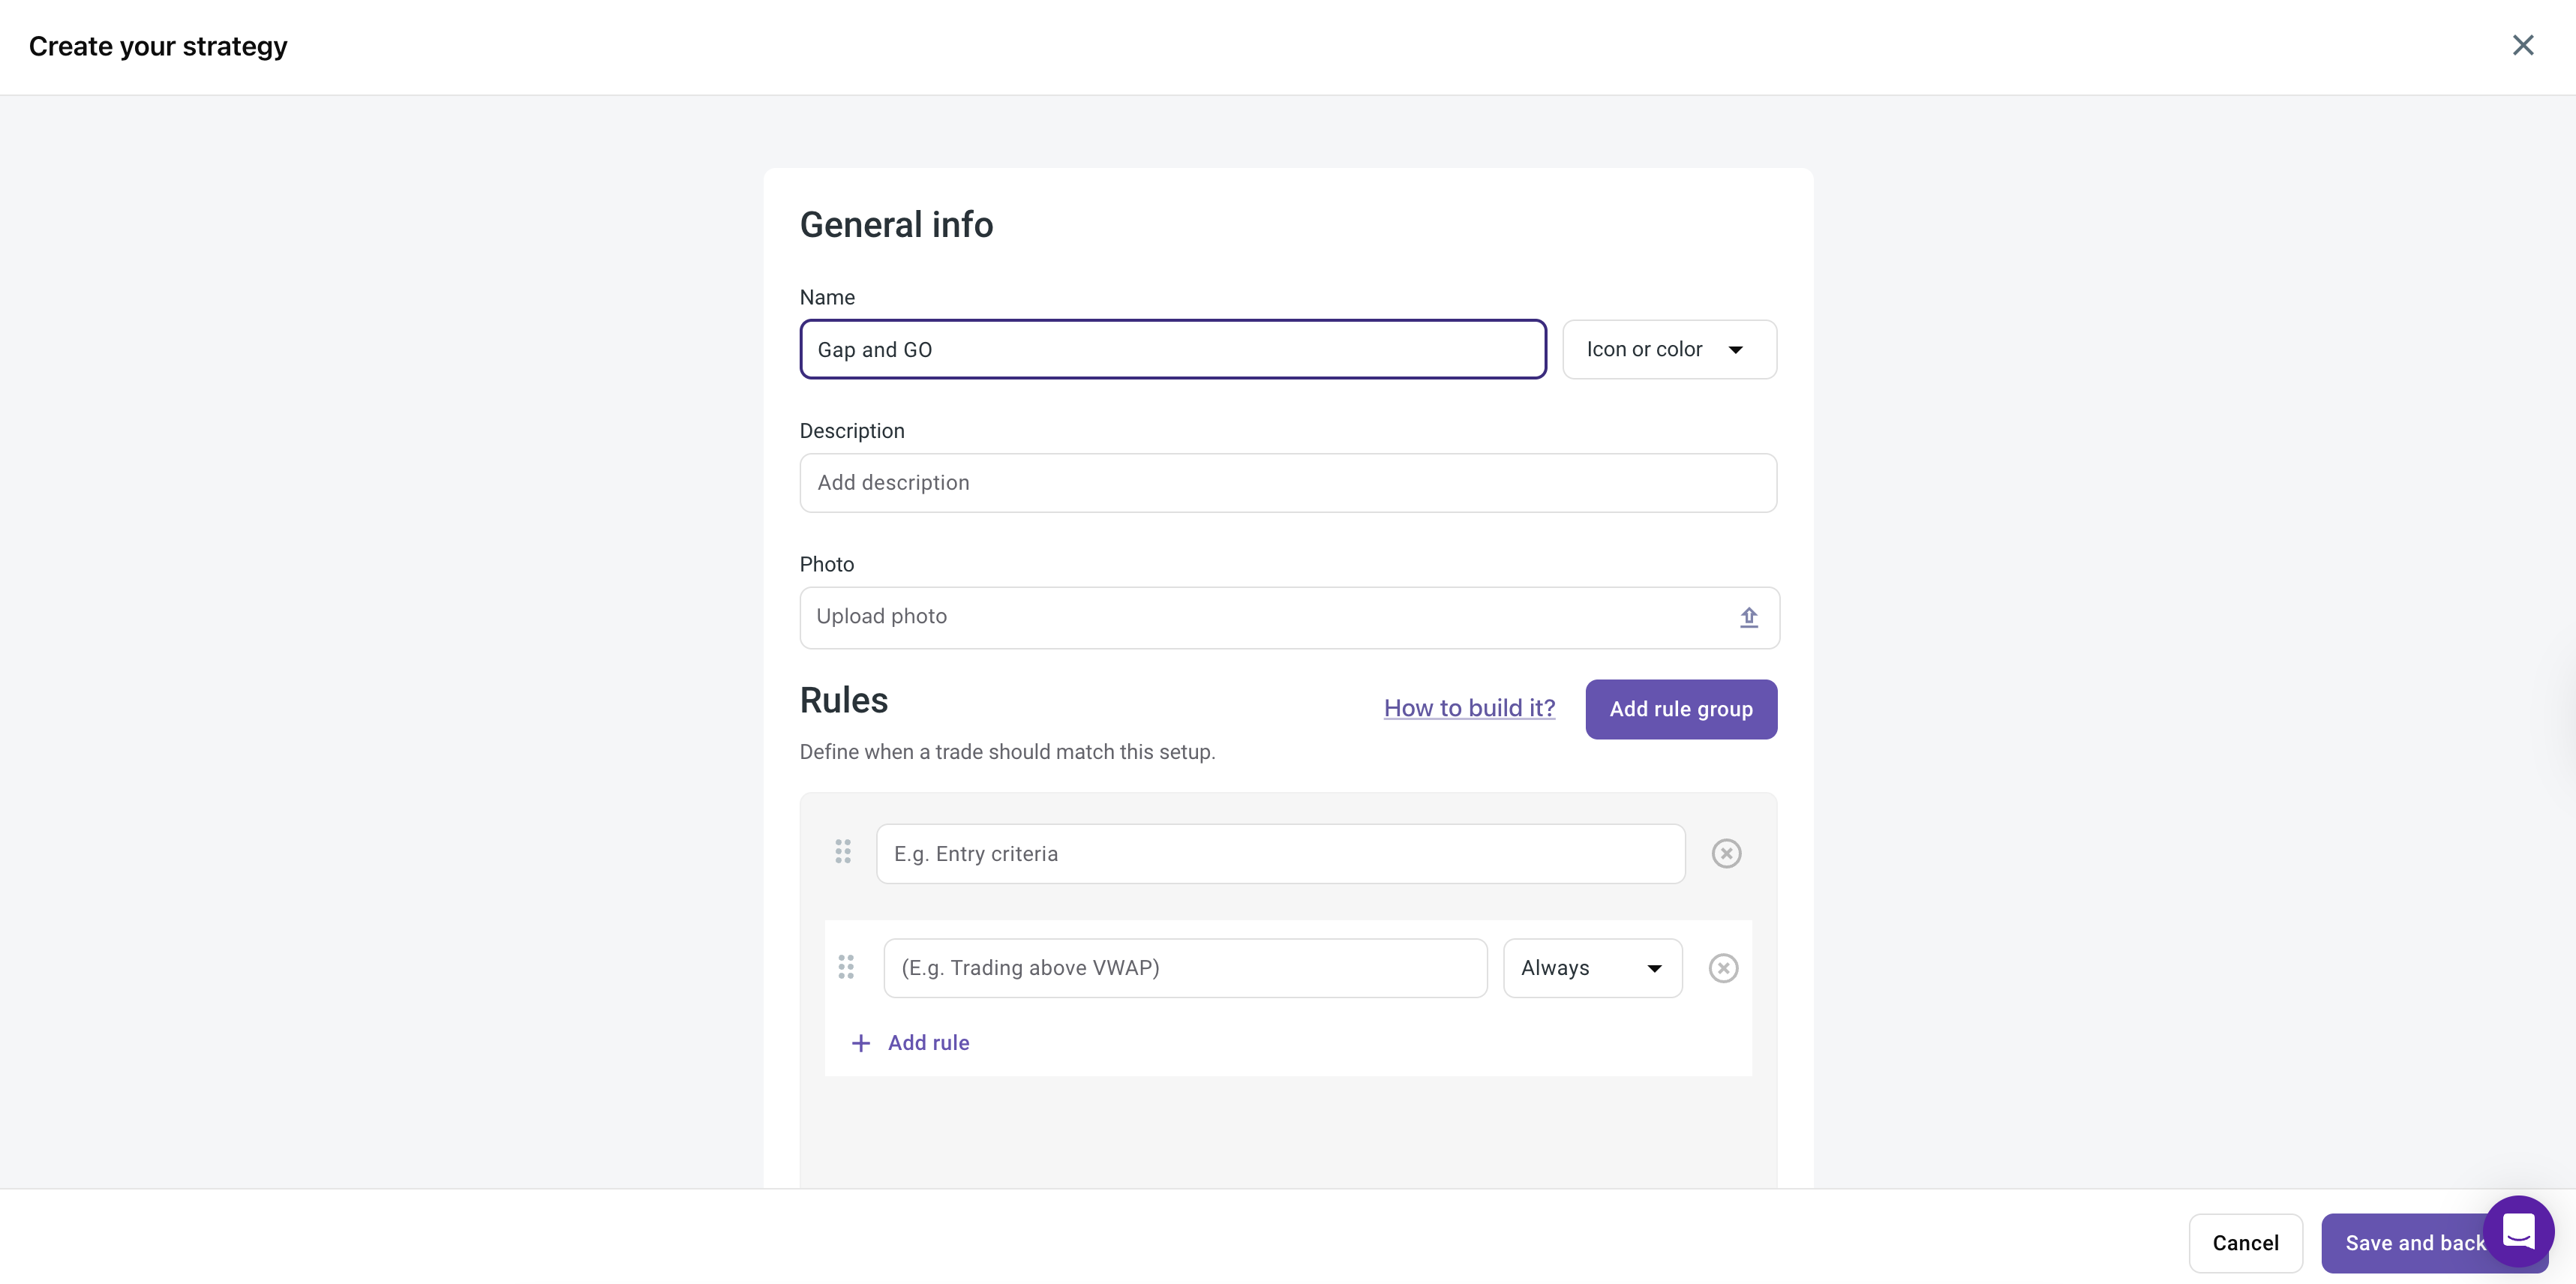
Step 1: Create a Gap and Go Strategy
In TradeZella, create a dedicated Strategy called "Gap and Go" with your gap entry criteria, stop rules, and target rules. Be specific in the description: "2%+ gap, catalyst required, 3x relative volume, opening range breakout or VWAP hold." This forces you to define your rules before trading, which is the foundation of trading discipline.
Assign every gap trade to this Strategy. After 20 or more trades, your analytics show your actual win rate and profit factor on Gap and Go specifically, separate from all your other trading.
TradeZella Strategy
Step 2: Tag Every Gap Trade
Tags turn raw trade data into filterable intelligence. Create custom tags for each dimension of gap trading that might affect your results:
With Zella AI's Auto Trade Tagger, you can define tagging criteria once and the agent applies tags automatically to every trade. Set it to tag gap size ranges and entry method based on your trade data. No manual tagging after each trade.
Step 3: Filter and Find Your Edge
After 30 or more gap trades, filter your data. Here is what you are looking for:
Filter by gap size. You might discover that 3% to 5% gaps produce your best results (1.8 profit factor) while gaps over 7% produce a profit factor below 1.0 because they attract profit-taking. If that is your data, stop trading 7%+ gaps regardless of how exciting they look in the pre-market scan.
Filter by catalyst type. Earnings gaps might show a 58% win rate while analyst upgrade gaps show 41%. That is not a small difference. Over 100 trades, the earnings filter alone could add $3,000 to your account on a $50,000 account with $500 risk per trade.
Filter by entry method. The opening range breakout might show more trades but a lower win rate (45%) compared to the VWAP hold (55% win rate, fewer trades). Calculate trading expectancy for each method: if the VWAP hold has higher expectancy per trade but you only get two signals per week while the opening range gives you eight, the opening range might still produce more total profit.
Filter by time of entry. TradeZella's Day and Time report shows your P&L by time of entry. You might discover that your gap trades entered before 9:45 AM produce positive expectancy while trades entered after 10:00 AM are breakeven or negative. That is a clear rule: no Gap and Go entries after 10:00 AM.
This is exactly the process described in the trading edge guide: log trades, filter by setup, filter by time, filter by conditions, write an Edge Statement. Your Gap and Go Edge Statement might look like: "I trade 3-5% earnings gaps using the opening range breakout before 9:45 AM. Win rate: 52%. Profit factor: 1.7. Average winner: +1.8R."
Step 4: Backtest New Variations
When you want to try a new Gap and Go variation (different gap size range, different entry method, adding a MACD filter), backtest it before risking real capital. In TradeZella, the backtesting feature lets you test strategies against 11 or more years of historical data.
Define your gap criteria and rules, run the backtest, and look for a profit factor above 1.3 on at least 50 simulated trades. If it passes, forward-test at reduced size (25% to 50% of normal position) for 20 to 30 live trades. If forward-test results are within 15% to 20% of backtest results, scale to full size. See how to backtest a trading strategy for the complete step-by-step process, or backtest with TradeZella for the product-specific walkthrough.
Step 5: Weekly Review
Every Sunday, spend 20 minutes reviewing your Gap and Go trades from the week. Use your trade review process to answer four questions:
Which gap trades followed my rules exactly? (Filter by "Rules Followed" tag)
Which gap trades deviated from my plan? (Filter by "Rules Broken" tag, check if I chased, held too long, or sized incorrectly)
What was my Gap and Go profit factor this week versus my rolling average?
Did any gap type or catalyst produce notably different results?
Zella AI's Session Review agent can automate most of this. Configure it to compare your actual gap trades against your morning plan and flag deviations. The review generates automatically after each session. You read the output in 5 minutes instead of spending 30 minutes writing a manual review.
What Are the Most Common Gap and Go Mistakes?
Gap and Go failures follow predictable patterns. Here are the five mistakes that cost gap traders the most money, with the data signatures that reveal them in your journal.
1. Chasing extended gaps. If the stock already ran 3% beyond the gap price before your entry, you are buying at the worst possible time. Data signature: your entries on these trades show a negative average R-multiple. The stop is too far from entry because you entered late, and the target is too close because the stock already made most of its move. Cost on a $50,000 account: $200 to $400 per chased trade in slippage and poor risk-reward ratio.
2. Trading every gap. Most days have 20 or more gappers but only two to three meet all criteria from the filter checklist. This is overtrading applied specifically to Gap and Go. The fourth and fifth gap trades of the day almost always have lower quality than the first two. Tag your trades by sequence number ("Gap Trade 1", "Gap Trade 2", "Gap Trade 3+") and check the data after a month. You will likely find that trades 3 and above are breakeven or negative.
3. Holding too long. Gap and Go is a 30 to 90-minute strategy. Holding a gap trade through lunch turns it into a swing trade without a swing trade thesis. Data signature: your longest-held gap trades have the worst R-multiples. Set time-based exits and honor them.
4. Ignoring the overall market. A bullish gap trade into a market selling off hard faces headwinds. Check SPY or QQQ direction before entering. If the index is gapping down while your stock is gapping up, the gap needs to be significantly stronger (5%+ with heavy volume and a major catalyst) to overcome the market headwind. Add a "Market Direction" tag (bullish, bearish, mixed) to every gap trade. After 50 trades, filter by market direction. You may find that your Gap and Go win rate drops 15 percentage points on days when the market is against you.
5. Revenge trading after a failed gap. A gap trade stops out in 10 minutes. The loss is fast and feels undeserved. The emotional response is to find another gap immediately and "make it back." This is the FOMO trading to revenge trading cascade, and it is amplified on gap trades because the moves happen so quickly. Your daily trade limit (2 to 3 gap trades maximum) exists specifically to prevent this. If your first gap trade stops out, take 10 minutes before scanning for the next one.
Use TradeZella's tag analytics to track trading habits across these mistake categories. Create tags for "Chased Entry", "Overtraded", "Held Too Long", "Against Market", and "Revenge Gap." Calculate the monthly cost of each mistake. Fix the most expensive one first.
How Does Gap and Go Fit Into Your Trading Plan?
Gap and Go should be one section of your broader trading plan, not your entire plan. Define it as a Strategy with specific rules:
When I trade it: First 90 minutes of the session only. Maximum 2 to 3 trades per day.
What I look for: 2%+ gap, catalyst required, 3x relative volume, breakaway or continuation gap type.
How I enter: Opening range breakout or VWAP hold (specify which method you prefer based on your data).
How I manage risk: 1% risk per trade, stop at opposite side of opening range or below VWAP, 50% off at 2R, trail the rest.
When I stop: After 3 gap trades, after hitting daily loss limit, or after 10:30 AM, whichever comes first.
Your morning routine starts with the pre-market scan at 8:00 to 8:30 AM ET. Narrow to three to five candidates by 9:15 AM. At 9:30, focus on the one to two best setups. Zella AI's Market Sentiment Briefing can generate your pre-market plan based on how you trade, including the gap criteria and assets you have configured.
Key Takeaways
Gap and Go trades in the direction of a significant opening gap, capturing momentum in the first 30 to 90 minutes of the session.
Gap selection is everything. Filter for 2%+ gaps with a clear catalyst, high pre-market volume, and 3x or higher relative volume at the open.
Two entry methods: the opening range breakout (aggressive, more trades) and the VWAP hold (conservative, higher probability). Your journal data will show which works better for you.
Breakaway and continuation gaps are the best candidates. Avoid exhaustion gaps (trap after extended runs) and common gaps (no catalyst, likely to fill).
Position size from your stop distance. On a $50,000 account with $500 risk, wider stops mean fewer shares and tighter stops mean more shares. The dollar risk stays constant.
Maximum two to three gap trades per day. Set a daily loss limit of 3% and honor it, especially after a fast stop-out.
Create a dedicated Gap and Go Strategy in TradeZella. Tag every trade by gap size, catalyst, entry method, and gap type. After 30 or more trades, filter to find which conditions produce your highest profit factor.
Backtest new variations before trading them live. Forward-test at reduced size. Scale only after confirming results match backtest expectations.
Frequently Asked Questions
What time should I start watching for Gap and Go setups?
Start your scan at 8:00 to 8:30 AM ET when pre-market volume data becomes meaningful. Narrow your watchlist to three to five candidates by 9:15 AM. At 9:30 AM when the market opens, focus on the one to two stocks that best match your filter checklist. Most Gap and Go moves play out by 10:00 to 10:30 AM, so your active trading window is roughly 60 minutes.
Does the Gap and Go strategy work on forex or crypto?
Gap and Go works best on individual stocks because equity gaps are driven by specific catalysts like earnings, news, and analyst ratings. Forex gaps mainly occur at the Sunday night open when liquidity returns after the weekend, and these gaps tend to fill quickly. Crypto spot markets trade 24 hours a day and 7 days a week, so traditional gaps are rare. Crypto futures on regulated exchanges can gap at the session open, but the setups are less frequent and less reliable than stock gaps.
How do I tell if a gap will continue or fade?
Volume is the strongest signal. A gap with 3x or higher relative volume and a clear catalyst is more likely to continue. Low volume with no identifiable news is more likely to fade within the first hour. Gap type matters too: breakaway gaps out of consolidation have the highest follow-through rate, while gaps after three or more consecutive gap days are more likely exhaustion gaps that reverse. Your journal data will show your personal accuracy at reading continuation versus fading over time.
What is the ideal gap size for Gap and Go?
Gaps between 3% and 7% tend to produce the best risk-adjusted returns for most traders. Gaps under 2% lack sufficient momentum for meaningful follow-through. Gaps over 10% attract early profit-taking, which increases the chance of a sharp pullback that stops you out before the move continues. However, your personal data may show a different sweet spot. After 30 or more gap trades tagged by size, filter your results. Some traders find their edge concentrated in 4% to 6% gaps while others do better on 2% to 4% gaps.
Should I trade gaps on both the long and short side?
Start with one direction. Most Gap and Go traders begin with gap-up longs because bullish momentum is more intuitive and short selling adds complexity (borrow availability, short squeeze risk, uptick rules). After you have 50 or more profitable gap-up trades logged and reviewed, you can test gap-down shorts. Create a separate Strategy in TradeZella for "Gap and Go Short" so your analytics stay clean. Compare profit factor and win rate across both strategies before committing to trading both directions full size.
How many gap trades should I take per week?
Quality gaps that meet all criteria appear two to four times per week on average. Some weeks have zero. Some weeks have eight. Your trade limit is two to three per day, not per week. If Monday produces three excellent gap setups and Tuesday has none, take three on Monday and zero on Tuesday. Do not force trades on slow days to hit a weekly quota. Track your weekly gap trade count in TradeZella's Calendar view. Over time, you will see whether your most profitable weeks correlate with more trades or fewer.