


Built For
Instruments: Futures
Trading Style: Scalping
Strategy Overview
Fair Pricing Theory is built around a simple idea: price can temporarily move away from what the market considers fair value, creating opportunities to trade both the move away from fair price and the move back toward it.
The strategy uses important market events, mainly session opens and scheduled news, to establish a fair price. When new volume enters the market, price can displace strongly away from that level. The goal is to identify whether that move is likely to continue or whether price is beginning to revert back toward fair value.
The strategy focuses on two main opportunities:
Continuation: Trading the initial move away from fair price when momentum and structure support it.
Reversion: Trading price back toward fair value after the initial move becomes extended and a reversal is confirmed.
A typical sequence looks like:
Fair Price → Displacement → Continuation → Reversion Toward Fair Price
The strategy is mainly executed on the 1-minute chart, with entries confirmed through either a Displacement Candle or a Break of Structure.
Understanding Fair Price
The first step is identifying the price that currently represents fair value.
Fair price is not a permanent support or resistance level. It changes depending on the event currently affecting the market.
During a normal New York session, the 9:30 AM opening price can act as the initial fair price. When the market opens, a large increase in volume can push Nasdaq quickly away from this level.
That initial move can create the first continuation opportunity. Once price becomes extended from the opening price, the same level can later become the target for a reversion trade.
For example, if Nasdaq opens at 20,000 and quickly moves higher, 20,000 remains the reference fair price. The strategy may first look for a continuation long and then, once momentum shifts, look for a short back toward the 20,000 opening price.
Fair price is always reassessed as the session develops. If market conditions change, the trader should not continue targeting an old fair price simply because it was relevant earlier.
Two Main Trade Types
The strategy separates price movement into two main opportunities: continuation and reversion.
1. Continuation
The continuation setup looks to participate in the initial move away from fair price.
At the New York open, for example, the sudden increase in volume can create a strong directional candle. If that move breaks previous structure and aligns with the broader directional bias, the strategy can look for an entry in the same direction.
The higher-timeframe bias discussed in the strategy looks at approximately the previous 6 to 12 hours of price action. The idea is to understand the larger move before deciding whether the opening displacement supports a continuation.
The opening candle alone is not enough. The move should show meaningful displacement and break relevant structure.
2. Reversion
After price moves away from fair value, the strategy begins looking for an opportunity to trade back toward it.
The trader does not enter simply because price looks overextended. Price must first confirm that momentum is shifting.
Two entry models are used for this confirmation:
- Displacement Candle
- Break of Structure
Once one of these confirmations appears in the direction of fair price, the trader can look for the reversion entry.
Entry Model 1: Displacement Candle
A Displacement Candle is used to identify a strong short-term shift in momentum.
A valid displacement candle should have a larger body than the previous candle, close beyond the previous candle’s wick, and displace an opposite-colored candle.
For a bullish setup, a strong bullish candle should displace a bearish candle and close above its wick.
For a bearish setup, a strong bearish candle should displace a bullish candle and close below its wick.
The candle must fully close before the entry is confirmed. A wick through the previous candle is not enough.
This entry is mainly used on the 1-minute timeframe, allowing the trader to identify the momentum shift relatively early.
Entry Model 2: Break of Structure
The Break of Structure entry waits for a clearer change in short-term market structure.
For a bullish setup, price should close above a meaningful previous swing high. For a bearish setup, price should close below a meaningful previous swing low.
The structure should be clearly visible rather than a very small or insignificant swing. The more obvious the structure, the stronger the confirmation.
The candle must close through the structure. A wick through the level does not count as confirmation.
JJ describes the Break of Structure setup as slightly stronger than the basic Displacement Candle entry, which is why it becomes particularly useful when taking more selective trades on funded accounts.
New York Session Open Setup
The New York open is one of the main ways Fair Pricing Theory is applied.
At 9:30 AM ET, the opening price becomes the initial fair price. The increase in volume at the market open can cause Nasdaq to move quickly away from this level.
The first opportunity is the continuation trade.
If the opening move shows strong displacement, breaks previous structure, and agrees with the broader directional bias, the trader can look to trade in the direction of that move.
Once the initial move has developed, the focus begins to change. Instead of continuing to chase price away from the open, the trader starts looking for signs that price may revert back toward the 9:30 fair price.
The process can look like:
9:30 Fair Price → Opening Move → Continuation → Momentum Shift → Reversion Toward 9:30
The reversion still requires confirmation. A Displacement Candle or Break of Structure should form in the direction of the opening price before the trade is taken.
This means the strategy can trade both directions during the same session. A trader may first participate in the continuation away from fair price and later trade the reversion back toward it.
Higher-Timeframe Bias
Although entries are mainly taken on the 1-minute chart, the strategy also considers the larger move that developed before the session open.
JJ discusses looking back approximately 6 to 12 hours to understand the previous directional move. The general idea is to consider whether that previous move may begin reverting as the new session develops.
A 5-minute chart can also be used to make the larger structure easier to see, although the same context can be studied by looking further back on the 1-minute chart.
The higher-timeframe view provides context. The actual entry still comes from the lower-timeframe confirmation.
Scheduled News Reversion
Scheduled economic releases create another important application of Fair Pricing Theory.
Examples discussed in the strategy include CPI and PPI releases around 8:30 AM ET.
For expected news, the price immediately before the announcement can be treated as the fair price. Under JJ’s theory, the market already knows the event is coming and has access to forecasts before the release.
When the announcement occurs, the sudden reaction can create a large displacement away from the pre-news price.
Instead of immediately fading that move, the trader waits for evidence that price is beginning to revert.
The setup becomes:
Pre-News Fair Price → News Displacement → Wait for Confirmation → Displacement/BOS → Reversion Toward Pre-News Price
If a valid Displacement Candle or Break of Structure forms back toward the pre-news price, the trader can use that confirmation for the reversion entry.
Expected-news reversion is described as one of the stronger setups within the framework.
The important part is that the trade is not entered simply because the news candle is large. The market must still provide a valid entry signal.
When Pre-News Price Overrides the 9:30 Open
On major news days, the pre-news fair price can remain more important than the normal 9:30 opening price.
For example, CPI may be released at 8:30 AM and cause a large move away from the pre-news level. When the market opens at 9:30, price may immediately begin moving back toward that earlier price.
In this situation, the trader can continue treating the pre-news price as the main fair price rather than automatically replacing it with the 9:30 opening price.
The important question is which event is currently driving the market.
If the news move is still controlling price behavior, the pre-news price can remain the more relevant reversion target.
Unexpected News
Unexpected news is handled differently because the market did not have the opportunity to price the information beforehand.
This could include an unexpected announcement, speech, comment, tweet, or another event that suddenly introduces new information.
A large move caused by unexpected news can genuinely change what the market considers fair value. Because of this, the strategy does not automatically expect price to return to where it was before the event.
Instead, the trader allows the initial move to develop and then watches for a new consolidation.
That consolidation can become the new fair price.
The sequence may look like:
Unexpected News → Strong Price Move → New Consolidation → New Fair Price
Once the new fair price is established, the same continuation and reversion framework can be applied around that new level.
Unexpected News Continuation
Unexpected news can also produce a strong continuation opportunity.
If genuinely new information causes price to move aggressively in one direction, the strategy can participate in that momentum instead of immediately trying to fade it.
This type of continuation is less mechanical than the standard prop firm setups.
Rather than always using a fixed profit target, the trader can allow the move to continue until market structure begins breaking in the opposite direction.
For a bullish continuation, the position can remain open while bullish structure continues. If price later closes below meaningful structure, that can signal that the move is weakening.
For a bearish continuation, the same idea applies in reverse.
The goal is to avoid fighting a market that is actively repricing because of new information.
Continuation and Reversion Cycle
One of the main ideas behind the strategy is that price can repeatedly move between continuation and reversion.
A move begins from fair price and creates displacement. Price may continue in that direction before eventually reverting. After the reversion, another directional move can develop.
This creates a repeating process:
Continuation → Reversion → Continuation → Reversion
The trader’s job is not to assume which one must happen next. The goal is to identify the current phase and wait for the appropriate confirmation.
This is also why the fair price must remain flexible throughout the session.
When Fair Price Changes
Fair price should not remain fixed throughout the entire trading day.
For example, the 9:30 opening price may be highly relevant during the first part of the New York session, but that does not mean it should still be treated as the main target several hours later.
A fair price may need to change when the market receives unexpected information, forms a new consolidation, develops a strong trend, or repeatedly fails to revert toward the previous level.
If the market continues moving away from the old fair price and reversion trades repeatedly fail, that can indicate that the market is establishing value somewhere else.
Unexpected news can make this change happen much faster. In that situation, the consolidation that develops after the news move can become the new fair price.
The strategy therefore requires the trader to continuously reassess whether the current fair price still makes sense.
Three-Loss Rule
The Three-Loss Rule helps prevent repeatedly trading against a strong trending market.
If three reversion trades fail consecutively during the same session, the trader stops attempting reversion trades for that session.
The reasoning is that three failed attempts to return toward fair value can indicate that the market is not behaving like a normal reversion session.
Instead, price may be trending and establishing a new fair value.
This rule prevents the trader from continuing to fade the same move simply because price appears extended.
Session Timing
The strategy focuses heavily on the beginning of major trading sessions because this is when new volume enters the market.
JJ discusses trading approximately the first 90 minutes of a session.
For the New York session, the main window is approximately:
9:30 AM to 11:00 AM ET
The same Fair Pricing Theory can also be applied around other major sessions, including Asia, London, and the New York afternoon session.
The logic remains similar. Identify the session’s relevant fair price, observe the initial displacement, and then determine whether the market is offering continuation or reversion.
The period from approximately 11:00 AM to 2:00 PM is described as a lower-volume part of the trading day.
Around 2:00 PM, new participation can enter the market again. Depending on the day’s structure, this can create another continuation or reversion opportunity.
Risk-to-Reward
Risk management changes depending on the type of account being traded.
For prop firm evaluations, the strategy uses a more mechanical approach.
One example discussed is:
25-Point Stop → 38-Point Take Profit
This gives approximately a 1:1.5 risk-to-reward ratio.
If volatility is much higher and the opening candle is larger than the normal 25-point range, the stop and target can be expanded.
For example:
50-Point Stop → 76-Point Take Profit
However, if the distance is doubled, the number of contracts can be reduced by half.
This keeps the total dollar exposure approximately the same.
The important principle is not using the same number of contracts regardless of volatility. Position size and stop distance work together to control the amount of money being risked.
Prop Firm Risk Management
The risk-management model is designed specifically around prop firm accounts.
Instead of always placing the stop at a traditional technical invalidation point, the stop distance can be determined by the account model and historical testing.
Distances discussed include approximately 25, 37.5, 50, and 75 points, depending on the setup and account.
The profit target can also be selected based on what works best for the account rules.
This makes the approach different from traditional chart-based risk management. The strategy setup identifies the trade, while the account model determines how that trade should be sized and managed.
Evaluation Accounts
Evaluation accounts are approached mechanically because the primary objective is to pass the evaluation while staying within the firm’s rules.
A typical evaluation setup may use a static risk-to-reward ratio around 1:1.5.
More valid Displacement Candle entries can also be taken during evaluations because the approach is based on repeatedly applying the tested statistical model.
The goal is not necessarily to maximize the profit from every individual trade. The goal is to use a repeatable process that has been tested against the evaluation rules.
Funded Accounts
Funded accounts are approached more selectively.
Instead of taking every valid displacement, stronger Break of Structure entries can be prioritized.
Targets can also change depending on the firm’s payout rules.
On an account without restrictive consistency rules, a strong setup may be allowed to target 50, 75, 100 points or more if the distance toward fair price supports the move.
On an account with consistency requirements, smaller and more repeatable wins may be preferable. A very large winning day can make it more difficult to satisfy the firm’s payout consistency requirements.
Because of this, the same trading setup can be managed differently depending on the account being traded.
Layering Trades Across Accounts
When managing multiple prop firm accounts, JJ also uses a concept called layering.
Instead of placing every account into the same entry at the same time, different valid setups can be assigned to different accounts.
For example, a Displacement Candle may provide the first valid entry. That trade can be taken on one account.
If price later provides a stronger Break of Structure entry, that second setup can be taken on another account.
This spreads the trades across multiple valid opportunities rather than exposing every account to the exact same outcome.
Layering is mainly an account-management technique rather than a separate trading setup.
Backtesting for Prop Firm Accounts
Backtesting for a prop firm strategy is different from simply testing how much money a strategy would have made on a normal trading account.
JJ focuses on evaluation pass rate.
The important question becomes:
How often would this strategy successfully pass the evaluation under the firm’s actual rules?
The backtest should therefore include the profit target, drawdown rules, consistency requirements, and other restrictions of the specific evaluation.
For example, if an evaluation costs $100 and the strategy historically passes 25% of the time:
$100 ÷ 25% = $400
The estimated average cost of obtaining one funded account would therefore be approximately $400.
That cost can then be compared with the expected payout value of the funded account.
JJ recommends running approximately 50 evaluation backtests to develop a more useful estimate of the pass rate and reduce the effect of small-sample variance.
The purpose is to evaluate the entire prop firm model rather than only the entry strategy.
Live Account vs Prop Firm Trading
The strategy would be managed differently on a personal live trading account.
The fixed stop distances and mechanical profit targets discussed throughout the framework are largely designed around prop firm rules.
On a live account, JJ says he would focus more heavily on the strongest parts of the strategy, particularly reversions, Break of Structure entries, and expected-news reversions.
Risk and profit targets could then be based more directly on current market structure instead of being optimized around an evaluation target or payout requirement.
This distinction is important because Fair Pricing Theory provides the market setup, while the prop firm model determines how that setup is managed within a specific account.
Complete Trading Process
The process begins by identifying the event currently driving the market.
At a normal session open, mark the opening price as the initial fair price. For scheduled economic news, mark the price immediately before the announcement. If unexpected news occurs, allow the market to establish a new consolidation before defining the new fair price.
Next, observe how price moves away from that level.
If the initial move shows strong displacement and breaks relevant structure, a continuation opportunity may develop.
Once price becomes extended from fair value, stop chasing the move and begin watching for a potential reversion.
Wait for either a valid Displacement Candle or a confirmed Break of Structure pointing back toward fair price.
The entry is taken only after the confirmation candle closes.
From there, manage the position according to the type of account being traded. Evaluation accounts generally use more mechanical stops and targets, while funded and live accounts can be more selective.
If three consecutive reversion trades fail during the same session, stop attempting reversions and reassess whether the market has established a new fair price.
The full process can be summarized as:
Identify Fair Price → Observe Displacement → Trade Continuation → Wait for Momentum Shift → Confirm Reversion → Target Fair Price → Reassess
Strategy Rules
The strategy should always begin with a clearly defined fair price. The trader should understand why that price is relevant before looking for an entry.
Do not enter a reversion simply because price has moved far away from fair value. Wait for a valid Displacement Candle or Break of Structure.
A valid Displacement Candle should have a larger body than the previous candle, close beyond the previous wick, and displace an opposite-colored candle.
A Break of Structure requires a candle to close through meaningful local structure. A wick through the level is not enough.
For scheduled news, the pre-news price can act as fair value. For unexpected news, allow the market to establish a new consolidation before defining the new fair price.
Do not continue targeting an old fair price if the market shows that value has shifted.
After three consecutive failed reversion trades during the same session, stop attempting reversion trades for that session.
Keep total dollar exposure controlled when adjusting stop distance and position size.
For prop firm trading, adjust the risk model and profit target according to the specific evaluation, funded-account, and consistency rules.
Trade Breakdown
Trade Example 1: CPI News Reversion
This trade takes place during an 8:30 AM CPI release and shows how Fair Pricing Theory is used to trade a reversion after scheduled news.
Before the CPI release, the pre-news price is marked as fair price. Once the news is released, price makes a strong move higher and moves away from that level. The objective is not to chase the move or immediately enter against it. Instead, the strategy waits for confirmation that price is beginning to move back toward the pre-news fair price.
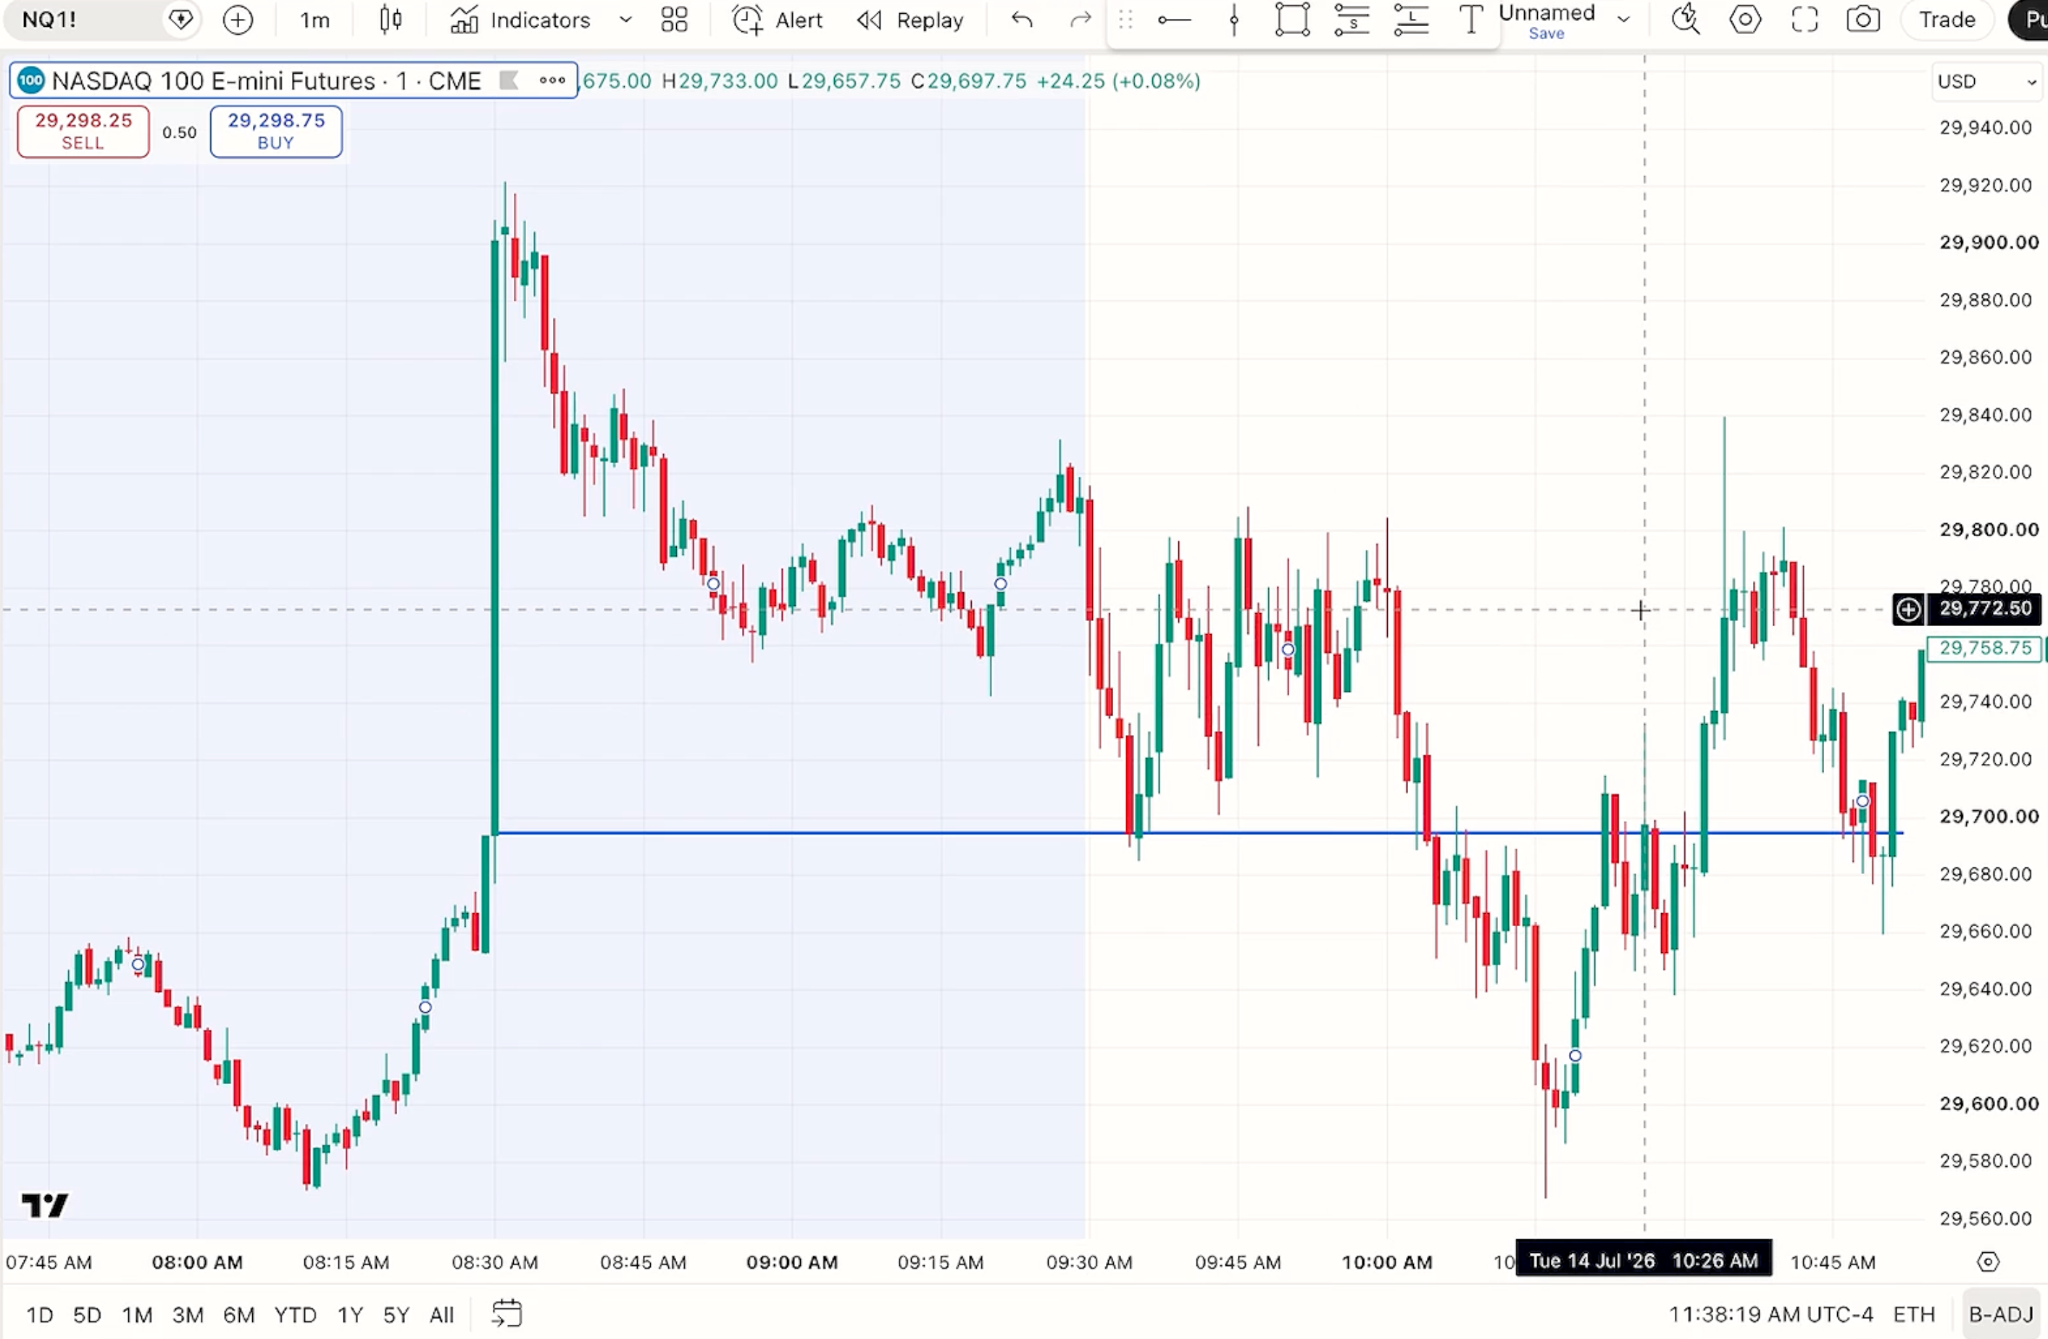
The first potential entry is not a valid Displacement Candle. Although the candle body is larger than the previous candle’s body, it does not close below the previous wick. Since both conditions are not met, no trade is taken.
Price then creates a clear short-term structure low. When a candle closes below that structure, it confirms a bearish Break of Structure and provides the short entry. The target is the pre-news fair price below.
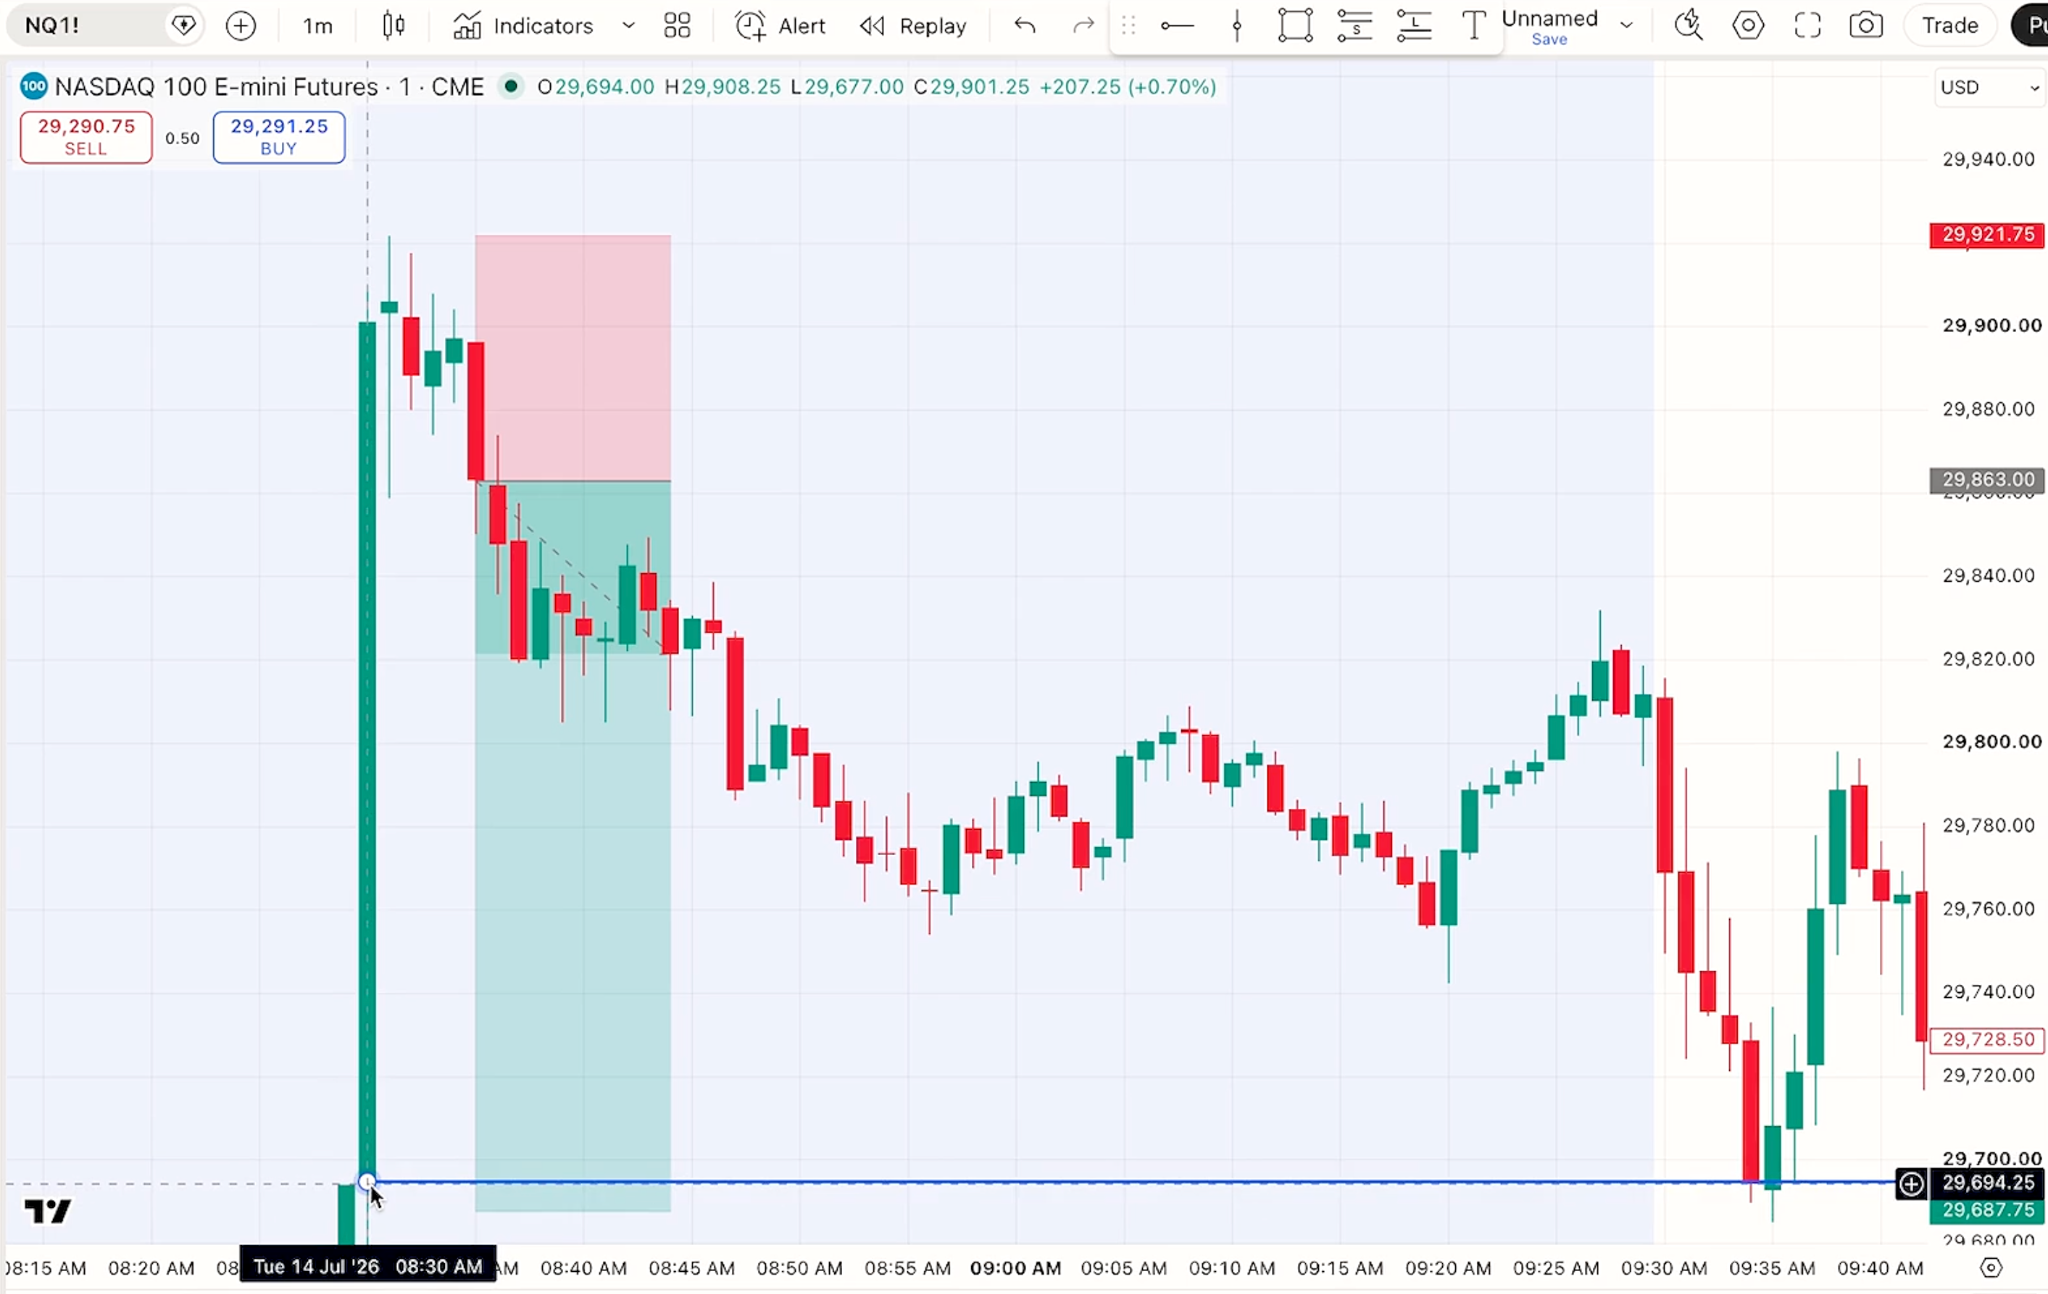
Trade Setup:
- Event: 8:30 AM CPI release
- Fair Price: Pre-news price
- Direction: Short
- Entry Confirmation: Bearish Break of Structure
- Target: Pre-news fair price
- Timeframe: 1-Minute
The Break of Structure is confirmed only when the candle closes below the identified structure. A wick through the level alone is not enough. Smaller intraday structures can be used for the entry, but a more obvious structure provides stronger confirmation.