

Built For
Instruments: Stock
Trading Style: Swing Trading
Strategy Overview
This strategy is built around understanding the full price cycle of a stock rather than trading isolated breakout or breakdown patterns.
The long side focuses on strong stocks moving through an uptrend, pullback, consolidation, and continuation phase. The short side looks for those same types of leaders once their bullish cycle begins to weaken and transition into a failed base or downtrend.
Long setups are built around relative strength, tightening price action, declining volume, and support around the 10-day and 20-day EMAs. Entries can come from either a confirmed breakout or a controlled pullback into support.
Short setups develop when former leaders fail to continue higher. A failed breakout, 20-day EMA violation, weak recovery, and rejection around the moving averages can signal that the stock is transitioning into a bearish phase.
The approach is intentionally simple, relying mainly on price, volume, moving averages, relative strength, market context, and clearly defined risk.
The Price Cycle
Stocks are viewed as moving through a broader cycle rather than one individual setup.
A typical bullish sequence is:
Uptrend → Pullback → Wedge Pop → Cross Back → Base → Breakout → Trend Continuation
As the move matures, that same stock can transition into:
Failed Breakout → 20 EMA Violation → Weak Rally → Breakdown → Downtrend
This creates opportunities on both sides of the cycle. A stock that was previously on the long watchlist can eventually become a short candidate once its behavior changes.
Stock Selection
Before focusing on the exact setup, the stock should have the right liquidity, volatility, and relative-strength characteristics.
Average daily dollar volume should generally be around $50 million or more, providing enough liquidity to enter and exit efficiently.
ADR should typically be above 3%, showing that the stock is capable of making meaningful moves in a relatively short period.
Relative strength is also important. If the broader market is declining while a stock is holding sideways or moving higher, it may be showing early leadership.
The surrounding industry group also matters. A setup is more attractive when other stocks within the same group are showing similar strength.
Main Selection Criteria
- Average daily dollar volume around $50M+
- ADR generally above 3%
- Strong relative strength versus the market
- Strength within the stock’s industry or group
- Enough volatility to create favorable risk-to-reward
Long Setup
1. Start With a Strong Uptrend
The long setup is primarily a continuation strategy.
Look for a stock that has already demonstrated bullish characteristics such as higher highs, higher lows, and strength above its longer-term moving averages.
The 200-day moving average provides broader trend context, while the 10-day and 20-day EMAs are more important during the actual setup.
Some of the strongest opportunities can develop when a leader begins correcting alongside the broader market but continues to hold up better than the index.
2. Wedge Pop
During the correction, price may begin trading around or below the short-term moving averages.
The first sign of renewed demand is the wedge pop, where price starts pushing back through the 10-day and 20-day EMAs.
Ideally, this move happens with a noticeable increase in volume.
The volume expansion suggests that demand is returning and that the stock’s character may be shifting back toward the bullish side.
The wedge pop is not necessarily the entry itself. It is the first clue that the continuation setup may be developing.
3. Cross Back and Base Formation
After the wedge pop, price can pull back toward the 10-day and 20-day EMAs.
The pullback should remain controlled.
Instead of immediately breaking down, the stock begins moving sideways and building a base around the moving-average area.
As the base develops, the daily candles should become tighter and overall volatility should begin to decrease.
This is where the setup starts to mature.
4. Volatility Contraction
The contraction phase is one of the most important parts of the long setup.
Price begins to bunch up tightly while volume gradually dries up.
This suggests that there is limited supply entering the market.
At the same time, the stock should continue showing relative strength. For example, if the market pulls back while the stock remains sideways, that is a positive sign.
The ideal setup starts to resemble a launchpad:
- Tight price action
- Declining volume
- Strong relative strength
- Price holding around or above the 10 and 20 EMA
- Clear resistance forming above the base
That resistance becomes the potential breakout level.
Long Entry 1: Buying Strength
The first entry method is to buy the stock as it breaks above the consolidation.
The setup is identified on the daily chart, while execution takes place on the 5-minute chart.
The preferred breakout shows price pushing through the resistance level with improving volume.
Entry
Buy through the defined breakout level.
Stop
The stop can be placed below the current day’s low or the previous day’s low.
A small buffer may be used below the exact level to avoid being stopped by minor noise.
The goal is to establish a clearly defined risk before entering the trade.
Long Entry 2: Buying Weakness
The second entry method is more anticipatory and can be useful when the market is choppy and breakouts are more likely to fade.
Instead of waiting for price to clear resistance, the entry comes from a controlled pullback toward the daily moving averages.
The daily structure must still be bullish.
On the 5-minute chart, price may open higher, fade toward the daily 10 EMA or another important support area, and then begin turning higher.
Intraday tools such as VWAP, shorter-term moving averages, the 5-minute opening range, and MACD can help confirm momentum, but they are supporting tools rather than the core setup.
Entry
Buy as price begins turning higher from the support area.
Stop
Place the stop below the low of day or below the moving-average support being used.
Because the entry occurs closer to support, the initial risk can be tighter than a breakout entry.
Managing Long Positions
There is no single fixed profit target.
The position is managed based on how far price has moved relative to its normal volatility and whether it continues to respect its moving averages.
First Scale-Out
The first major reference is approximately 2× ADR.
For example, if the stock’s normal daily range is around 5%, a move of roughly 10% represents two times ADR.
At that point:
Take approximately 1/3 of the position off.
This reduces risk while still allowing participation in a larger trend.
After a strong move in favor of the position, the stop can also be moved closer to breakeven.
Second Scale-Out
If the stock becomes extremely extended, another portion can be taken off.
A general reference is when price reaches roughly 8–10 ATR multiples from the 50-day moving average.
At that point: Take another 1/3 off into strength.
Final Exit
The final portion is allowed to continue trending.
The exit depends on which moving average the stock has historically respected.
If the stock consistently respects the 10-day EMA, the remainder can be exited on a daily close below it.
If the stock typically respects the 20-day EMA, that becomes the trailing reference instead.
This allows strong trends to continue without forcing an early full exit.
Long Re-Entries
Long re-entries generally come from a completely new consolidation rather than repeatedly entering the same move.
Wait for another proper volatility contraction or base to form.
For longer sustained advances, weekly bases lasting around six weeks or more can create stronger multi-week continuation opportunities.
The larger the base, the greater the potential for a prolonged move after the breakout.
Short Setup: Late-Stage Failed Base
The short strategy begins when a former leader starts showing signs that its bullish cycle is ending.
This is the late-stage failed base.
A stock may appear to be setting up for another breakout, but instead of continuing higher, the bullish pattern fails.
That failed breakout is the first warning that the character of the stock may be changing.
1. Break of the 20-Day EMA
After the failed breakout, look for price to violate the 20-day EMA.
Ideally, the breakdown happens on increased volume.
The stronger volume suggests that meaningful supply is entering the stock.
Once this happens, the stock moves from a bullish watchlist into a breakdown watchlist.
2. Weak Recovery
Do not automatically chase the first breakdown.
Instead, wait for the stock to attempt a recovery toward the moving averages.
The rally should look weak.
Price may wedge gradually higher while volume remains very low.
That low-volume recovery suggests that buying demand is limited and creates the conditions for another failure.
3. Uppercut and Fail
A preferred short pattern occurs when price pushes slightly above one of the daily moving averages and then fails.
The stock may briefly trade through the 10-day or 20-day EMA before rolling back below it.
This uppercut and fail provides a clear reference point for risk.
If the recovery cannot hold above the moving average, the bearish setup becomes more attractive.
Short Entry
The daily chart defines the setup, while the 5-minute chart is used for execution.
Watch for the intraday rally into the daily moving-average area to begin rolling over.
A loss of intraday VWAP can be used as one possible execution trigger.
Entry
Short as price turns lower after failing around the moving averages.
Stop
Place the stop slightly above the high of day.
A buffer of roughly:
High of day + $0.10 to $0.20
can be used instead of placing the stop exactly at the high.
Because the invalidation point is nearby, the setup can produce very favorable risk-to-reward.
Market Confirmation
The broader market should also be considered.
If the stock is failing while QQQ or another relevant index is also moving lower, the short setup has additional support.
The individual stock is weak while the market is applying pressure in the same direction.
This provides the wind at your back.
Short Invalidation
If price is expected to fail around a moving average but instead closes back above it, the setup is no longer behaving as expected.
That is considered an invalidation.
The predefined stop should be respected rather than continuing to hold based on an opinion of what the stock should eventually do.
Managing Short Positions
Short positions are managed more aggressively than longs.
Downside moves can happen quickly, but they can also reverse sharply.
Because of this, profits are usually taken faster.
First Cover
Look to the left side of the daily chart for previous lows.
These areas often become important cover points because price can undercut an old low and then quickly rally.
If price undercuts a previous low and starts reclaiming it:
Cover approximately 50% of the position.
A larger portion is taken off at the first target on shorts than on longs.
Final Cover
After covering half, monitor the short-term moving averages.
If the stock begins reclaiming the 10-day EMA or the relevant moving-average structure, cover the remaining position.
The goal is to capture the fast downside move without giving back too much profit during a sharp countertrend rally.
Re-Short Opportunities
A developing downtrend can produce several separate short opportunities.
After profits are covered into weakness, price may rally back toward the moving averages.
Once the 20-day EMA begins sloping lower, it can act as resistance.
The next opportunity becomes:
Breakdown → Rally Into EMA → Failure → Re-Short
This allows participation in multiple legs of the bearish cycle without having to hold through every countertrend rally.
Re-Entry Risk Rule
Tight stops can occasionally result in being stopped out just before the stock begins its larger decline.
Re-entry is acceptable if the original setup forms again.
However, there is a limit:
Maximum of roughly three attempts on the same ticker.
After that, stop trading the name.
This protects against revenge trading, tilt, and becoming emotionally attached to one stock.
Market Context and Future Leaders
The chart pattern alone is not enough.
Market context helps determine whether a setup has the potential to become a major winner.
Many powerful bases form during broader market corrections.
While the index is declining, future leaders may:
- Hold above important moving averages
- Trade sideways instead of falling
- Maintain strong relative strength
- Move higher while the market remains weak
Those stocks deserve attention when the broader market begins to recover.
The idea is to identify leadership before the next major market advance is obvious to everyone.
Risk-to-Reward Philosophy
The strategy is not built around being right on every trade.
The historical win rate discussed in the episode was approximately 30%.
The edge comes from keeping losses small and clearly defined while allowing successful trades to produce several multiples of the original risk.
A tight stop allows a relatively small loss when the setup fails, while a strong trend can produce significantly larger gains.
Before entering, the important questions are:
Where is the trade invalidated? How much is being risked? Is the potential reward large enough to justify that risk?
The objective is not maximum accuracy. It is favorable asymmetry between risk and reward.
Keep the Process Simple
A more complicated chart does not necessarily lead to better decisions.
Earlier in the trading process, multiple indicators such as RSI, stochastics, Money Flow Index, MACD, and other tools were used together.
The result was often conflicting signals and analysis paralysis.
The simplified framework focuses primarily on:
Price + Volume + Moving Averages + Relative Strength + Market Context + Risk
MACD and other intraday tools can still provide supporting information, but they do not replace the underlying setup.
Keeping the process simple also makes invalidation clearer. If the stock does not behave as expected, the trade can be exited without needing to interpret several conflicting indicators.
70% Reaction, 30% Anticipation
The trading process is approximately 70% reaction and 30% anticipation.
The anticipation happens before the trade.
Study historical winners, understand the current market cycle, identify strong groups, and build a watchlist of stocks showing unusual relative strength.
This preparation helps determine where opportunities are most likely to develop.
The remaining 70% comes from reacting to what the market actually does.
A trader may enter the session with a particular expectation, but price action takes priority. If the original thesis is invalidated, the goal is to adjust rather than force the market to match the initial opinion.
Preparation identifies the opportunity.
Price action determines whether to take it.
For every breakdown, we are adding a trade example at the very end.
Trade Breakdown
Trade Example: Affirm
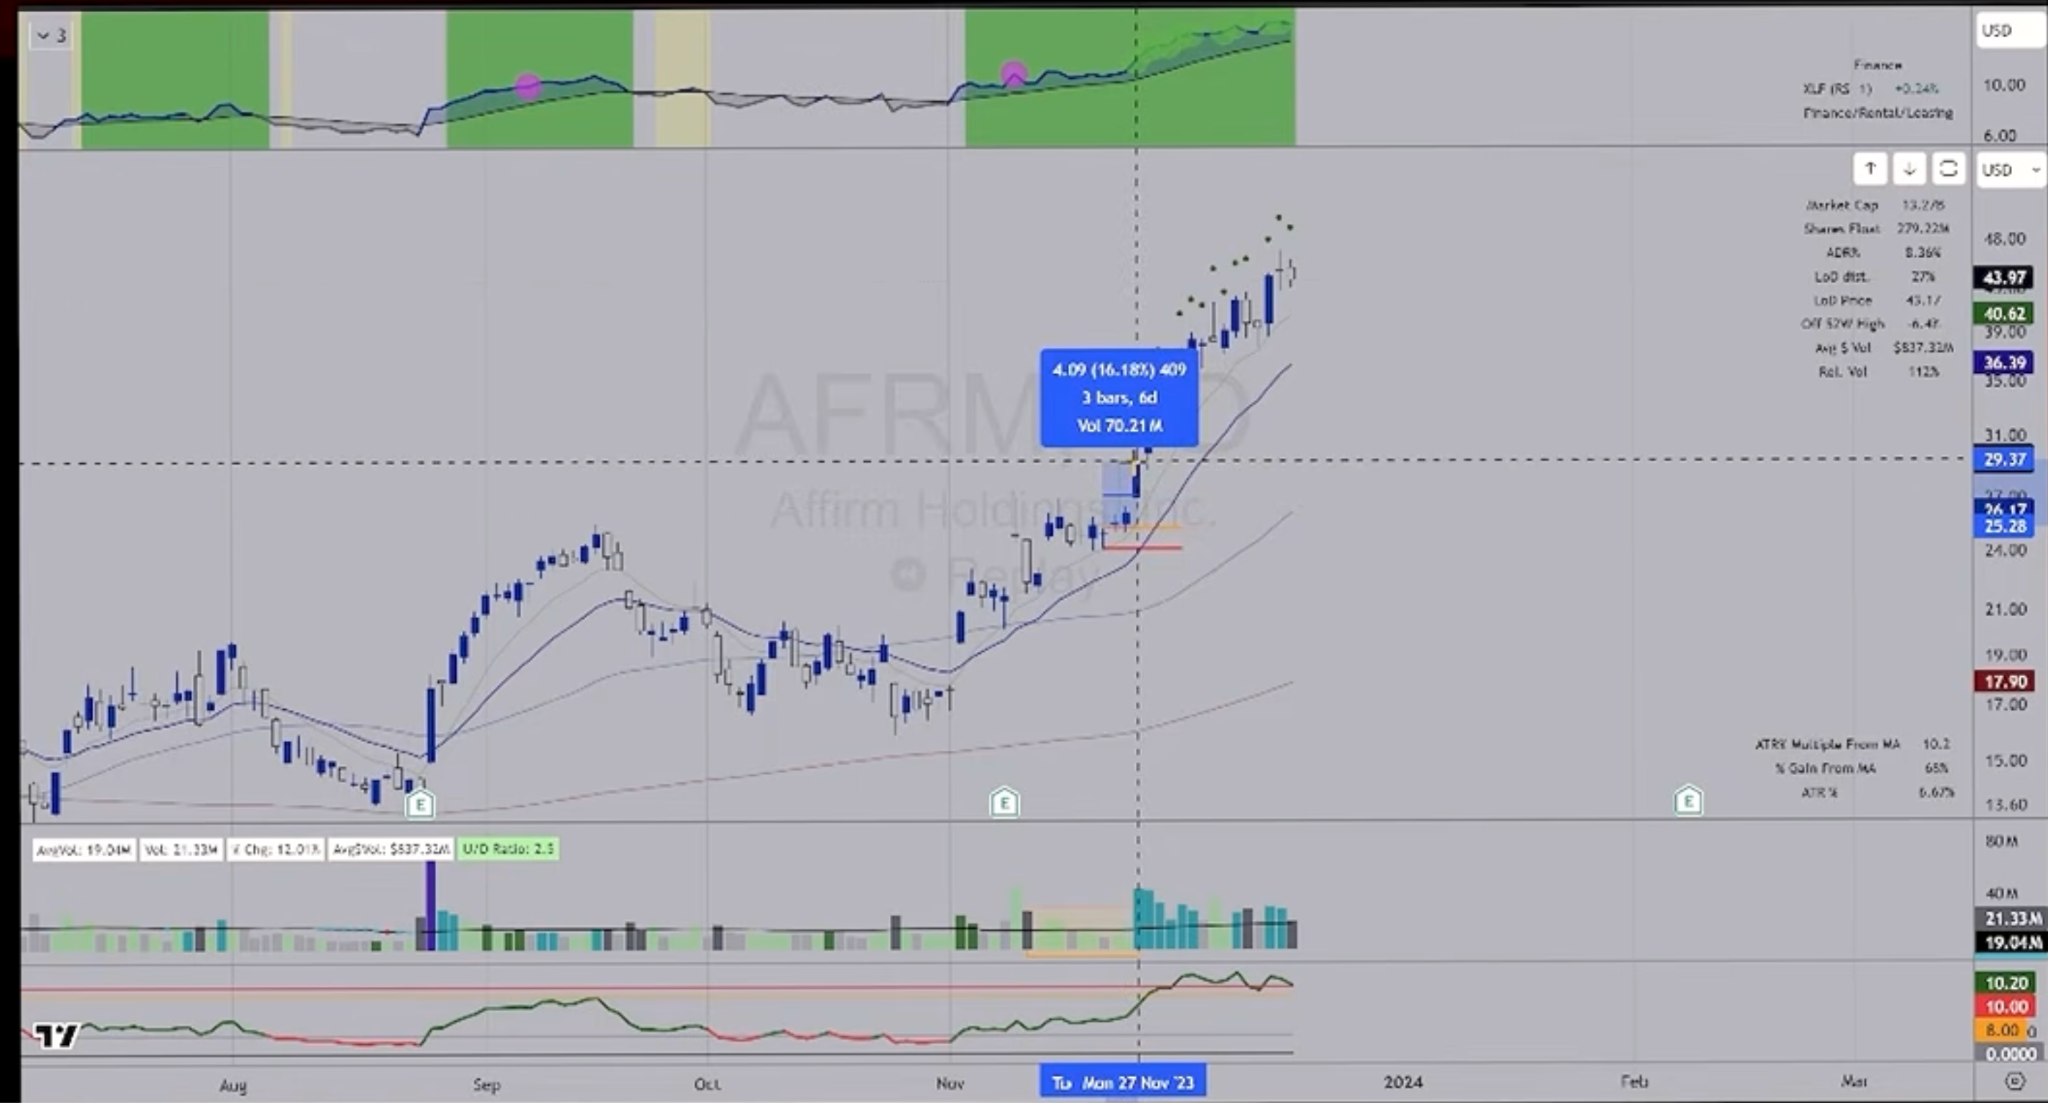
Affirm provided a clear example of the long continuation setup during the 2023 market cycle.
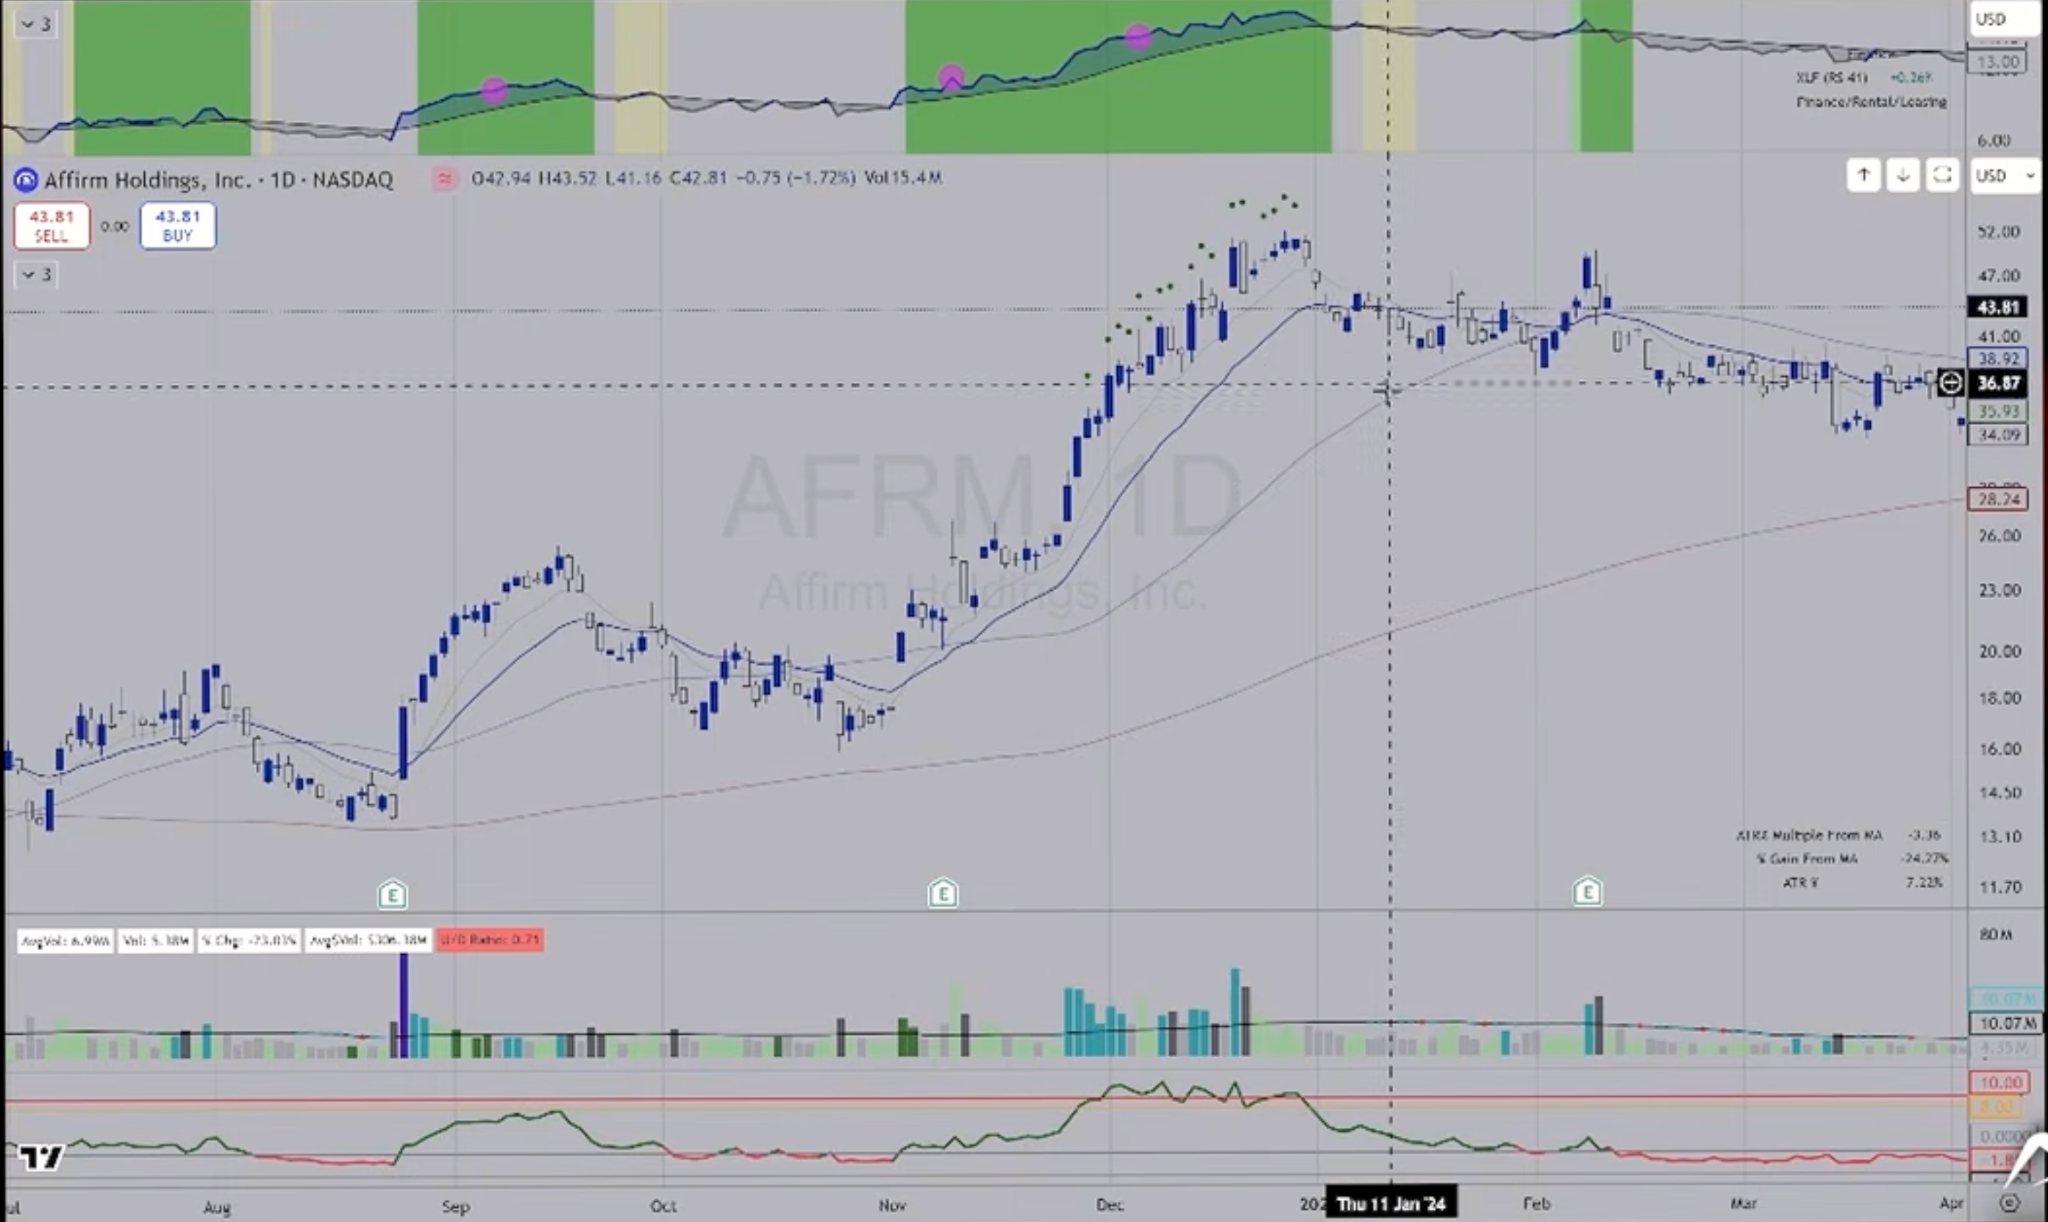
The stock initially corrected with the broader market, then began showing a change in character as it moved back above its key moving averages. After the wedge pop, price pulled back to retest the 10-day and 50-day moving averages.
Although the structure was developing, earnings were approaching, so the initial setup was avoided. Taking a new position without an existing profit cushion would have meant accepting unnecessary binary earnings risk.
After earnings, the stock continued higher and began forming a tighter base. During the consolidation, the candles became increasingly tight, volume dried up, and relative strength remained strong. The 10-day EMA also began catching up underneath price.
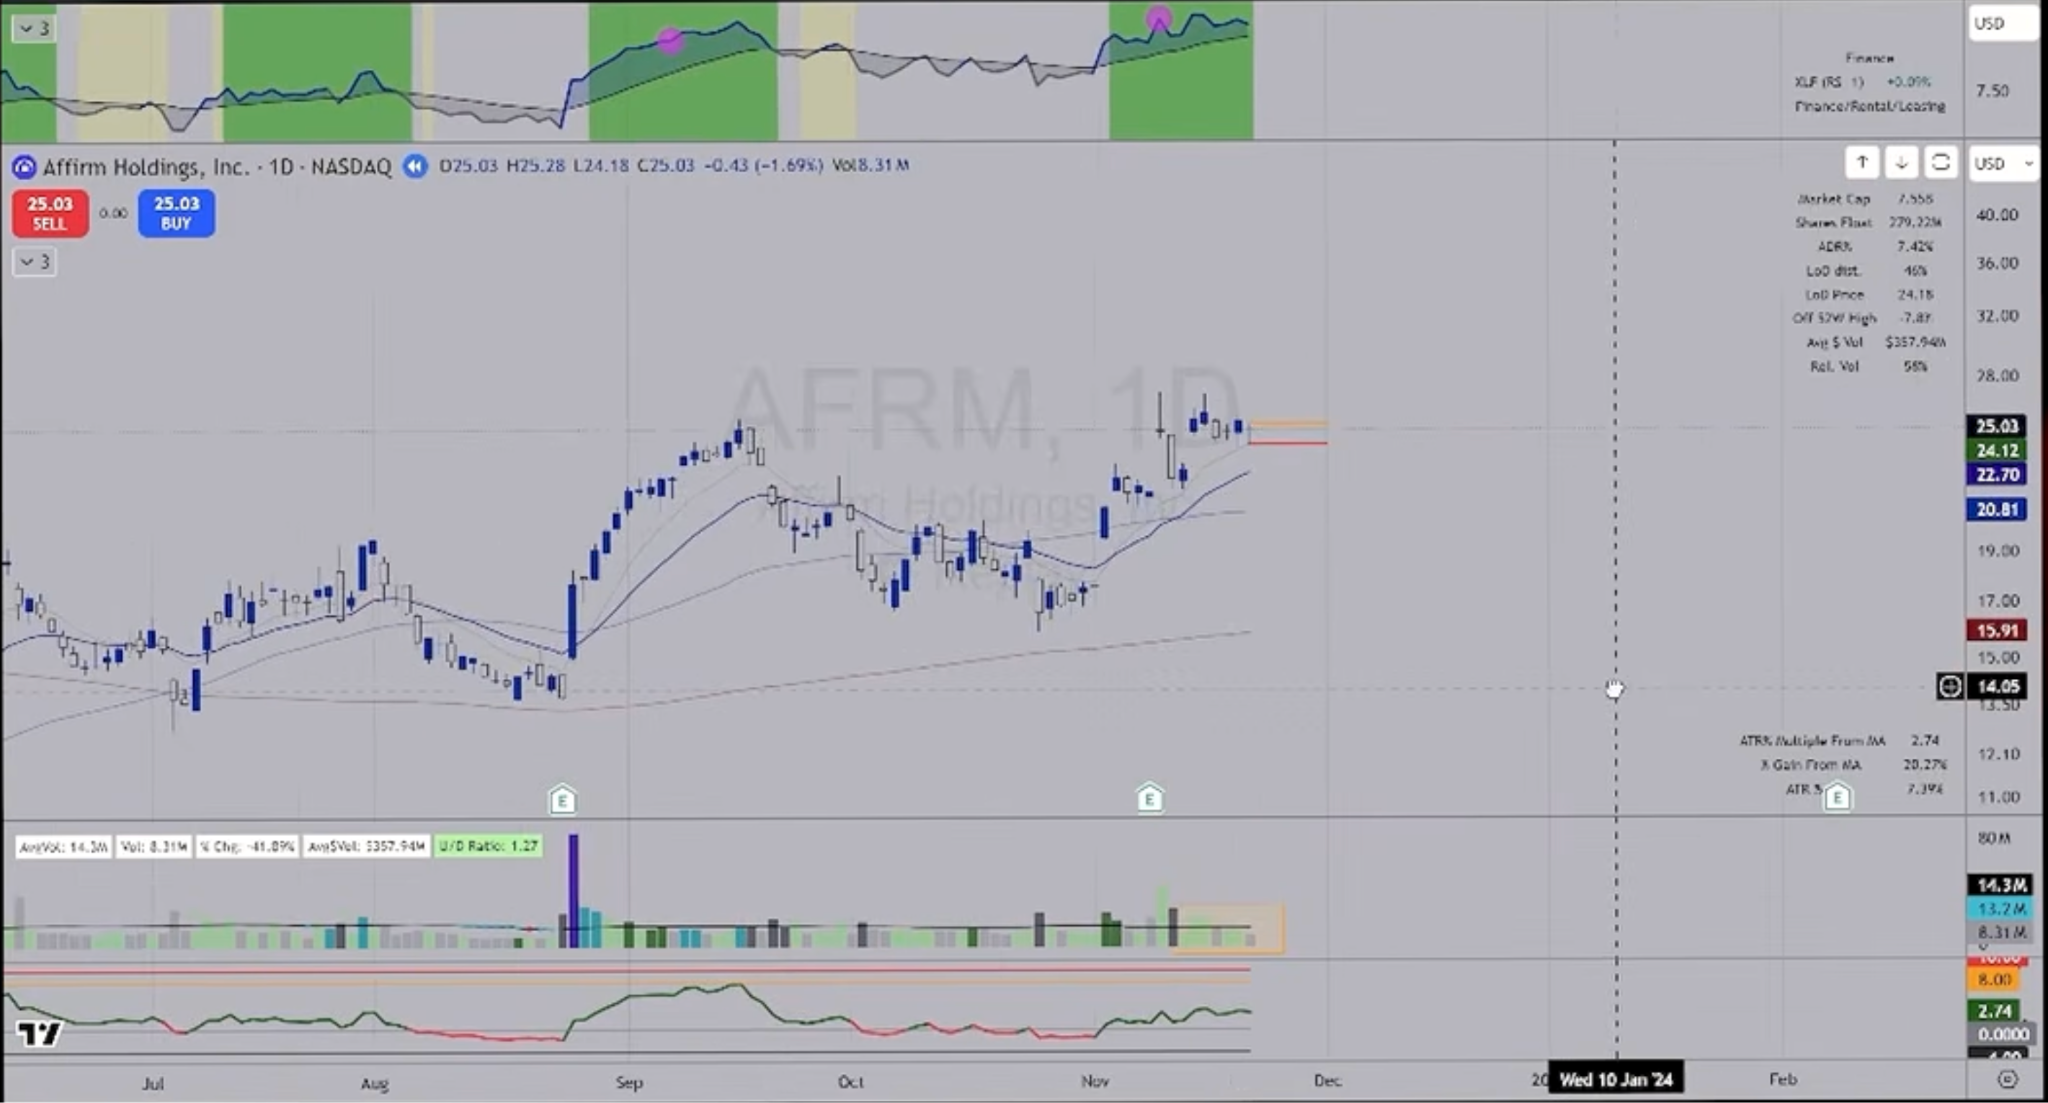
A tight inside-day area then created a potential breakout entry above the prior highs, with the stop below the prior day’s low.
The initial risk was roughly 4%, while the stock’s ADR was approximately 7%. Within three days, price had advanced around 20%.
At approximately 2× ADR, the first third could be taken off and risk reduced. As price later became extremely extended from the 50-day moving average, another third could be sold into strength. The final portion could then be held until price violated the short-term moving average it had been respecting.