


Built For
Instruments: Futures
Trading Style: Scalping
Strategy Overview
This strategy looks for short-term NQ reversals after price takes a meaningful liquidity pool. The setup starts by establishing higher-timeframe context, locating the liquidity price may target, and waiting for that liquidity to be swept.
The reversal is then evaluated through an Inversion Fair Value Gap (IFVG), displacement, and speed. Once the shift is confirmed, the trade is executed on the lower timeframe and managed toward the next logical liquidity objective.
The setup is built around six key factors:
Higher-Timeframe Analysis → Premium/Discount → Liquidity Pool → Liquidity Sweep → IFVG/FVG → Displacement + Speed
Liquidity and Market Delivery
Liquidity is the foundation of the strategy. Swing highs and lows, equal highs and lows, and session extremes can hold orders that attract price.
The goal is not to enter simply because price reaches one of these areas. The important part is what happens when that liquidity is taken.
A common sequence is:
Accumulation → Manipulation → Distribution
During accumulation, price can consolidate and build liquidity. Manipulation occurs when price runs one side of that liquidity. Distribution is the move that develops away from the sweep if the reversal is confirmed.
This sequence is particularly useful when reading the transition from the Asia session into London.
London Session Framework
Asia Range and Liquidity
When Asia consolidates, its high and low provide clear liquidity on both sides of the range.
During London, price can sweep one side of the Asia range before moving toward liquidity on the opposite side.
A bullish scenario can begin with a sweep of sell-side liquidity below the Asia range. A bearish scenario can begin with a sweep of buy-side liquidity above the range.
However, a clean Asia range is not required. NQ can make a significant directional move during Asia. When this happens, use other meaningful liquidity references instead of forcing an Asia high/low setup.
These can include previous highs/lows, Daily and 1H liquidity, Fair Value Gaps, Midnight Open, NDOG, and NWOG.
London Timing
The main London trading window is approximately 2:00–5:00 AM ET.
Avoid entering before 2:00 AM ET, even when the chart appears to be setting up earlier.
Within the window, 2:30, 3:00, and 3:30 AM ET are important periods to watch for expansion. These times provide context, but they are not entry signals by themselves.
Building the Setup
1. Higher-Timeframe Analysis
Start with the Daily and 1-Hour charts to understand where price is positioned and where important liquidity may be located.
The 1H Fair Value Gap is an important reference within this framework. It can provide an area price trades into or an objective for a lower-timeframe move.
Higher-timeframe analysis should establish the larger context before moving down to the execution chart.
Focus on:
- Daily and 1H highs/lows
- Daily and 1H FVGs
- Previous session/day liquidity
- Equal highs and lows
- Other clear higher-timeframe liquidity
The higher timeframe provides the location and potential destination. The lower timeframe is used to build the entry.
2. Premium and Discount
Determine where price is positioned within the relevant range.
Premium represents the upper portion of the range, while discount represents the lower portion.
This helps frame the location of the setup and adds context to the liquidity analysis. Premium and discount are not standalone entry signals.
3. Identify the Liquidity Pool
Locate the liquidity that price may target before the reversal develops.
For a potential long, focus on sell-side liquidity below price.
For a potential short, focus on buy-side liquidity above price.
Relevant liquidity can form around swing highs/lows, equal highs/lows, Asia highs/lows, previous session extremes, or other clear liquidity within the current structure.
The objective is to know which liquidity price may manipulate before looking for an entry.
4. Wait for the Liquidity Sweep
Price must actually take the identified liquidity.
For a bullish setup, price sweeps sell-side liquidity. For a bearish setup, price sweeps buy-side liquidity.
The sweep itself is not the entry. Price can take liquidity and continue moving in the same direction.
The next step is to determine whether price is showing a genuine shift away from the sweep.
IFVG Entry Model
5. FVG to IFVG
The Inversion Fair Value Gap provides the entry structure after the liquidity event.
For a bullish reversal, price can create a bearish FVG while moving toward sell-side liquidity. After the liquidity is swept, bullish price action trades back through that bearish FVG.
Once price properly trades and closes through the gap, the previous bearish FVG can act as a bullish IFVG. A retracement into the inversion can provide the long entry.
For a bearish reversal, the process is reversed. Buy-side liquidity is swept, bearish price action trades through a bullish FVG, and the inverted area can provide the short entry.
The basic sequence is: Liquidity Sweep → FVG Inversion → Retracement → Entry
Conservative Confirmation
A more conservative entry waits for a clear candle-body close through the original FVG before treating the inversion as valid.
A very small move through the gap does not provide the same level of confirmation.
Aggressive Confirmation
A more aggressive entry can use a seconds-based chart to identify displacement and a smaller inversion developing before the full 1-minute confirmation is complete.
This can provide an earlier entry and potentially tighter risk, but it comes with less confirmation.
Displacement and Speed
6. Confirm the Shift
After the liquidity sweep, the reaction should show displacement and speed.
Displacement should not be judged only by how large the finished candle looks. A candle can appear strong after closing while having taken a long time to form with significant back-and-forth movement.
A stronger shift shows price moving decisively and quickly away from the liquidity event.
This helps distinguish a genuine change in price delivery from a temporary reaction after the sweep.
Entry Execution
The 1-minute chart is the primary execution timeframe.
Seconds-based charts, including the 15-second and 3-second, can be monitored to see how the 1-minute candle is developing. They are particularly useful for evaluating the speed of displacement and refining more aggressive entries.
A practical progression for learning the execution is:
5-Minute → 1-Minute → Seconds
The lower timeframe adds precision. It does not replace the higher-timeframe context, liquidity sweep, or IFVG structure.
Once the setup is confirmed, the entry can be taken as price retraces into the inversion area. A bracket order can be used to establish the stop and initial target with the entry.
Low-Resistance Liquidity and Targets
After the manipulation, identify the liquidity price can move toward during the distribution.
One important concept is low-resistance liquidity. This is liquidity in the expected direction of the move that can provide a logical objective after the reversal.
Depending on the chart, targets can include:
- Opposing swing highs/lows
- Equal highs/lows
- 1H FVGs
- Session liquidity
- Midnight Opening Price
- NDOG or NWOG
- RTH Gap levels during New York
The trade is generally structured around at least 1:2 risk-to-reward.
A bracket can initially be set around 1:2 and adjusted when the actual liquidity target offers more room, such as 1:3 or 1:4.
The objective is to capture the planned scalp. There is no requirement to hold for the entire session move.
New York Session Framework
The same core setup can be applied during New York:
HTF Context → Premium/Discount → Liquidity → Sweep → IFVG → Displacement + Speed
The main difference is the environment. New York generally moves faster and with greater volatility, particularly around the market open.
The session also introduces additional references that can help identify liquidity and targets.
Regular Trading Hours Gap
The Regular Trading Hours (RTH) Gap is an important New York reference.
The gap can be divided into: 25% → 50% → 75% → 100%
These levels can provide areas of interest and potential profit objectives once a valid reversal setup develops.
The full gap does not need to fill. If the structure supports a target at 75%, for example, there is no requirement to hold solely for the 100% level.
The RTH Gap provides context and targets. It does not replace the core entry setup.
Additional New York References
Other references that can be incorporated into the New York liquidity map include:
- Daily and 1H FVGs
- Midnight Opening Price
- NDOG
- NWOG
- Session highs and lows
- RTH Gap
These references become more useful when they align with the liquidity event and the expected direction of the move.
SMT Divergence
NQ can also be compared with ES around important highs and lows.
If one market sweeps liquidity while the other does not, the divergence can provide additional information about the move.
SMT is used as supporting confluence. The trade still needs the underlying liquidity event and lower-timeframe confirmation.
Stop-Loss Framework
The stop should sit beyond the structure that invalidates the setup, such as the relevant swing high/low, manipulation extreme, or supporting order-block structure.
Stop distance should adjust with market volatility.
In the market conditions discussed, London trades could require approximately 20–25 NQ points, while New York trades could require roughly 30–40 points. During periods of lower NQ volatility, stops closer to 15 points had also been used.
These are examples of stop distances under different volatility conditions, not fixed requirements.
If an entry requires an excessively wide stop just to keep the trade valid, reassess the entry. If the structural stop is correct but creates too much dollar risk, reduce position size or use MNQ.
Trade Management
Once price begins confirming the trade, risk can be reduced behind newly formed structure.
After minor liquidity is taken, the stop can be tightened behind a new swing or another relevant structural point. This does not mean every trade needs to move directly to breakeven as soon as it becomes profitable.
A typical management process can be:
Entry → Price Confirms → Minor Liquidity Taken → Reduce Risk → Target/Partial → Trail Remaining Position
Because the strategy looks for reversals, protecting the position as the move develops helps limit the impact when the reversal fails.
The profit-management method should also be defined in advance. Fixed targets, partial exits, and trailing stops can all be tested to determine which approach performs best.
Setup Quality and Position Sizing
Not every valid setup will have the same amount of supporting context.
A stronger setup may combine a clean liquidity sweep with several aligned references, such as higher-timeframe FVGs, equal highs/lows, session liquidity, or opening-gap levels.
A lower-quality setup may still have the core reversal structure but contain fewer confluences, unresolved liquidity nearby, a later entry, or less favorable risk-to-reward.
The core strategy does not need to change. Instead, exposure and management can be adjusted to the quality of the setup.
A stronger setup can support greater conviction, while a lower-quality setup can be traded with smaller size, less aggressive scaling, and more conservative profit-taking.
Risk Management
Daily risk is better defined by a maximum dollar or percentage loss than by forcing a fixed number of trades.
In one prop-account example, an account of approximately $160,000 after building a buffer was managed with roughly a $3,000 daily loss limit. This is an example of account management, not a recommended universal risk amount.
For personal capital, risk can instead be defined as a percentage of the account.
Prop-firm drawdown, consistency rules, and account size should also be considered when determining position size.
Trade Breakdown
Trade Example 1: London Bearish Setup
The Asia session formed a range with equal highs, creating clear buy-side liquidity above price. The setup was not taken early; the focus remained on waiting until the London trading window after 2:00 AM ET.
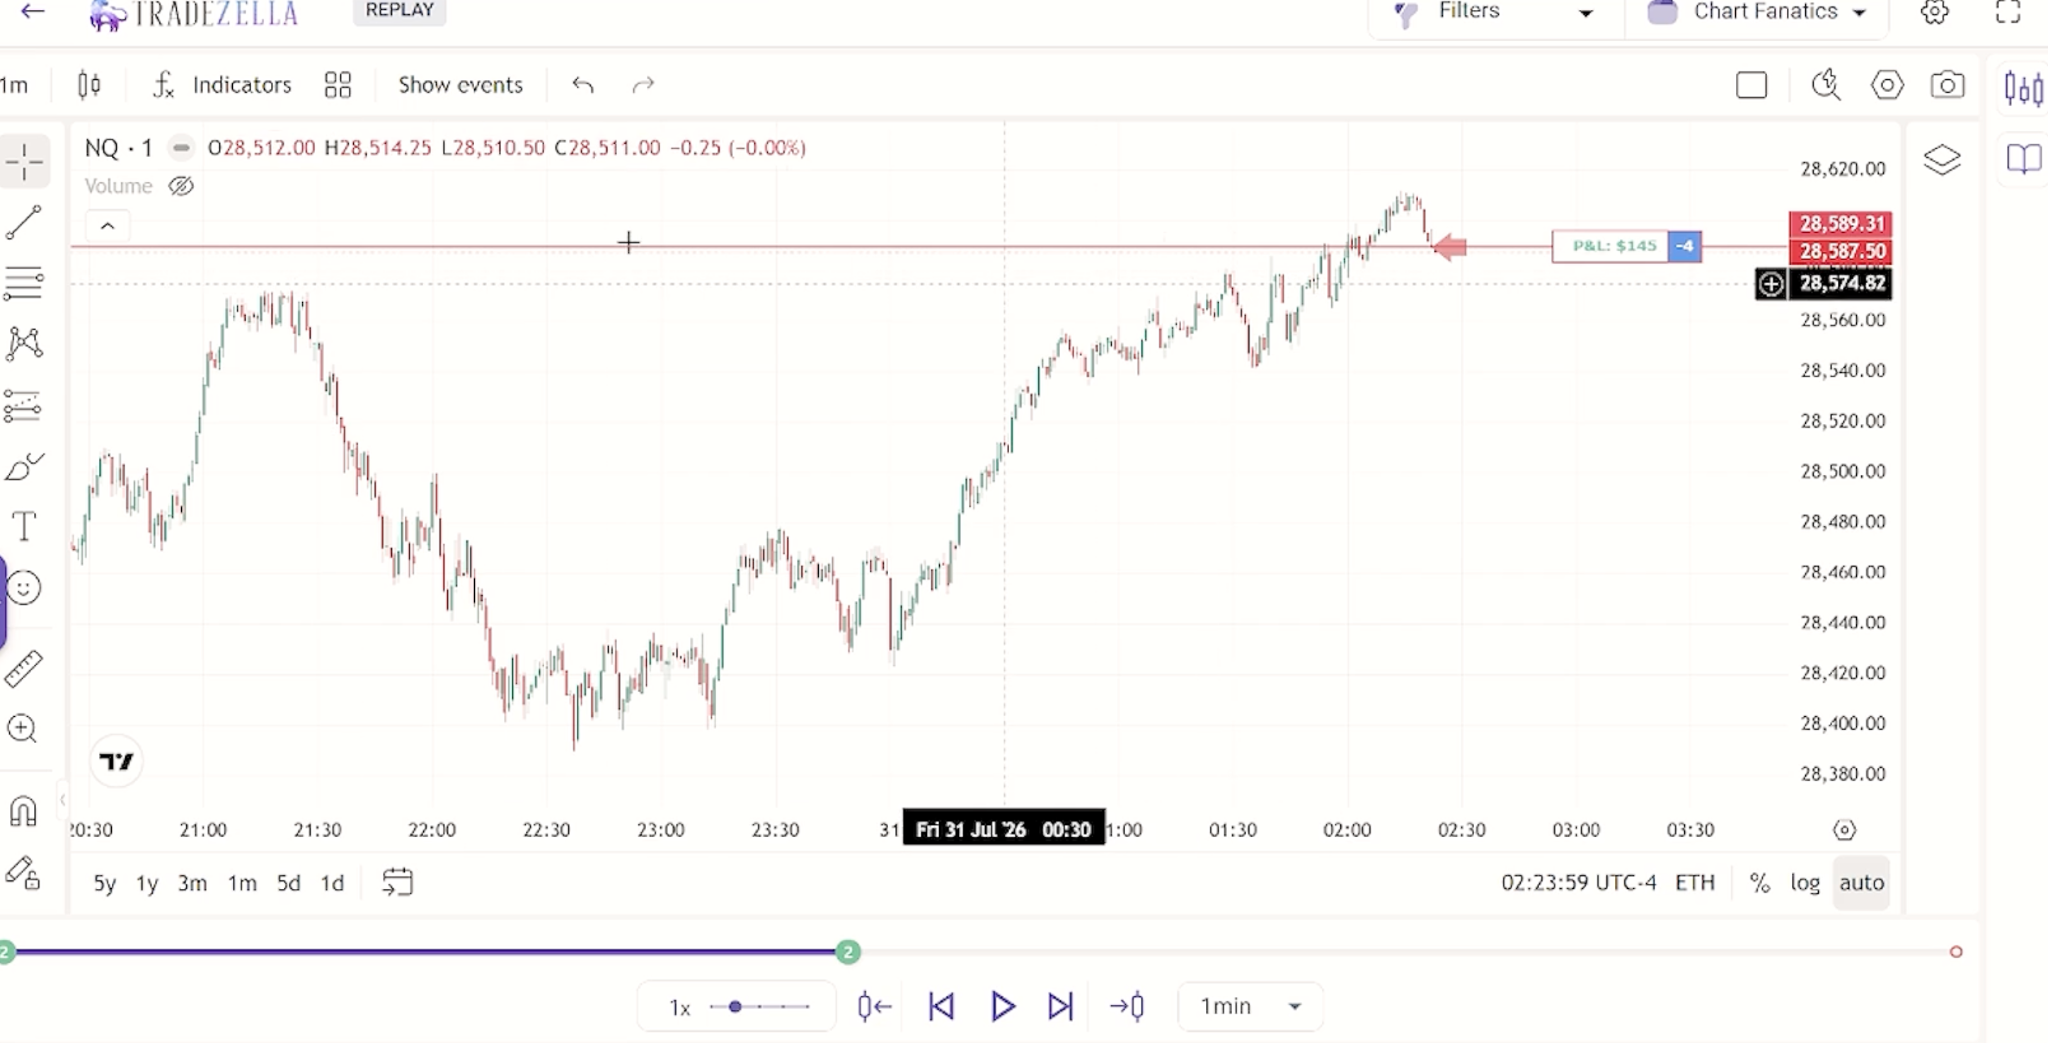
Price then pushed above the equal highs and swept the buy-side liquidity. After the sweep, the lower timeframe showed the bearish shift needed for the setup, including the FVG/IFVG confirmation and bearish displacement.
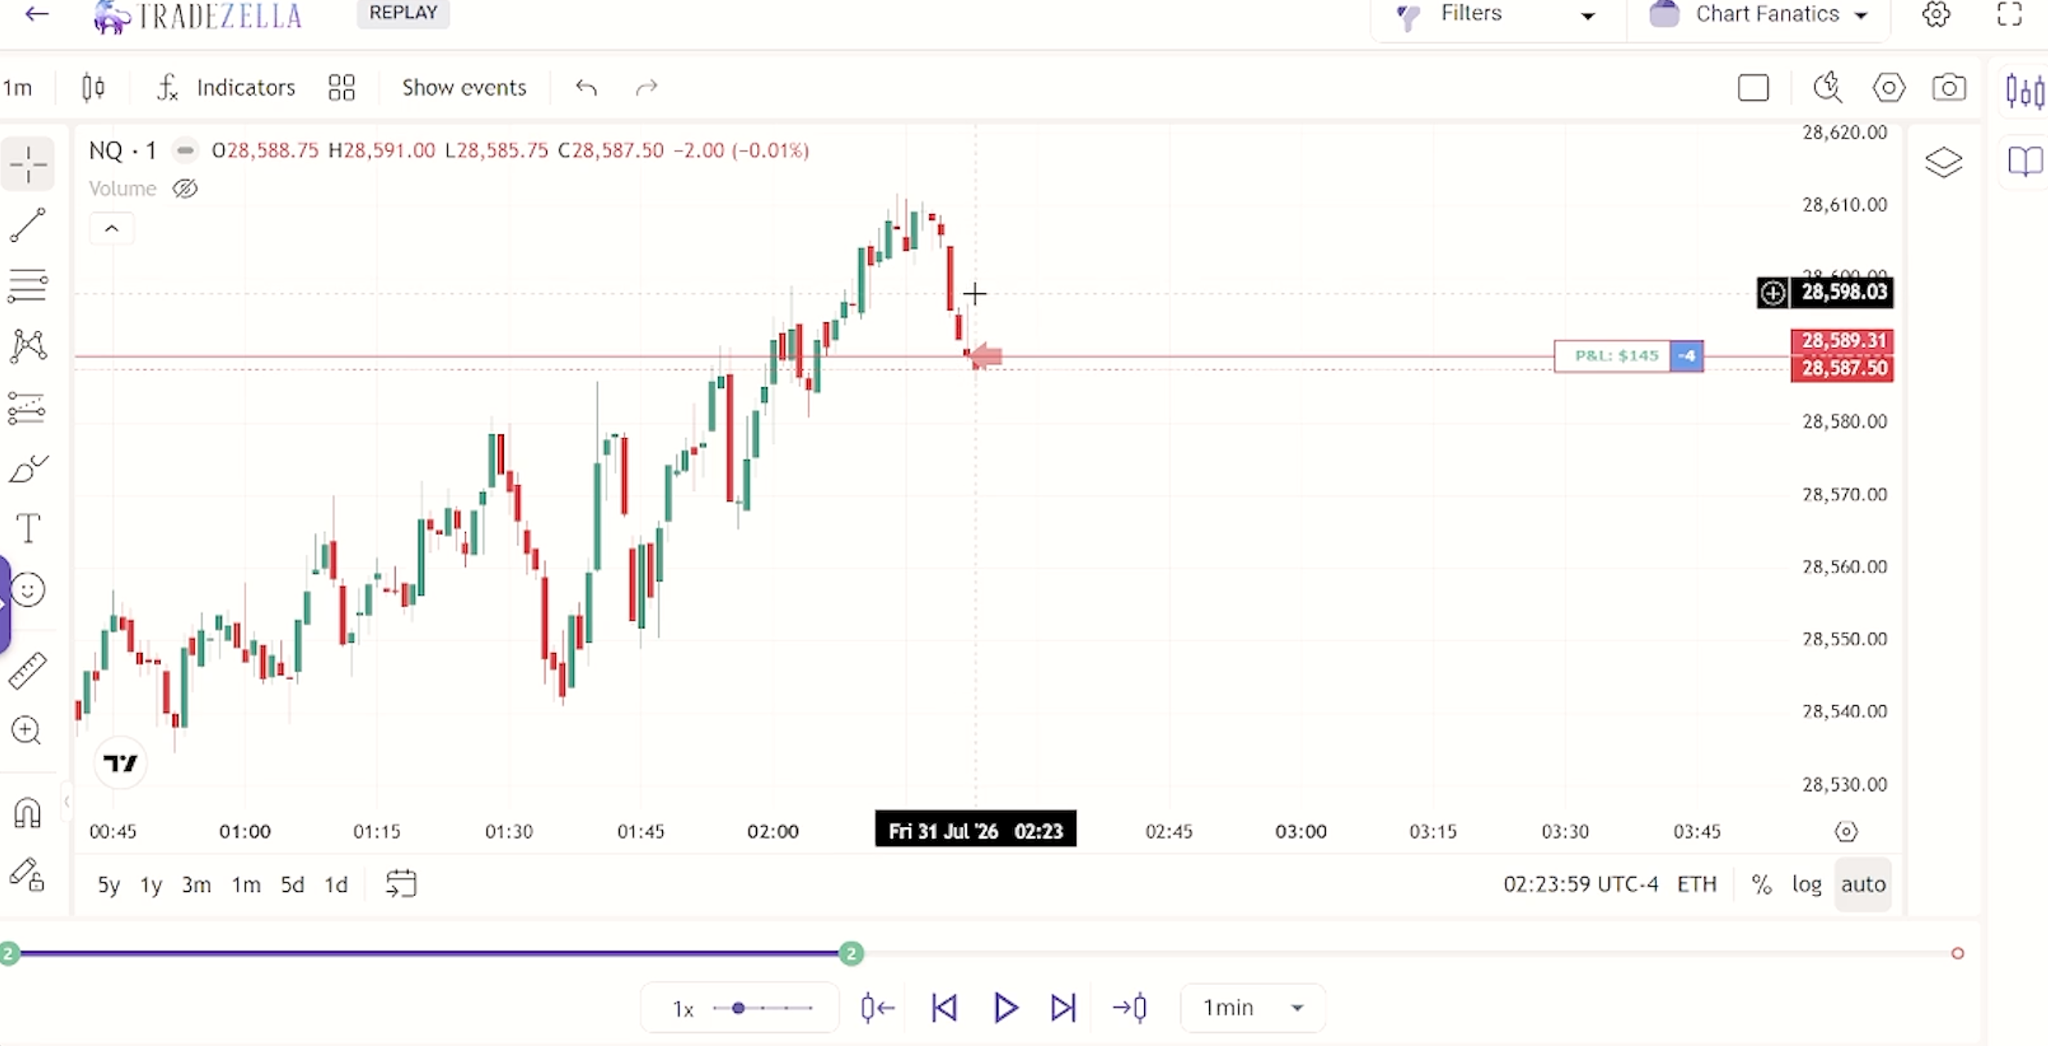
With the manipulation confirmed, the trade was taken short toward the low-resistance sell-side liquidity below price.
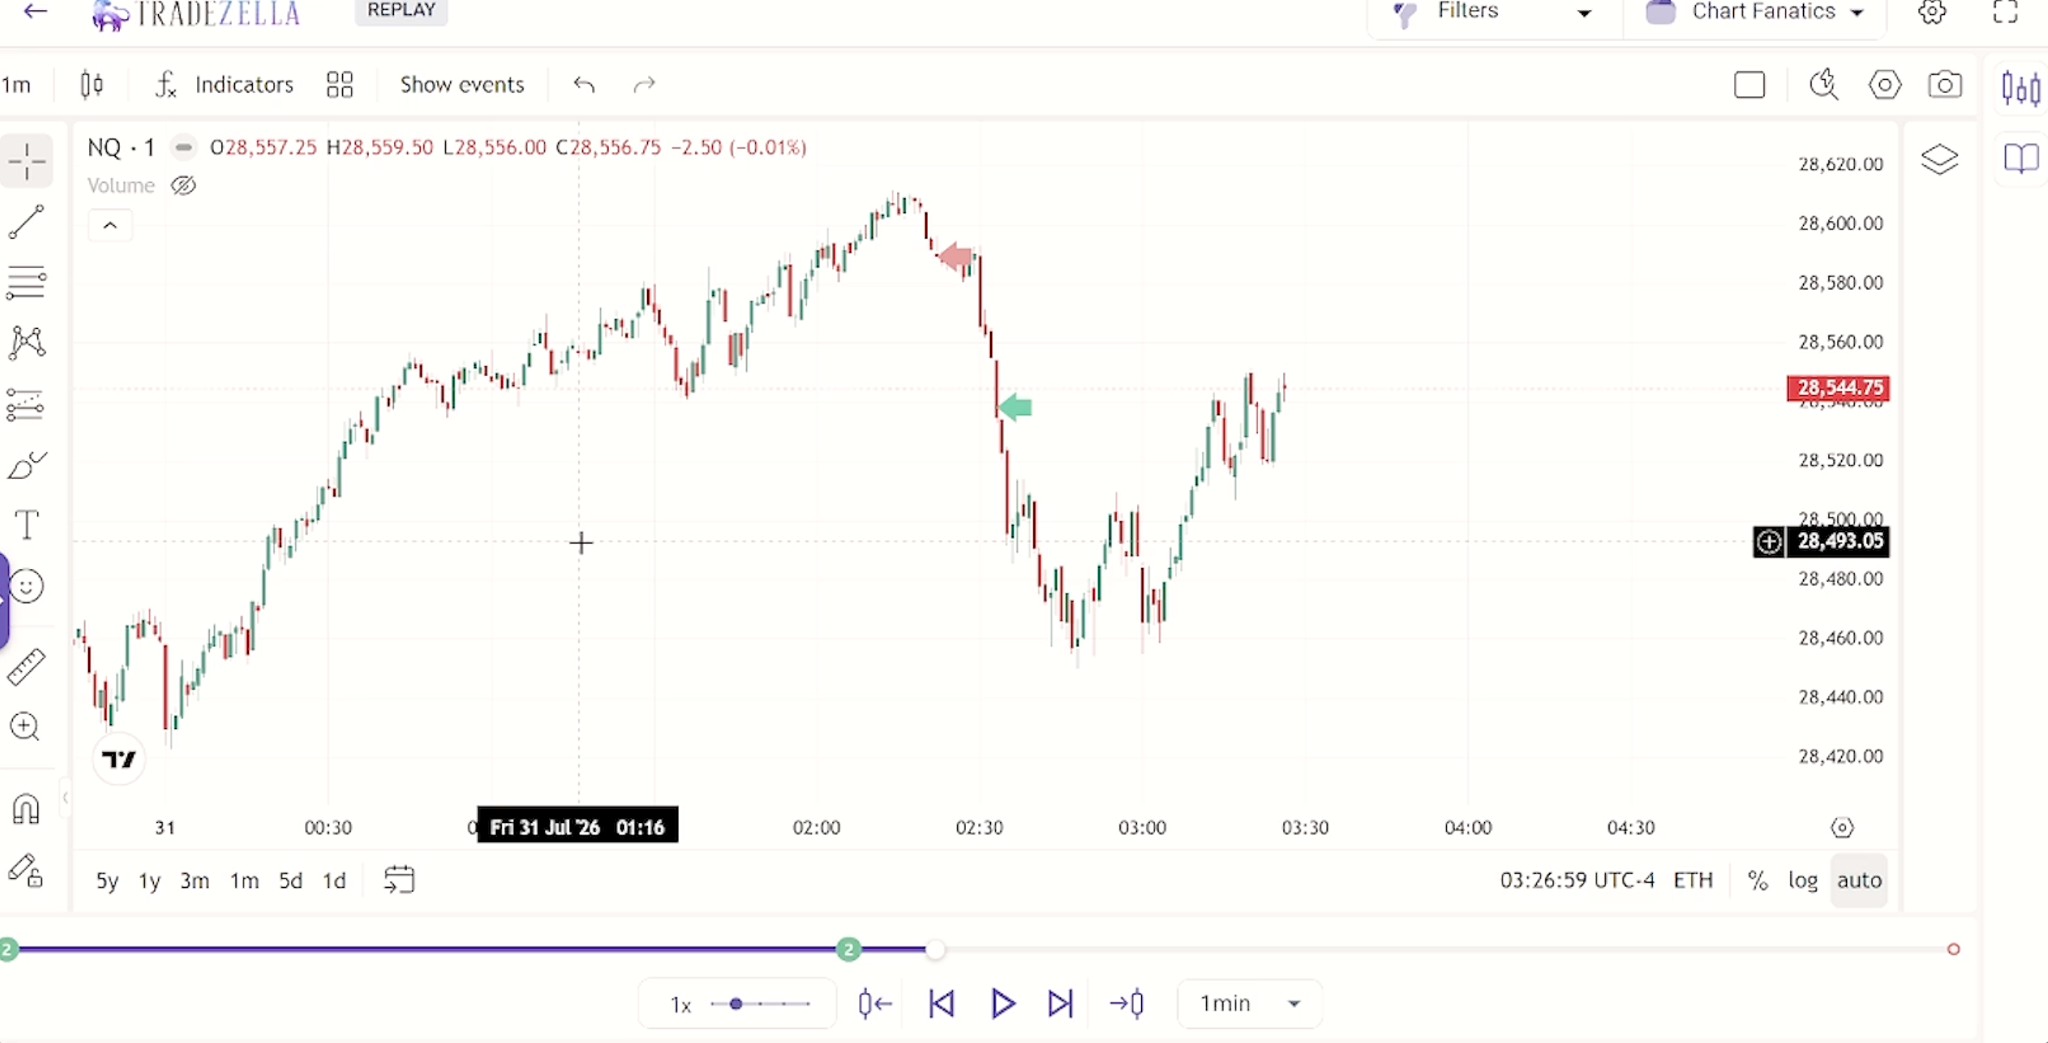
Setup sequence:
Asia Range → Equal Highs → Buy-Side Liquidity Sweep → Bearish IFVG/Displacement → Short Entry → Sell-Side Liquidity Target
The trade captured approximately 40–50 NQ points in around nine minutes. The position was closed at the planned liquidity objective rather than holding for the much larger move that developed afterward.
Trade Example 2: London Bullish Setup
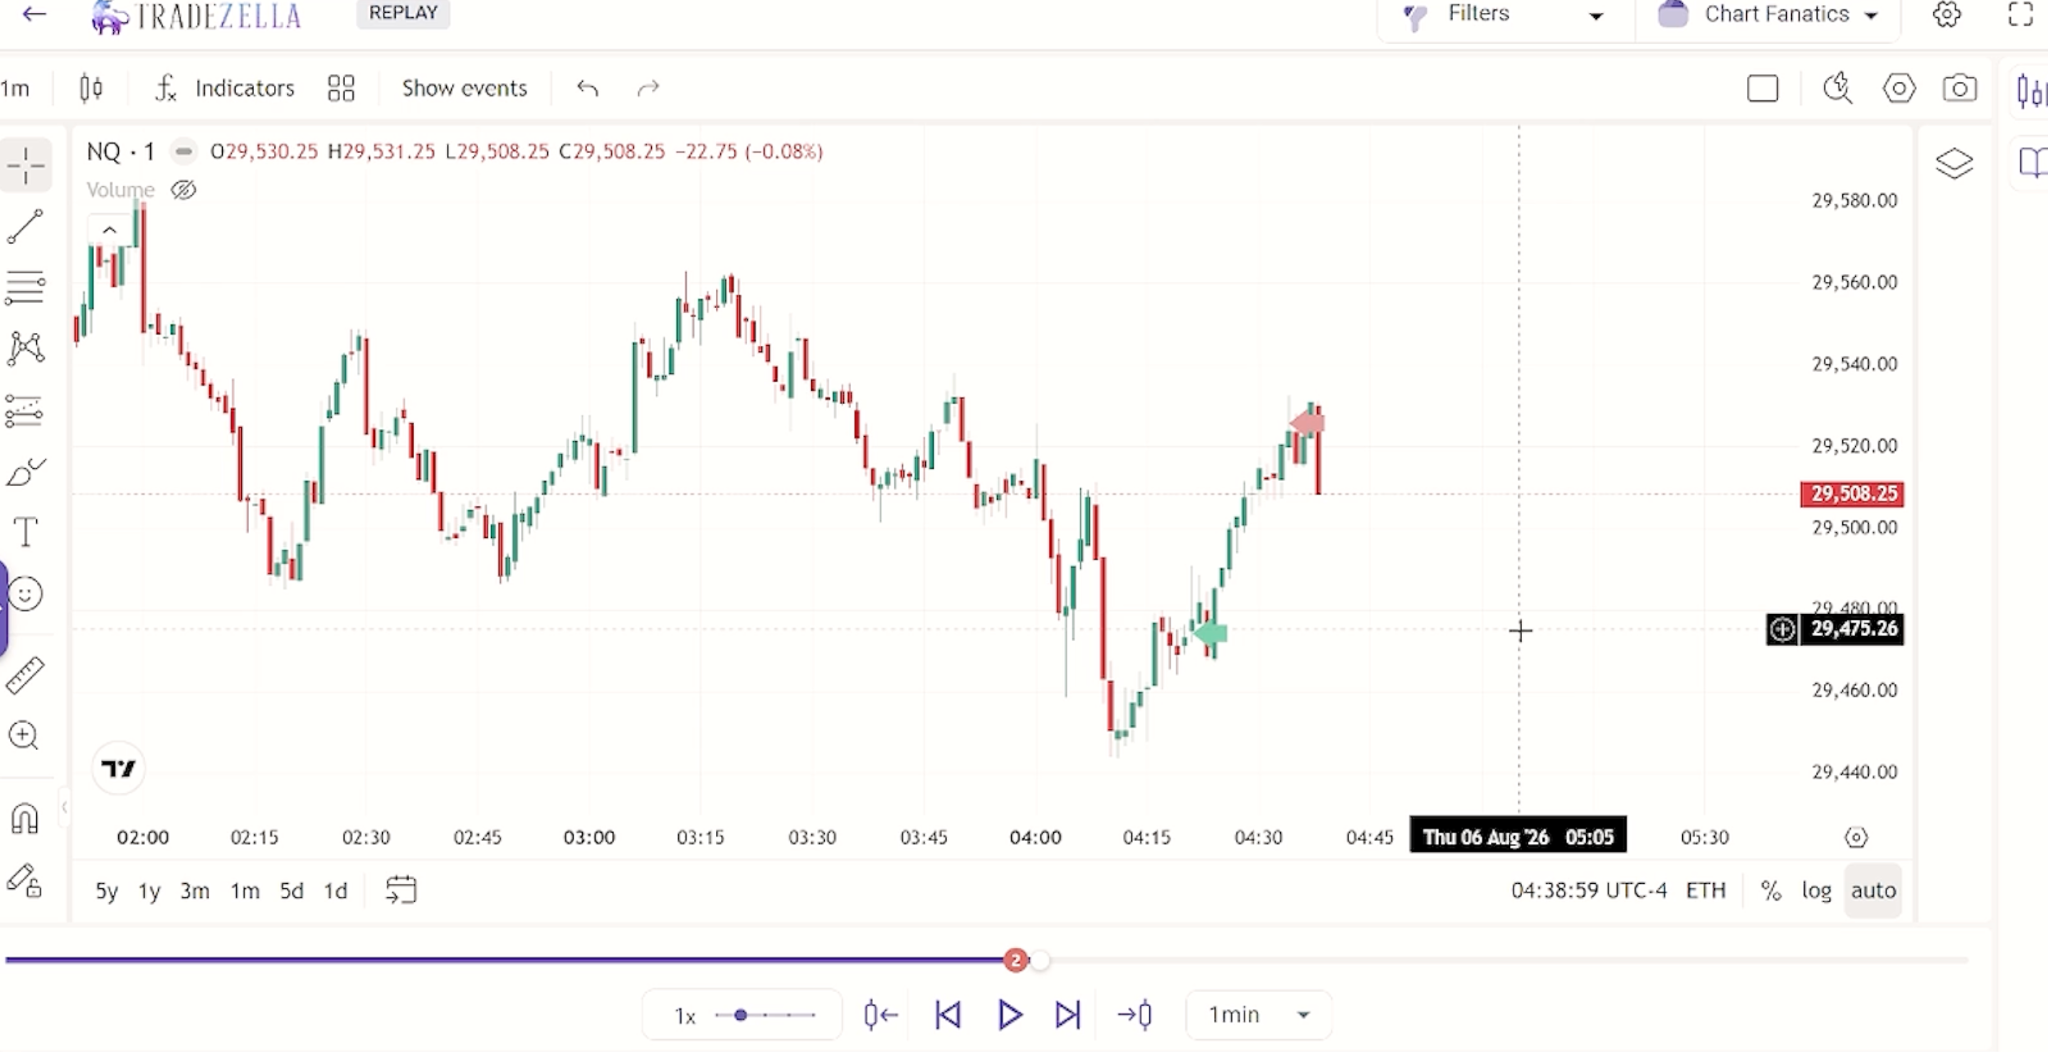
The setup begins with equal lows, creating clear sell-side liquidity below price.
Price then moves lower and sweeps that sell-side liquidity. After the sweep, the market starts to show the bullish reversal structure. A bullish IFVG develops, and the lower timeframe provides the confirmation needed for the long entry.
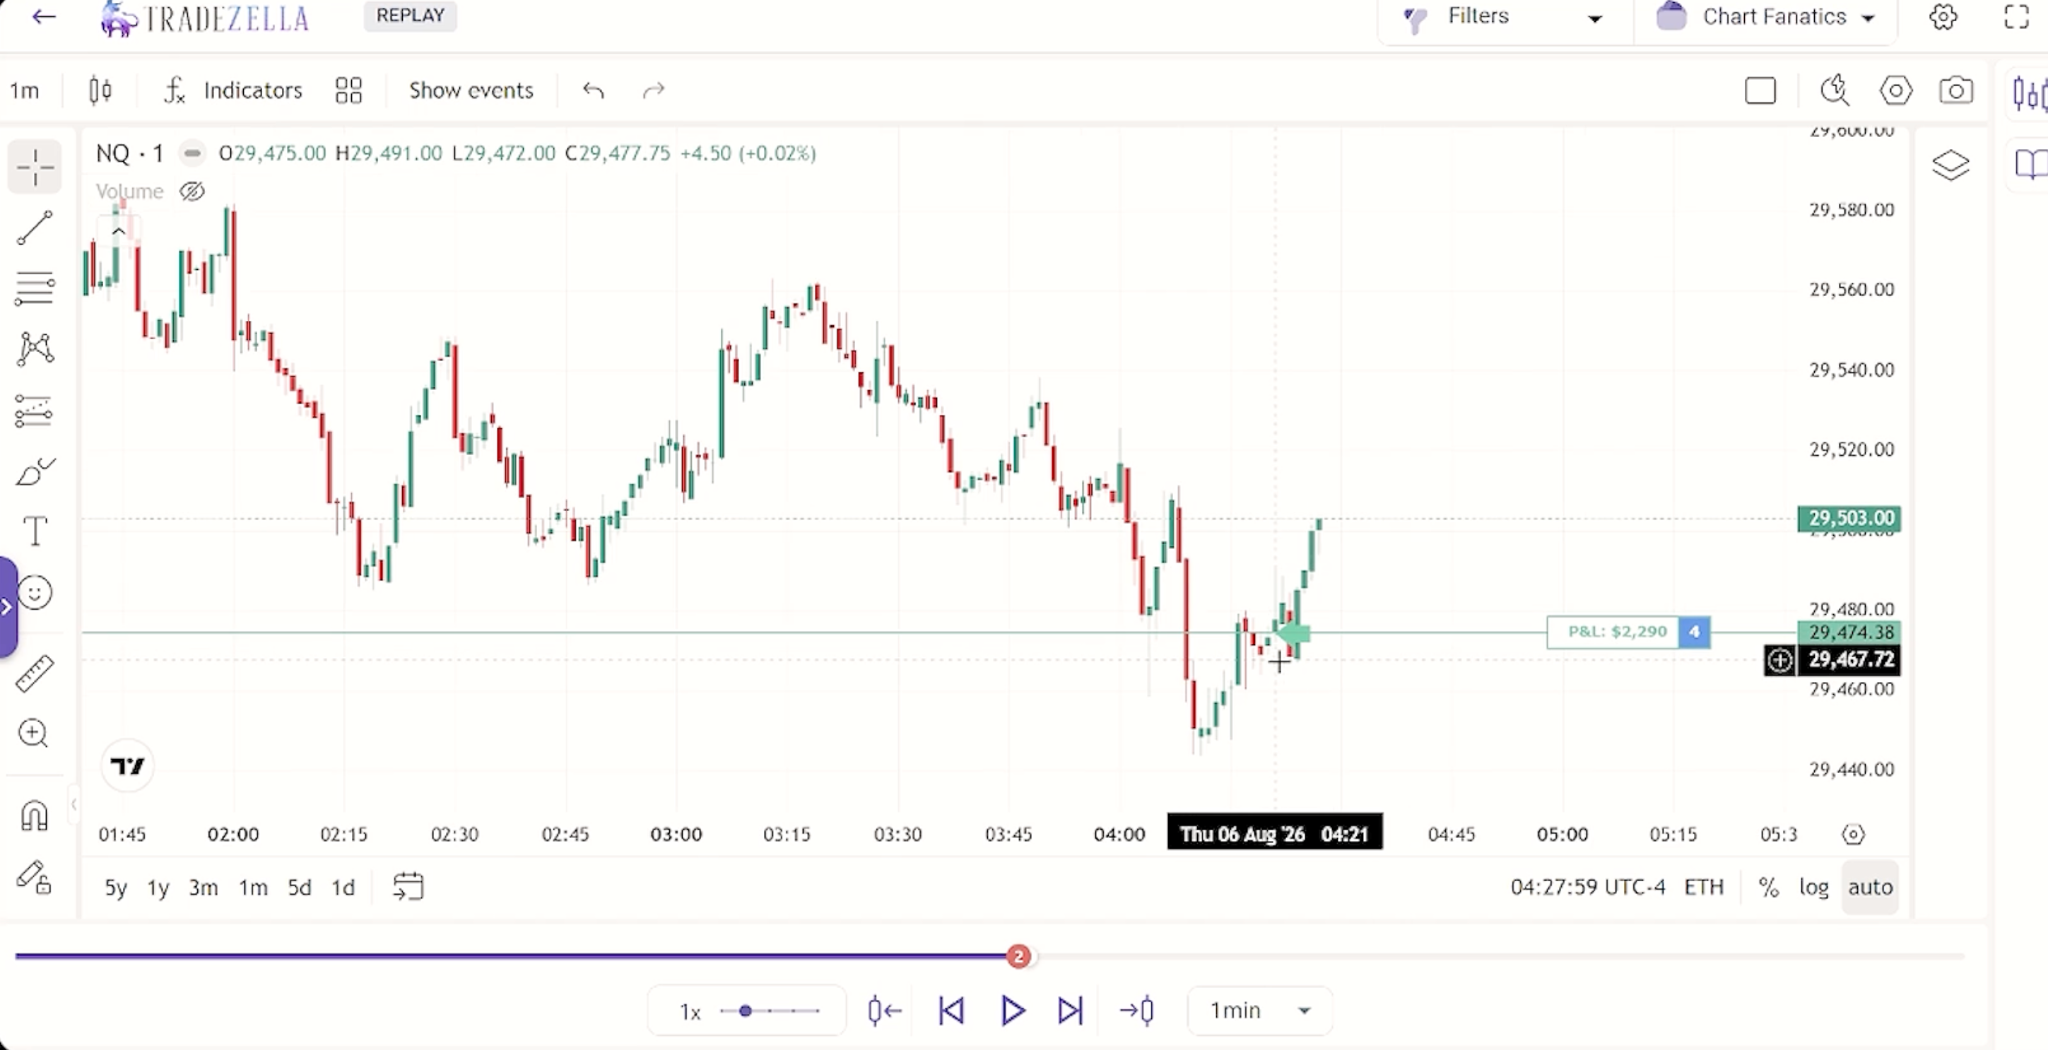
The target is the buy-side liquidity above price, with the trade managed toward the next clear swing high rather than holding for the entire move.
Trade structure:
Equal Lows → Sell-Side Liquidity Sweep → Bullish IFVG/Displacement → Long Entry → Buy-Side Liquidity Target
The important point is that the trade follows the same framework as the first example, just in the opposite direction. The liquidity is first taken, the reversal is confirmed, and then the trade is executed toward the opposing liquidity.