


Built For
Instruments: Futures
Trading Style: Day Trading
Strategy Overview
This strategy is built around the idea that markets function as a continuous liquidity auction, where price moves not because there are more buyers than sellers, but because one side is more aggressive and willing to accept worse prices in order to get filled.
Every movement in the market is the result of aggressive orders interacting with passive liquidity. Buyers move the price higher when they are willing to lift offers. Sellers move the price lower when they are willing to hit bids.
The key shift in this strategy is moving away from thinking in terms of price patterns alone and instead understanding what is happening behind price.
The objective is not to predict the market, but to:
- Identify where fair value exists
- Recognize when the price moves into imbalance
- Determine whether that move is accepted or rejected
- Trade in alignment with real participation from larger players
At its core, this strategy simplifies everything into one idea: Trade when the market proves that one side is in control.
How the Market Actually Works
Markets operate as a double auction.
At any given time:
- Above the price, there are sell limit orders
- Below the price, there are buy limit orders
These limit orders create liquidity, but they do not move the price. Price only moves when a participant becomes aggressive and executes a market order.
This leads to a key understanding:
There is always an equal number of buyers and sellers in every trade. What actually moves price is not an imbalance in quantity, but an imbalance in urgency.
When traders cannot wait and are willing to accept worse prices to get filled, price moves.
Aggressive vs Passive Behavior
There are two fundamental types of market behavior:
Passive participants provide liquidity. They place limit orders and wait.
Aggressive participants take liquidity. They use market orders and accept whatever price is available.
Price moves when aggressive participants step in and say, “I don’t care about getting the best price. I need to get filled now.” This urgency is what drives the auction forward.
The Real Driver: Liquidity and Execution
Large market participants do not trade the same way retail traders do. They cannot simply enter a position instantly. Their size requires them to find liquidity over time.
To do this, they:
- Split orders into smaller pieces (meta orders)
- Execute gradually
- Use execution algorithms like VWAP or TWAP
This process is known as execution alpha. Because of this, markets are constantly moving in search of liquidity. Price is not random. It is driven by the need to match large orders efficiently.
Who Is Participating in the Market
The market is made up of different types of participants, each with different objectives.
Institutional participants, such as hedge funds and banks, focus on capital allocation, hedging, and long-term positioning.
Market makers provide liquidity on both sides of the market. They are not directional traders. Their goal is to capture the spread and maintain a neutral position.
Retail traders represent a very small portion of total volume in large, liquid markets.
This leads to an important conclusion: Markets are not moving to target individual stop losses. They are moving to find liquidity.
Understanding Price Through Candles
A candlestick is a visual representation of aggression. A bullish candle means buyers were consistently willing to pay higher prices.
A bearish candle means sellers were willing to accept lower prices.
This has nothing to do with having more buyers or sellers. It reflects which side was more aggressive and whether that aggression led to continuation.
Market Structure: Balance and Imbalance
Instead of focusing on highs and lows, this playbook defines the market as a sequence of:
- Balance (fair value)
- Imbalance (price discovery)
Balance represents agreement. It is where volume builds and where both sides are comfortable trading.
Imbalance occurs when that agreement breaks, and one side dominates, pushing the price away from value.
Markets constantly move between these two states:
Balance → Imbalance → New Balance
Fair Value and Volume
Fair value is the area where most trading activity takes place. It represents the price at which the market agrees that value exists.
When the price moves away from this area, it becomes inefficient. Unless strong participation continues, the price is likely to return back to fair value. This is the foundation for many of the setups in this strategy.
Understanding Stop Runs (Reality vs Myth)
What traders often call “stop-loss hunting” is actually a mechanical process.
Stop orders are market orders. When triggered, they execute immediately, creating a cascade of aggressive buying or selling.
This creates sharp moves.
However, after these moves, liquidity often disappears. The order book becomes thin, and the path of least resistance shifts.
Because of this, the price often reverses after a stop run.
The key insight is:
Markets are not targeting stops. They are reacting to liquidity events.
Order Flow Autocorrelation and Context
Market behavior tends to carry forward.
If a market shows strong buying or selling pressure during one session, there is a higher probability that similar behavior will appear in the following session. This concept, known as order flow autocorrelation, helps build bias.
Additionally, higher timeframes provide context.
A daily candle moving higher suggests that longer-term participants are entering and holding positions, not just trading intraday fluctuations. This explains why markets can trend over time.
The Core Trading Framework
This strategy is built around three primary opportunities:
- Failed auctions below value (reversal long)
- Failed auctions above value (reversal short)
- Breakouts with acceptance (continuation)
Setup 1: Failed Auction Below Value (Reversal Long)
When the price moves below a fair value area, sellers become aggressive.
If those sellers fail to push the price lower and instead get absorbed, it indicates that buyers are stepping in.
This rejection of lower prices creates an opportunity to trade back toward value.
The entry occurs when buyers clearly take control after the failed attempt.
The stop is placed below the area where sellers attempted to dominate.
The target is a return to fair value, and potentially the opposite side of the range.
Setup 2: Failed Auction Above Value (Reversal Short)
This setup is the inverse.
Price moves above value, buyers become aggressive, but fail to continue.
Sellers absorb that pressure and take control.
This rejection of higher prices creates an opportunity to trade back toward value.
The entry occurs after confirmation of seller dominance.
The stop is placed above the failed auction.
The target is a return to fair value.
Setup 3: Breakout with Acceptance (Continuation)
Not all breakouts are valid.
A breakout is only tradable if the market shows acceptance at the new price level.
Acceptance means:
- Price holds outside the level
- Participation continues
- There is no immediate rejection
If price breaks out but quickly returns, it is not a valid breakout. It is a failed auction.
The entry is taken after confirmation that the breakout is supported by real participation.
The stop is placed below the breakout structure.
The target is continuation in the direction of the move.
Order Flow Confirmation (Simplified)
All of this can be reduced to one core question:
Is the aggressive side being accepted or absorbed?
If aggressive buyers push the price higher and continue to do so, they are in control.
If aggressive buyers appear but the price does not move higher, they are being absorbed.
The same logic applies to sellers. This is the key decision-making filter.
Trade Execution Framework
Execution begins with context.
First, identify whether the price is inside or outside the fair value.
Then determine whether the market is attempting to move into imbalance.
Once a setup forms, wait for confirmation from order flow. Only enter when there is clear evidence that one side is in control.
Define invalidation based on where that control would fail.
Manage the trade by monitoring shifts in participation. Exit when opposing pressure takes over.
Opening Range Integration
For traders using opening range breakouts, this strategy adds a layer of confirmation.
Instead of trading every breakout, wait to see whether the move is supported by real participation.
If buyers dominate and price holds above the range, the breakout is valid.
If buyers are absorbed and price returns into the range, the breakout should be avoided.
Risk Management
Risk is defined by logic, not arbitrary price levels.
Stops are placed where the trade idea is invalidated, typically where the opposing side shows control.
Because entries are based on confirmation, this often allows for tighter and more efficient risk placement.
Trade Breakdown
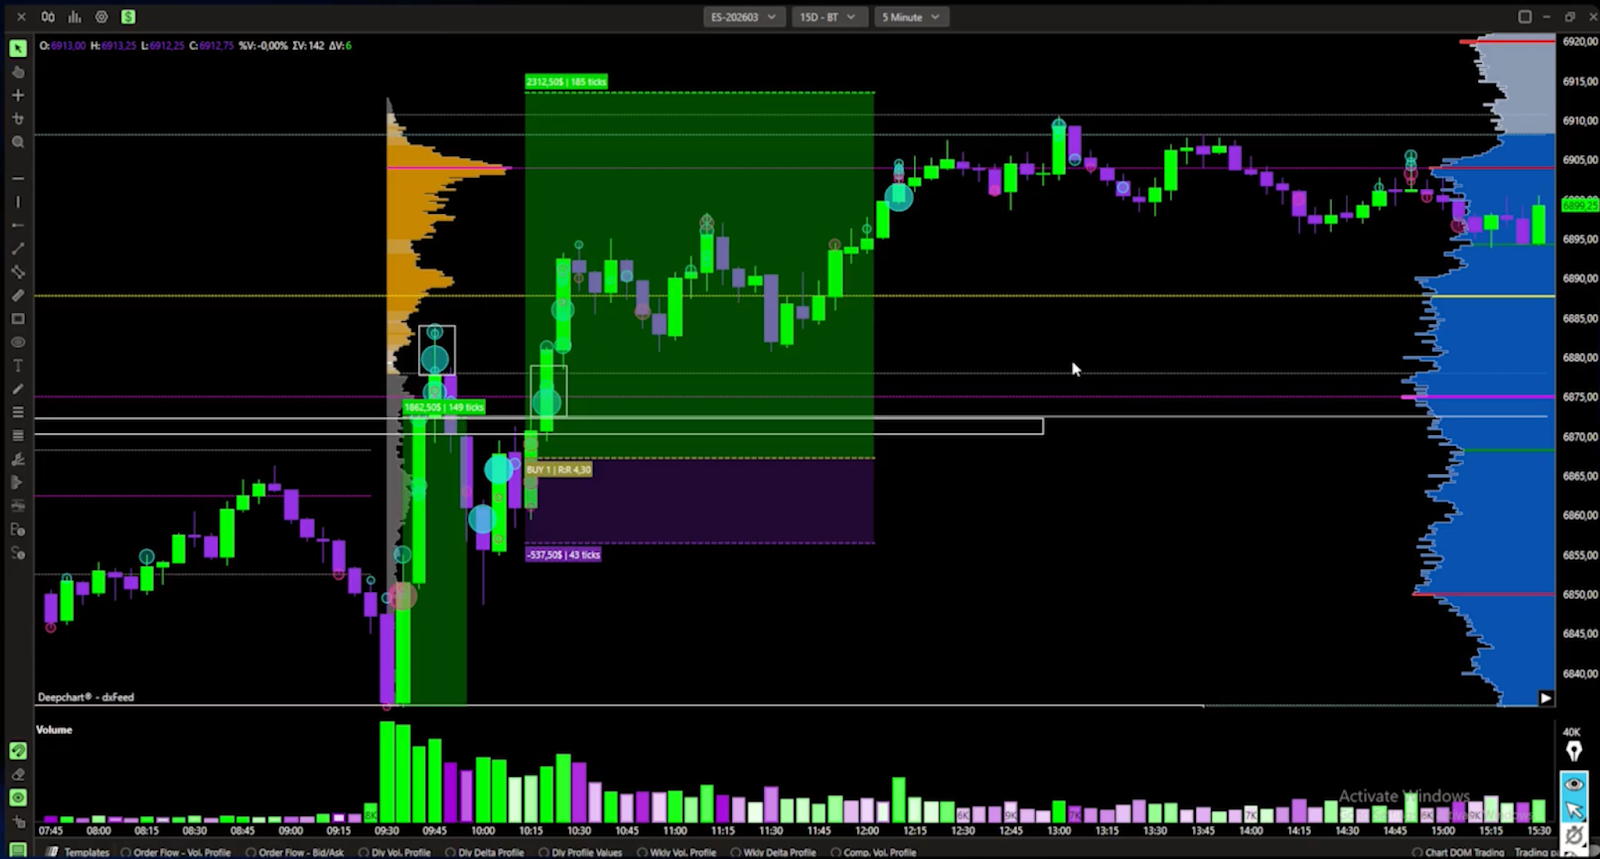
Value Low Reversal + ORB Confirmation
The trade started with a higher timeframe context using the volume profile. Price was positioned at the value area low, while also aligning with the previous day’s value area low. This created a strong confluence, indicating a location where buyers had previously shown interest and were likely to defend again.
At the market open, the price moved lower aggressively. Sellers stepped in with strength, pushing the price down. However, despite this aggression, the price failed to continue lower. The selling pressure did not result in further downside, which indicated that the orders were being absorbed by buyers.
At this point, no trade was taken yet. The presence of absorption alone was not enough. The key was to wait for confirmation that buyers were actually taking control.
Shortly after, a shift occurred. Buyers began stepping in more aggressively, and order flow started to show clear strength. The imbalance transitioned from sellers being aggressive to buyers gaining control. This confirmed that the failed move lower was likely to reverse.
A long position was entered here, near the value area low.
The stop loss was placed below the area where aggressive sellers were previously active. If sellers regained control at that level, the trade idea would be invalid.
As the price moved higher, the trade developed into a rotation back toward value, following the auction principle of moving from imbalance back toward balance.
As the price approached the opening range high, attention shifted to a potential breakout.
The first breakout attempt showed aggressive buyers, but most of the activity appeared on the wick of the candle, not the body. This indicated effort, but not acceptance. Shortly after, price moved back down, confirming that buyers were still being absorbed. No additional position was taken here.
Later, a second attempt occurred.
This time, buyers stepped in with stronger participation, and the activity appeared in the body of the candle, showing clear acceptance above the level. This confirmed that buyers were now in control and that the breakout had a higher probability of continuation.
A second long position was taken here, aligned with the opening range breakout.
The trade was managed based on order flow.
The initial objective was a rotation from the value area low toward the upper side of value, following the auction principle of moving from one side of the range to the other.
As price continued higher, the position was held as long as buyers remained in control.
The exit occurred when buyers began to get absorbed near the highs and sellers started to take control. This shift in order flow signaled that the move was likely ending, and the position was closed.
How to Backtest This Auction Market Theory Strategy
The fastest way to test this Auction Market Theory Strategy is with TradeZella's automated no-code backtesting. Define your rules in plain English, hit run, and TradeZella runs them across 11+ years of historical data in seconds, then shows you every individual trade along with your win rate, profit factor, and expectancy instantly, without you stepping through a single chart. It is the quickest way to see whether the setup holds up before you risk a dollar.
You can also test it manually by replaying the market bar by bar. Set up your volume profile and chart the way you trade live, and replay the session bar by bar. Identify fair value and decide whether price is inside or outside it, then watch for one of the three core setups: a failed auction below value for a reversal long, a failed auction above value for a reversal short, or a breakout with acceptance for a continuation. Wait for order flow to confirm whether the aggressive side is being accepted or absorbed before entering, define invalidation where that control would fail, and target a rotation back to fair value or continuation in the direction of the move. Use automatic position sizing and drag your stop and target directly on the chart. Every trade gets logged automatically with your entry, exit, position size, and P&L. Tag each setup, reversal long, reversal short, and breakout with acceptance, so you can compare them, add notes, tag mistakes, and review the session the same way you would a live trade. After 30 to 50 trades, you can see your win rate, profit factor, and expectancy on this specific setup. Manual replay is the best way to build screen time and a real feel for the setup.
When you start trading live, import your live trades into TradeZella, the AI trading journal that does the journaling for you. Your backtest results and live results live in the same platform, so you always know how the strategy performs in testing vs how it performs with real money, without switching between tools or maintaining separate spreadsheets.
Start Backtesting This Strategy Using TradeZella
Frequently Asked Questions
What is the Auction Market Theory Strategy?
This Auction Market Theory Strategy reads the market as a continuous liquidity auction, where price moves not because there are more buyers than sellers but because one side is more aggressive and willing to accept worse prices to get filled. Instead of trading price patterns alone, you identify where fair value exists, recognize when price moves into imbalance, and determine whether that move is accepted or rejected. The core idea is simple: trade when the market proves that one side is in control.
What actually moves price in a double auction?
The market is a double auction with sell limit orders above price and buy limit orders below. Those limit orders provide liquidity but do not move price; price only moves when a participant becomes aggressive and executes a market order. Since every trade has an equal number of buyers and sellers, what moves price is not an imbalance in quantity but an imbalance in urgency. When traders cannot wait and accept worse prices to get filled, price moves, and large players drive much of this as they split big orders and execute gradually in search of liquidity.
What is balance, imbalance, and fair value?
The strategy defines the market as a sequence of balance and imbalance rather than highs and lows. Balance is agreement, where volume builds and both sides are comfortable trading, and fair value is the area where most trading activity takes place. Imbalance is when that agreement breaks and one side dominates, pushing price away from value into price discovery. Markets constantly move balance to imbalance to new balance, and when price moves away from fair value it becomes inefficient and tends to return unless strong participation continues.
What are the three core setups?
There are three. A failed auction below value is a reversal long: price moves below fair value, sellers get absorbed instead of pushing lower, buyers take control, and you trade back toward value. A failed auction above value is the inverse reversal short. A breakout with acceptance is a continuation: a breakout only qualifies if price holds outside the level with continued participation and no immediate rejection, and if price quickly returns it is a failed auction, not a valid breakout.
How does order flow confirm a trade?
Everything reduces to one question: is the aggressive side being accepted or absorbed? If aggressive buyers push price higher and it keeps moving, they are in control; if they appear but price does not move higher, they are being absorbed, and the same logic applies to sellers. You only enter when order flow shows clear evidence one side is in control, and you exit when opposing pressure takes over. Activity in the body of a candle shows acceptance, while activity only on the wick shows effort without acceptance.
Can I backtest the Auction Market Theory Strategy?
Yes. You can test this strategy using TradeZella's backtesting with 11+ years of historical data. Replay the session with your volume profile, identify fair value and whether price is inside or outside it, then take a failed auction below value, a failed auction above value, or a breakout with acceptance once order flow confirms control. Every trade logs automatically with entry, exit, position size, and P&L, and you can tag each setup separately to compare them. After 30 to 50 trades you can see your win rate, profit factor, and expectancy before risking real money.
What is TradeZella backtesting?
TradeZella backtesting lets you test a trading strategy against 11+ years of historical market data across forex, futures, stocks, and crypto, down to seconds-level timeframes. You can do it two ways. Replay the market bar by bar and place trades as if you were trading live, with your own timeframes, automatic position sizing, and stops and targets you drag right on the chart, and every trade logs automatically with entry, exit, size, and P&L. Or use automated no-code backtesting: define your strategy rules in plain English and the engine runs them across years of data in seconds, returning every individual trade it took with the exact setup drawn on the chart, so you see why each trade fired instead of just an equity curve. Zella AI then analyzes the results and flags what to fix.