


Built For
Instruments: Stocks
Trading Style: Swing Trading
Strategy Overview
This strategy is built around identifying high-probability swing trade setups by aligning with institutional buying behavior, sector strength, and clean technical structures. The goal is to eliminate FOMO by having clearly defined entry tactics, proper position sizing, and a deep understanding of where big money is flowing.
This approach focuses on 5 to 6 repeatable price action setups, anchored around earnings gaps, high volume closes, and breakout patterns. It leverages simple moving averages and a disciplined process to scale positions only when the market, group, and setup are aligned.
Key Principles
Trade with Institutional Footprints
Prioritize stocks showing clear signs of institutional accumulation, such as high-volume breakouts, relative strength, and repeated strong closes near highs.
Align with Market and Group Strength
Trades are only taken when the broader market and the stock’s sector or group support the trade’s direction. Stocks in leading groups tend to go down the least during pullbacks and up the most during rallies.
Always use Defined Risk
Every setup includes a precise stop-loss level based on price structure, typically the low of the day, a recent swing low, or a major moving average.
Patience and Progressive Exposure
The method is built on patience. If a move is missed, wait for a new setup. Position size is increased progressively as trades work and the market trend confirms.
Daily Chart First, Intraday for Entry
The setup is always based on the daily chart. The 5-minute chart is used to refine execution, such as for opening range breaks or clean reclaim entries, not for making trade decisions.
Core Setups
Episodic Pivot (EP)
A large gap up, typically on earnings or news, with volume significantly above the average daily volume.
Criteria
- Look for a trending stock that gaps up on unexpected news or earnings.
- Confirm volume is multiple times the normal daily average, indicating institutional interest.
Entry
- Use an Opening Range Break (ORB) on the five-minute chart. Enter above the high of the first five-minute bar.
- Stop-loss is placed at the low of day.
- Adjust position size based on the distance from entry to stop relative to the stock’s typical daily movement.
Context
This setup works best when the market is healthy and trending. If the broader trend is supportive, the strongest EP gaps often do not retest their gap level, so acting quickly is key.
Delayed High Volume Close (HVC)
A variation of the EP. If the stock gaps strongly and a trader does not take the initial gap, a secondary opportunity exists using the high-volume close.
Criteria
- Identify the closing price on the day of the earnings gap.
- Ensure that the volume on the gap day is well above average.
Entry
- Draw a horizontal line at the high-volume close.
- Enter as price breaks back through that close on any day afterward. Do not wait for a daily close confirmation; enter on the break.
- Stop-loss is set at the low of the day when the entry is triggered.
Context
This entry provides a second chance to catch an institutional accumulation move without chasing an extended price. This approach works best if the stock consolidates near the HVC for several days and then breaks through.
Flat Base Breakout
A horizontal consolidation where price builds a tight range over multiple weeks, often following a strong prior trend.
Criteria
- Price moves sideways with clear resistance forming a flat upper boundary.
- The 10-day or 20-day moving average should tighten up near the price.
- Look for progressively smaller daily ranges near the breakout level.
Entry
- Enter above the prior day’s high, which also clears the flat base resistance.
- If the daily candle is very tight, the stop-loss is placed at the previous day’s low.
- If the candle is wide or includes a wick, the stop-loss is set to the low of the breakout day.
Context
Flat bases build pressure for strong directional moves when they break. The longer the base, the more powerful the breakout can be.
Undercut and Rally (U&R)
A classic shakeout setup. Price dips below a major support level or swing low, shakes out weak holders, then immediately reclaims that level.
Criteria
- Look for a clear prior low that attracts stops.
- Wait for a quick undercut of that low, followed by a reversal back above.
Entry
- Enter when price reclaims the prior low.
- Stop-loss is placed at the new swing low formed during the undercut.
Context
U&R setups often appear after shakeouts during corrections or near short-term turning points. They offer a clean technical entry with defined risk and are especially useful in environments where the broader market is stabilizing and showing signs of recovery.
Moving Average Undercut and Rally (MA U&R)
Similar to the U&R but based on key moving averages instead of a swing low.
Criteria
- Price moves below a significant daily moving average (such as the 10-day, 20-day, or 50-day)
- It then reclaims the moving average with strength, ideally supported by increased volume.
Entry
- Enter as price rallies back through the moving average.
- Stop-loss is set at the low of the reclaim day.
Context
This pattern signals a failed breakdown at a moving average that often traps short sellers and attracts new buyers.
High Tight Flag
A powerful trend continuation setup. After a sharp run-up, price moves sideways in a tight range rather than pulling back deeply.
Criteria
- Price advances 50% to 100% in a short period.
- A tight flag forms, lasting two to five weeks, with price holding near highs.
- Volume contracts during the flag formation.
Entry
- Enter when the price breaks through the upper half of the tight range.
- Stop-loss is placed at the low of the breakout day.
Context
This pattern shows strong institutional activity and often leads to significant upside if the breakout holds.
Execution Process
Identify the Setup
Use the daily chart to find clear signs of accumulation or valid bases forming. Confirm the stock is in a strong group and the market is supportive.
Define Entry and Stop
Mark entry level and stop-loss clearly in advance. Use a five-minute chart for intraday timing if needed.
Adjust Position Size
Calculate position size so that the maximum portfolio risk per trade is small, even if stopped out. Typical risk ranges from 0.5% to 1% of total equity.
Monitor Price and Volume
Watch for confirmation of strength: strong closes, expanding volume on breakout days, and relative strength vs. the market.
Manage the Trade
Take partial profits into strength, especially after three to five strong days. Trail the remaining position using rising moving averages like the 10-day or 20-day to stay in winning trades.
React, Don’t Predict
If the stock violates your trailing stop or closes below key levels on high volume, exit the trade without hesitation.
Pros and Cons of the Strategy
This Strategy is designed to deliver high-quality, repeatable setups — but like any trading strategy, there are key things to understand before using it.
Note: The cons listed here aren’t disadvantages. They are things to be aware of — important characteristics that require patience, discipline, and proper management to make the strategy work effectively.
Pros
- Scalable: This approach allows you to size up when things are working. If you’re in a strong setup and the group starts moving, it opens the door to layer into other names with conviction.
- Structured and Repeatable: You’re trading a handful of defined setups EPs, HVCs, flat bases, UNRs, so there’s no guessing. You know the entry, the stop, and how you’ll manage the trade.
- Aligned with Strength: Focuses on stocks showing relative strength in the strongest sectors. When the market’s healthy, these are the names that lead and continue to push higher.
- Built-in Risk Management: Each setup has a clear risk point, low of day, prior candle, or moving average, so risk is defined from the start. That makes it easier to hold winners and cut losers fast.
- FOMO-Proof: You’re not chasing random momentum. You’re waiting for setups to form, letting the market pull you in, and executing only when the odds are in your favor.
Cons
- Struggles in Weak Markets: If the overall market isn’t trending cleanly, setups often fail. You’ll see more false breakouts, fake moves, and shakeouts.
- Paper Cuts Are Common: Because stops are tight, you’ll take plenty of small losses. It’s part of the process, but emotionally, it can add up during slower periods.
- Progress Can Feel Slow Sometimes, you’ll go through stretches where nothing is setting up. There’s no constant stream of trades, and that can feel unproductive if you’re used to active trading.
- Emotion Can Still Interfere. It’s easy to get attached to a name, especially one you believe in fundamentally, and hold too long, skip trims, or ignore exit signals.
- Discipline Is Non-Negotiable: The setups work, but only if you follow the process exactly. That means no chasing, no oversized positions, and no shortcuts.
Trade Breakdown
Flat Base Breakout (Post-Earnings)
The Setup
NVDA gapped up on strong earnings with a significant increase in volume. Rather than entering on the gap-up day, the stock was put on watch.
Over the next several weeks, the price consolidated in a tight, sideways range. This created a clear flat base pattern. Moving averages (10-day, 20-day, and 50-day) began to converge and support the price from below, showing strong structure. The setup showed signs of institutional accumulation and a potential breakout.
Entry
The entry was taken on a clean breakout above the flat base. The breakout candle was tight, with strong momentum and clear confirmation that buyers were in control.
- Trigger: Break of the flat base high
- Entry Type: Market order on the breakout
- Chart: Tight consolidation, rising moving averages, volume confirmation
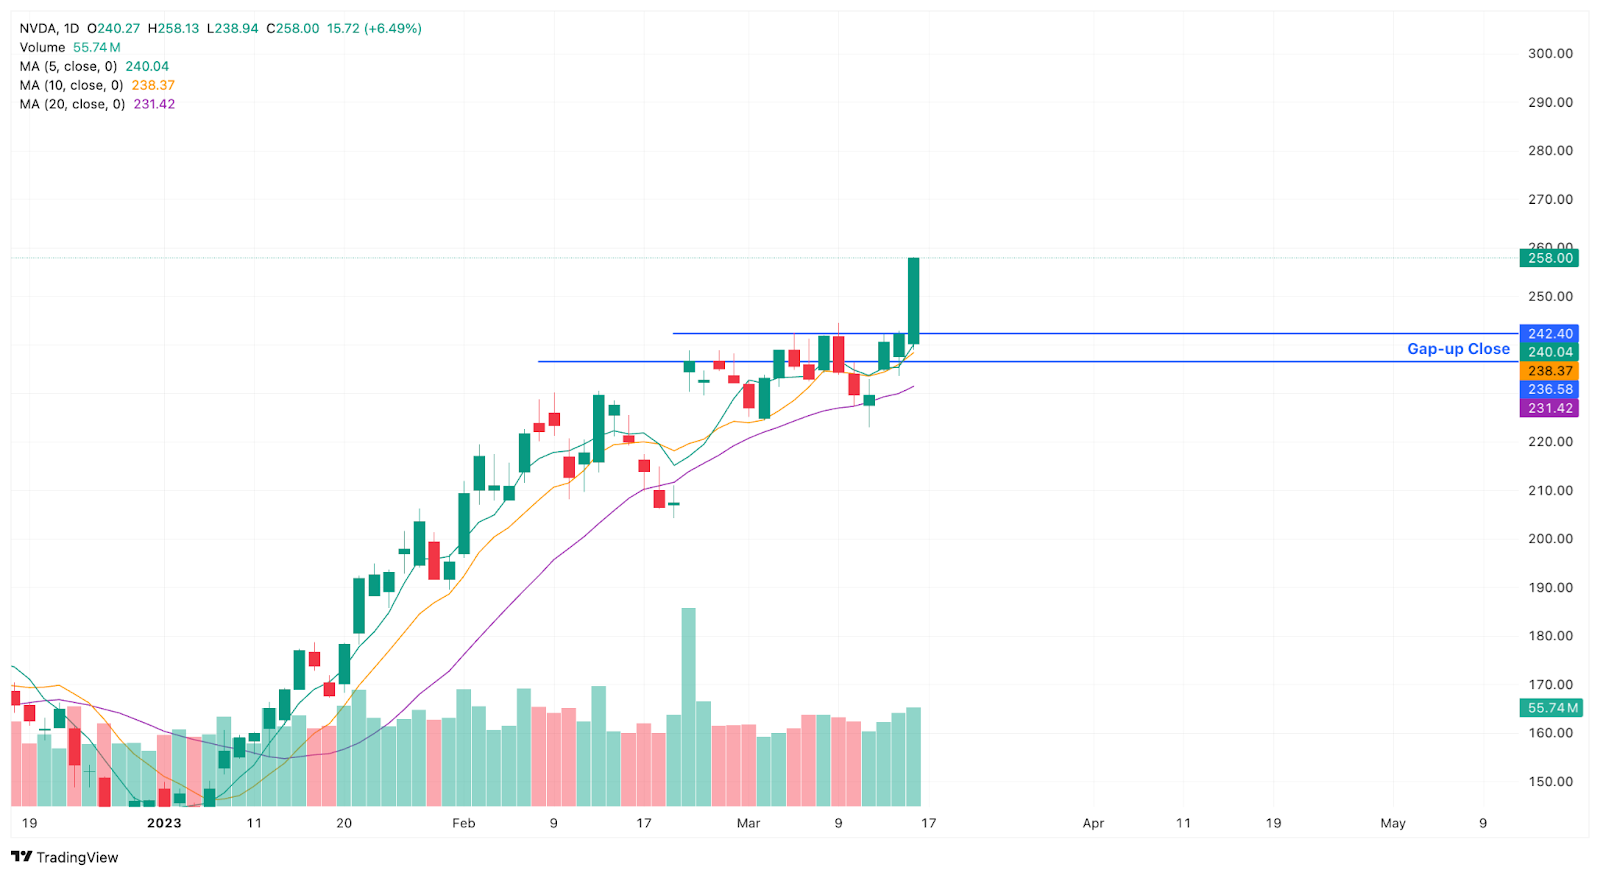
Stop-Loss
- Stop: Low of the previous day’s candle
- Reasoning: The breakout day’s range was very narrow, so using the previous day’s low provided a more reasonable stop distance while still keeping risk tight and defined
Position Sizing
Position size was based on the distance from entry to stop. The tighter the risk, the larger the position size could be without exceeding portfolio risk limits. This allowed for a strong initial size without overexposure.
Trade Management
As the stock pushed higher after the breakout:
- A portion of the position was trimmed into strength to lock in gains
- The remainder was managed using a trailing stop based on the 10-day and 20-day moving averages
- As long as price stayed above the moving averages, the position remained active.
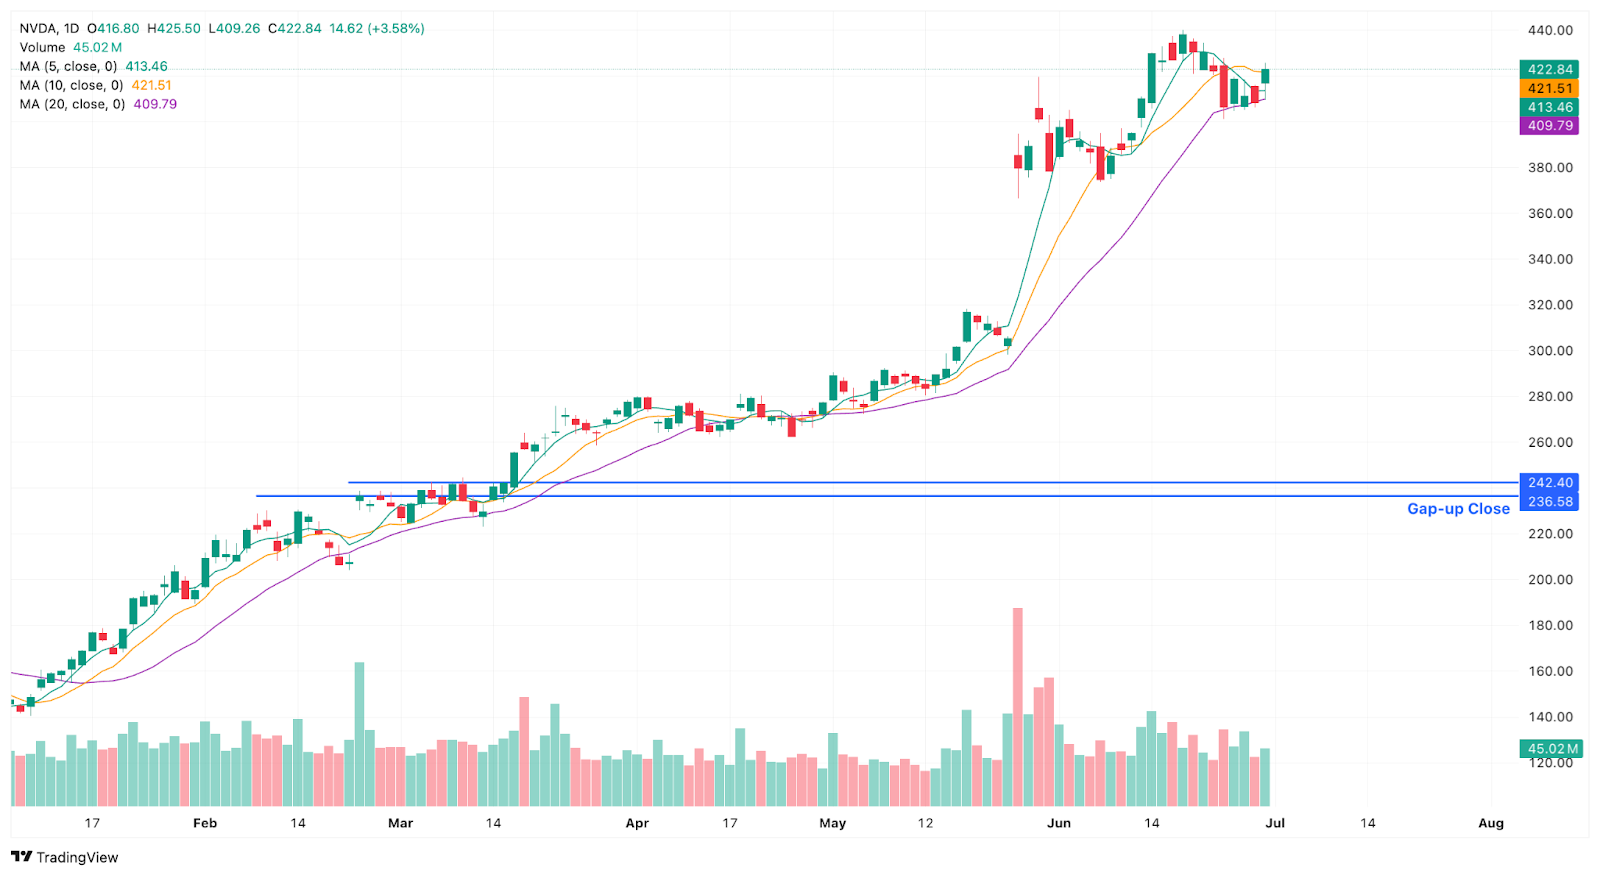
The trade was fully exited after a bearish reversal candle signaled weakness and a potential end to the move. This allowed the trade to capture the majority of the breakout while protecting gains.
How to Backtest This Real Simple Strategy
The fastest way to test this Real Simple strategy is with TradeZella's automated no-code backtesting. Define your rules in plain English, hit run, and TradeZella runs them across 11+ years of historical data in seconds, then shows you every individual trade along with your win rate, profit factor, and expectancy instantly, without you stepping through a single chart. It is the quickest way to see whether the setup holds up before you risk a dollar.
You can also test it manually by replaying the market bar by bar. Load 11+ years of historical data, set up your daily chart with the 10-day, 20-day, and 50-day moving averages the way you trade live, and use the 5-minute chart to refine entries. Find your setup on the daily chart, whether an Episodic Pivot, a High Volume Close, a flat base breakout, an Undercut and Rally, or a High Tight Flag, then mark your entry and your stop at the low of day, prior candle, or moving average. Place your trade with automatic position sizing so risk stays at a small percentage of equity, and trail the runner using the rising 10-day or 20-day moving average. Every trade gets logged automatically with your entry, exit, position size, and P&L. Tag each setup type so you can compare them, add notes, and review the same way you would a live trade. After 30 to 50 trades, you can see your win rate, profit factor, and expectancy on each setup. Manual replay is the best way to build screen time and a real feel for the setup.
When you start trading live, import your live trades into TradeZella, the AI trading journal that does the journaling for you. Your backtest results and live results live in the same platform, so you always know how the strategy performs in testing vs how it performs with real money, without switching between tools or maintaining separate spreadsheets.
Start Backtesting This Strategy Using TradeZella
Frequently Asked Questions
What is the Real Simple Strategy?
The Real Simple Strategy is a repeatable swing trading system for stocks built around aligning with institutional buying, sector strength, and clean technical structure. It uses a handful of defined price action setups anchored on earnings gaps, high-volume closes, and breakouts, with the daily chart for setup decisions and the 5-minute chart only for entry timing. The goal is to eliminate FOMO with clear entries, defined risk, and progressive position sizing that scales only when the market, group, and setup all align.
What is an Episodic Pivot (EP)?
An Episodic Pivot is a large gap up, usually on earnings or news, with volume well above the stock's average. It signals institutional interest in a trending name. The entry uses an Opening Range Break on the 5-minute chart, going long above the high of the first 5-minute bar, with the stop at the low of day. It works best in a healthy, trending market, where the strongest EP gaps often do not retest the gap level, so acting quickly matters.
What are the core setups in this strategy?
The strategy is built on five to six repeatable setups: the Episodic Pivot, the Delayed High Volume Close (a second chance to enter an EP at the gap-day closing price), the Flat Base Breakout, the Undercut and Rally shakeout, the Moving Average Undercut and Rally, and the High Tight Flag continuation pattern. Each one has a defined entry, a clear stop at price structure or a moving average, and a context for when it works best, so there is no guessing on execution.
How much should you risk per trade?
Position size is calculated from the distance between entry and stop so that maximum risk per trade stays small, typically around 0.5% to 1% of total equity even if you are stopped out. The tighter the risk on a setup, the larger the share size can be without exceeding that limit. Exposure is then increased progressively as trades work and the market trend confirms, rather than sizing up all at once.
What instruments and style does this strategy use?
This is a swing trading strategy for stocks, focused on names showing relative strength in the strongest sectors. Setups are always based on the daily chart, with the 5-minute chart used only to refine execution like opening range breaks or clean reclaims. It performs best when the broader market is trending cleanly and tends to struggle in weak or choppy markets, where breakouts fail and shakeouts are more common.
Can I backtest the Real Simple Strategy?
Yes. You can test this strategy using TradeZella's backtesting with 11+ years of historical data. Replay the daily chart with your moving averages, find each setup as it forms, mark your entry and stop, and use the 5-minute chart for timing. Every trade logs automatically with entry, exit, position size, and P&L, and you can tag each setup type separately to see which ones produce your edge. Add notes, tag mistakes, and review the same way you would a live trade. After 30 to 50 trades you can see your win rate, profit factor, and expectancy on each setup before risking real money.
What is TradeZella backtesting?
TradeZella backtesting lets you test a trading strategy against 11+ years of historical market data across forex, futures, stocks, and crypto, down to seconds-level timeframes. You can do it two ways. Replay the market bar by bar and place trades as if you were trading live, with your own timeframes, automatic position sizing, and stops and targets you drag right on the chart, and every trade logs automatically with entry, exit, size, and P&L. Or use automated no-code backtesting: define your strategy rules in plain English and the engine runs them across years of data in seconds, returning every individual trade it took with the exact setup drawn on the chart, so you see why each trade fired instead of just an equity curve. Zella AI then analyzes the results and flags what to fix.