


Built For
Instruments: Multi-Asset (Stocks, ETFs, Crypto, Futures, Forex)
Trading Style: Swing Trading
Strategy Overview
Ted Zhang uses Stan Weinstein-style stage analysis to classify an asset as basing, trending, topping, or declining before capital is committed. His approach is a higher-time-frame decision framework for stocks, ETFs, crypto, commodities, fixed income, currencies, and other liquid assets.
The method combines price structure with the 10-week, 20-week, 30-week, and 40-week simple moving averages. Price structure shows whether the market is building higher highs and higher lows or lower highs and lower lows. The moving averages smooth the trend, reveal whether momentum is strengthening or flattening, and expose the transition periods where price begins chopping instead of trending cleanly.
The edge is not a single moving-average crossover. The edge comes from knowing which part of the price cycle is active, aligning with the dominant trend, and stepping aside when the market becomes destructive or indecisive. The objective is to capture the cleaner middle of the move rather than pay for early anticipation or late-stage optimism.
Instruments and Trading Style
This framework is built for liquid stocks, ETFs, crypto, commodities, fixed income, and currencies. It is most useful for swing and position trading, where the weekly chart provides the long-term wind behind the trade.
Timeframes
Use the weekly chart to classify the primary stage and the daily chart to refine the entry. The concept is fractal: faster traders can adapt the same logic to lower timeframes after studying how the stages behave at their chosen horizon.
Tools and Skill Level
Plot the 10-week, 20-week, 30-week, and 40-week simple moving averages alongside price structure and volume. Relative-strength scans and stage-breadth data can improve the review process, but the framework remains readable with a clean chart and disciplined observation.
Core Idea
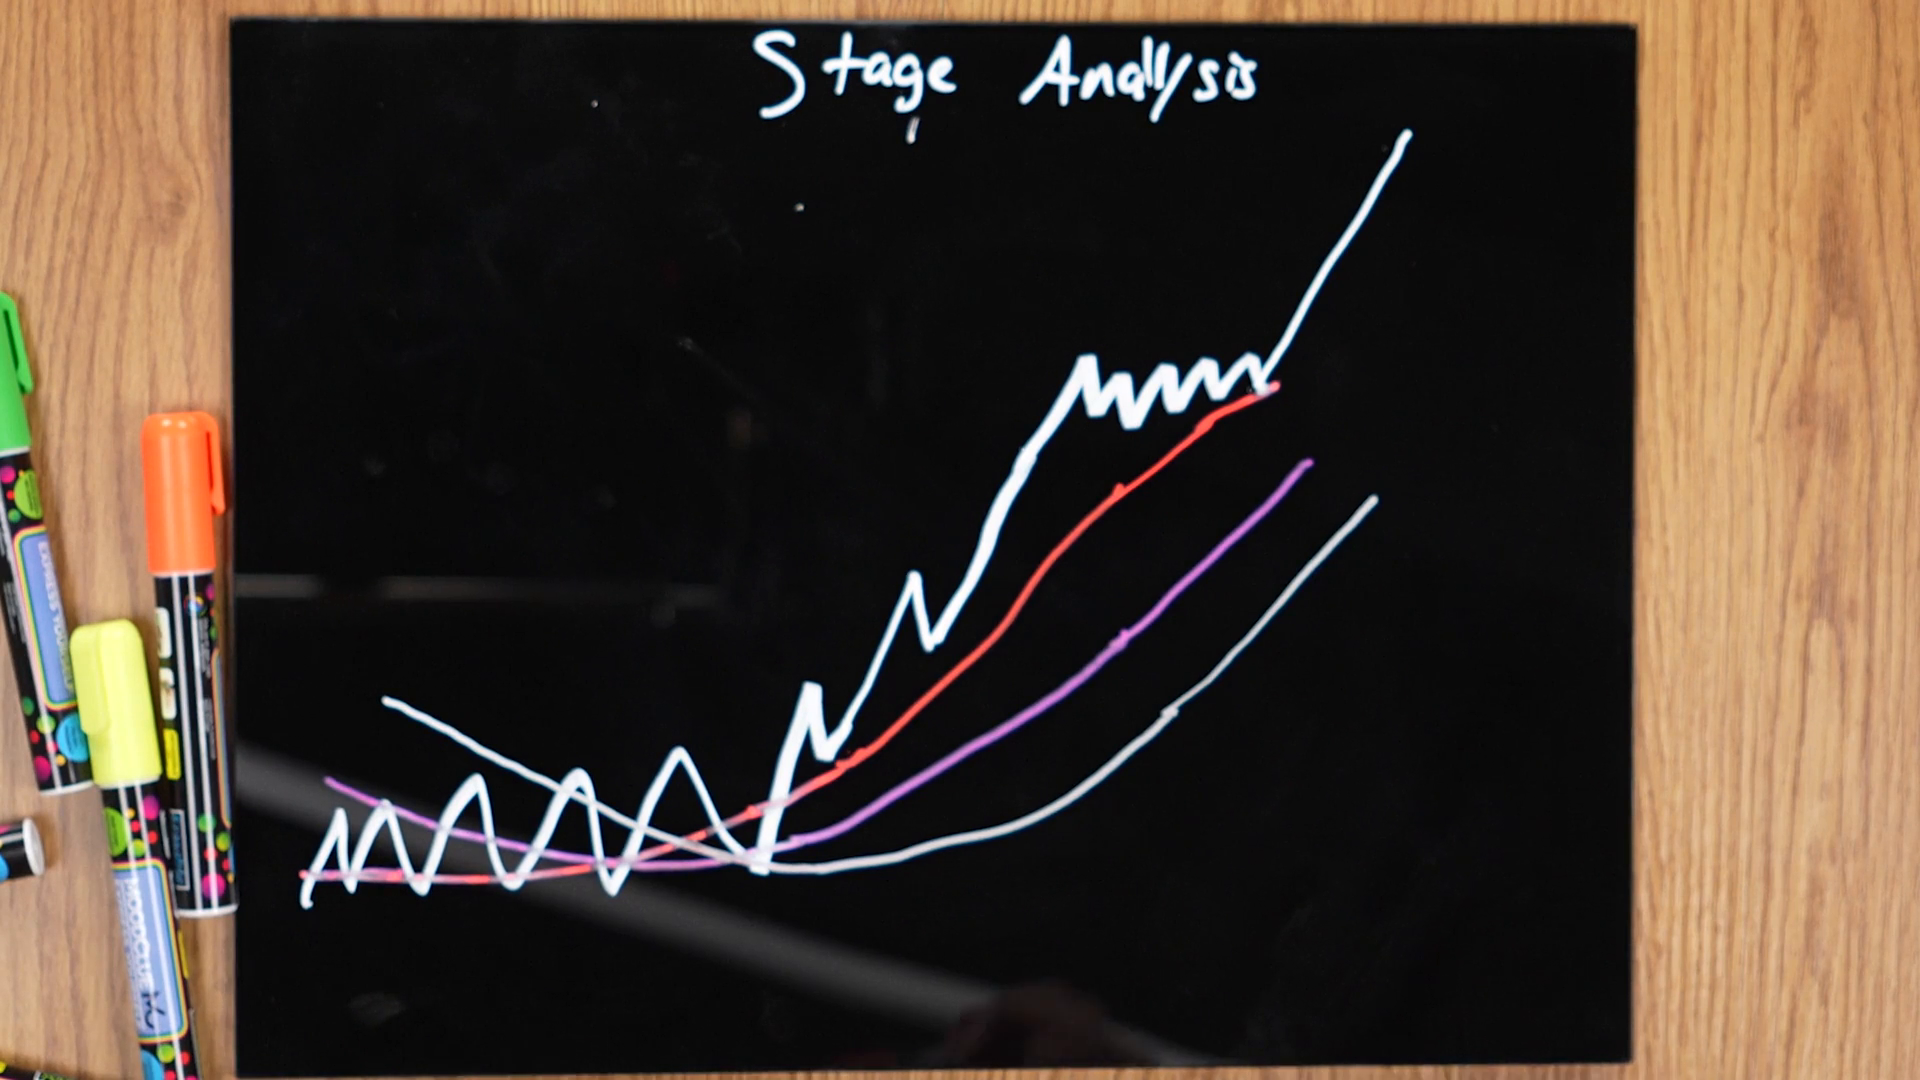
Markets move through a repeating four-stage cycle:
- Stage 1 is the basing period after a decline.
- Stage 2 is the uptrend where long exposure is favored.
- Stage 3 is the topping period where risk should be reduced.
- Stage 4 is the downtrend where longs should usually be avoided and short setups may be favored.
Start with the weekly chart. Once the stage is clear, move to the daily chart and look for an entry that fits the higher-time-frame direction. Do not buy simply because an asset looks cheap, and do not keep holding simply because the news still sounds good.
How the Setup Is Built
Step 1: Classify the Weekly Stage
Begin with price structure. Higher highs and higher lows show an uptrend; lower highs and lower lows show a downtrend. Then compare price with the four weekly simple moving averages and study their slope and alignment. When price repeatedly slices through flat averages, the market is transitioning rather than trending cleanly.
The weekly review should answer four quick questions:
- Is price above or below the key moving averages?
- Are the moving averages rising, falling, or flattening?
- Is price trending cleanly or repeatedly slicing through the averages?
- Is the asset building higher highs and higher lows or lower highs and lower lows?
Step 2: Focus on the Actionable Stage
Stage 2 is the main environment for long ideas. Price is above the key weekly averages, the shorter averages are rising above the slower ones, and pullbacks are more likely to become opportunities than traps.
Stage 1 and Stage 3 deserve patience. They are the void stages where false starts and chop are common. Stage 1 can last for weeks, months, or even years before a real breakout appears. Stage 3 can look harmless while price becomes wide and loose, breakouts begin failing, and the moving averages flatten into price.
Stage 4 is the capital-preservation stage for long-biased traders. Price is below the key averages, the averages slope down, and lower highs and lower lows dominate. A short-term rally inside this environment is not the same thing as a new uptrend.
Step 3: Use the Daily Chart for the Trade
Stage analysis is the trend gauge, not the exact entry trigger. After the weekly chart provides the direction, use the daily chart to find a breakout or continuation base with a clear invalidation point. One of the strongest opportunities is the first multi-month base after a strong initial move into Stage 2.
Strategy Rules
Bias Rules
Prefer long exposure when an asset is entering or already in Stage 2. Avoid long exposure during a clean Stage 4 decline. Treat Stage 1 and Stage 3 as environments for observation, reduction, and preparation rather than aggressive positioning.
The broader market matters. If an increasing number of stocks are shifting into Stage 3 and Stage 4, confidence in new long exposure should fall. A narrative, theme, fundamental story, or catalyst can improve conviction, but price still has to confirm the story.
Stage 1: Basing and Accumulation
Stage 1 usually follows a Stage 4 decline. The rate of decline begins to flatten, the 10-week moving average catches up to price, and the slower averages gradually converge. Price oscillates above and below those averages instead of continuing to collapse. Bad news may still be common, but it stops pushing the asset meaningfully lower.
This is where early buyers often get punished. A possible base is not yet a trade. Wait for evidence that price is leaving the range and beginning a genuine Stage 2 transition.
Stage 2: Uptrend and Markup
Stage 2 begins when price breaks out of a base and trends above the key weekly averages. Price builds higher highs and higher lows. The 10-week moving average rises above the 20-week and 30-week averages, while the slower averages begin turning upward beneath price.
This is the stage for long exposure. Look for constructive daily breakouts and continuation bases while the weekly trend remains intact. The best setups make the risk obvious: there is a level that should hold if the trend is real.
The clearest Stage 2 characteristics are:
- Price above the 10-week, 20-week, 30-week, and 40-week averages.
- Higher highs and higher lows.
- The 10-week average above the 20-week and 30-week averages.
- Pullbacks that hold near rising weekly support.
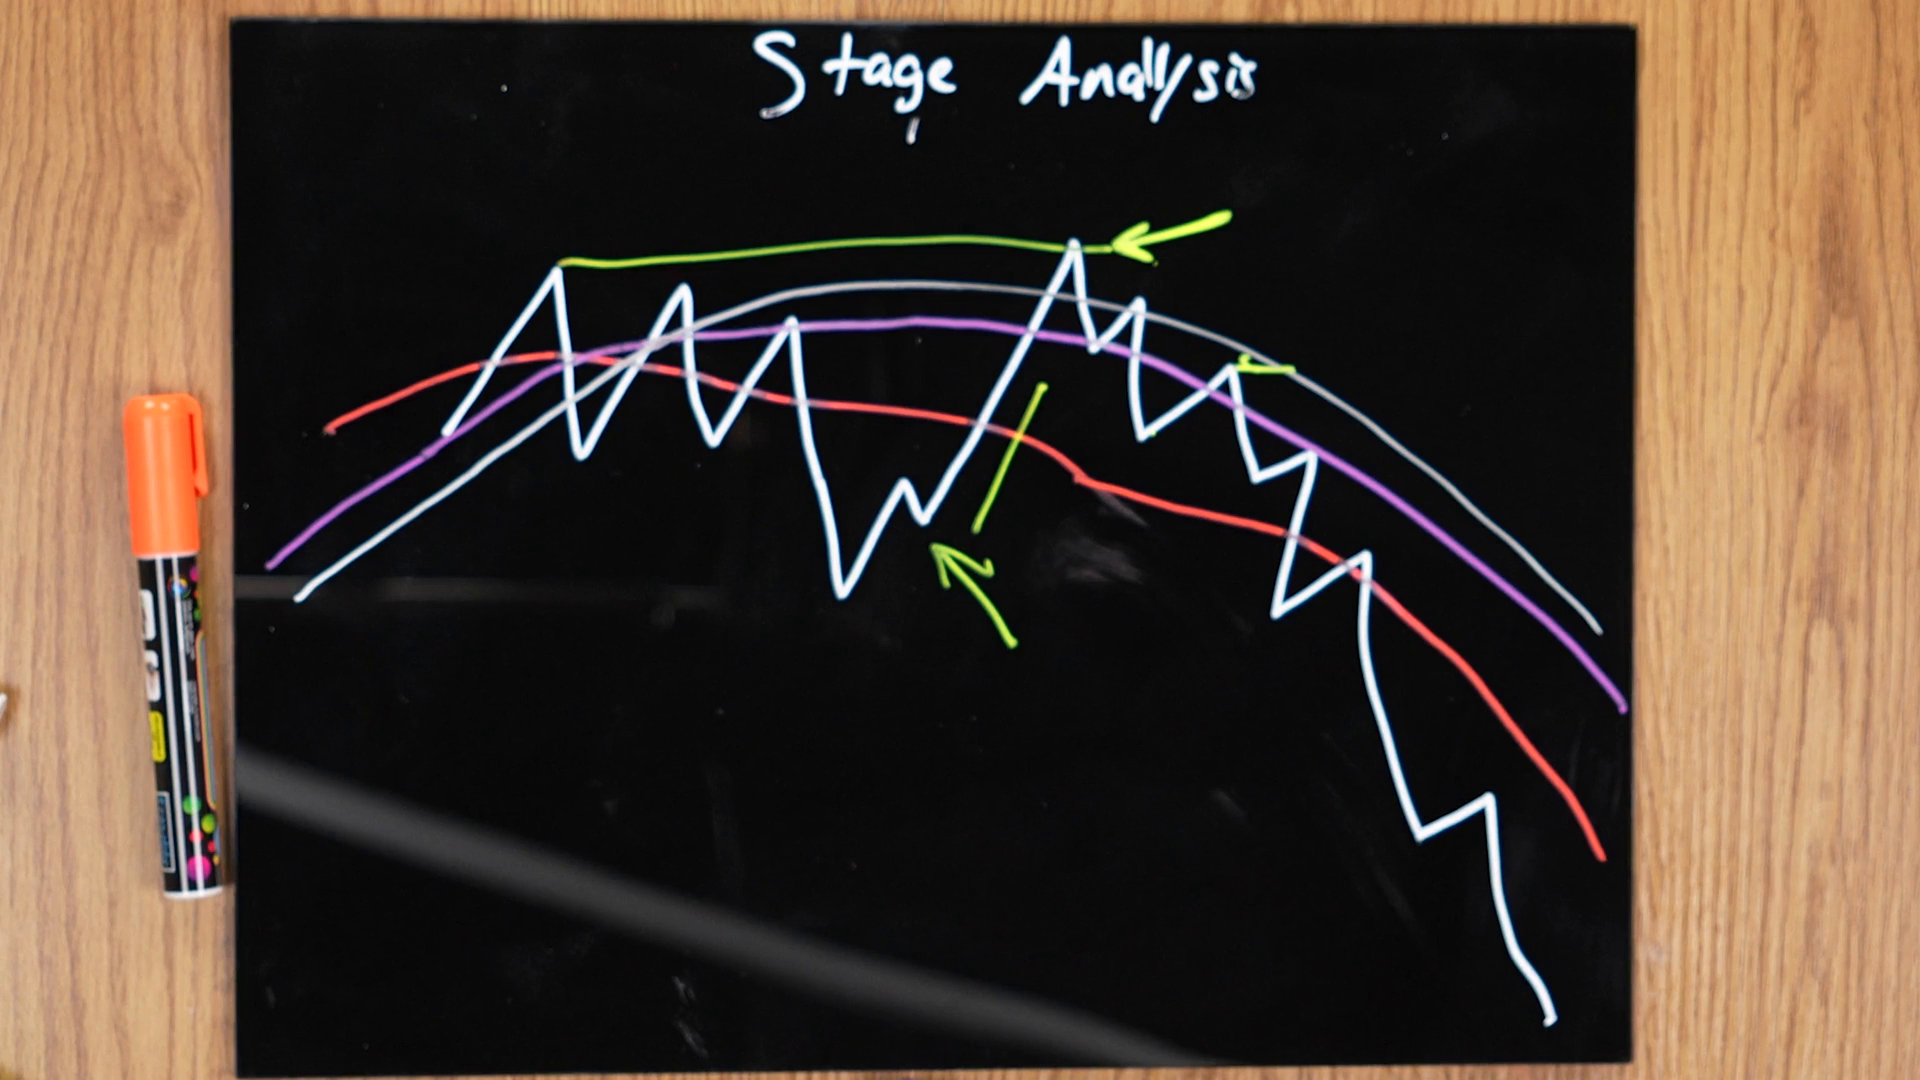
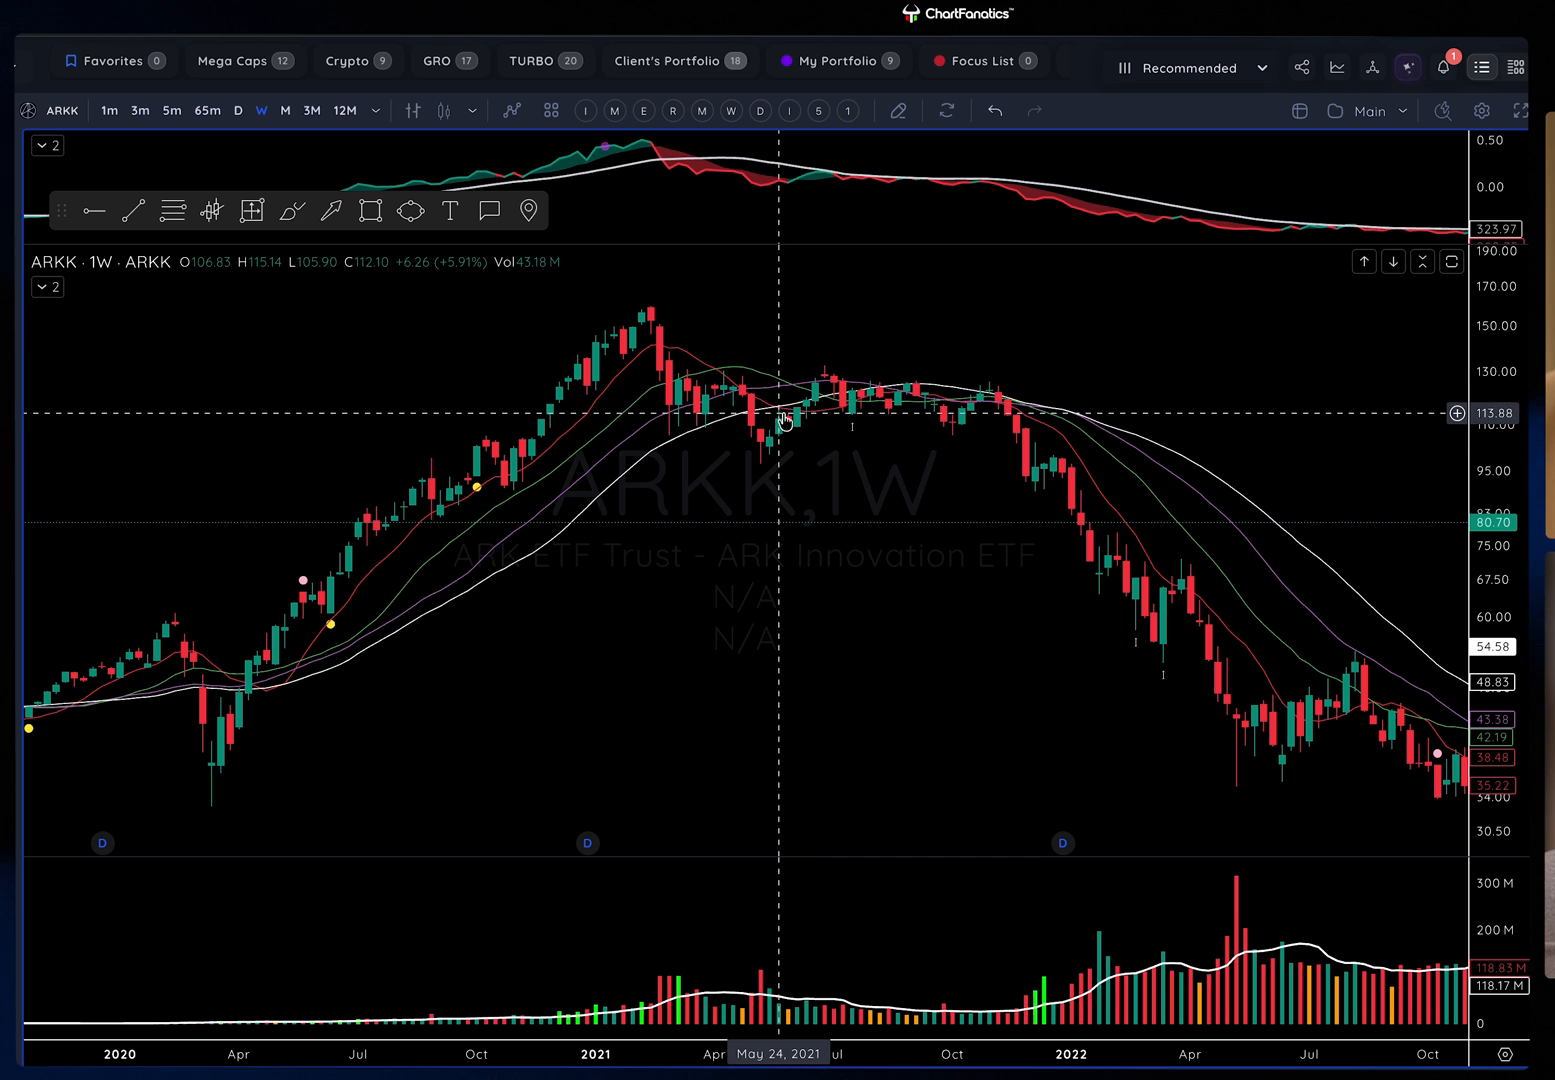
Stage 3: Topping and Distribution
Stage 3 often follows an extended Stage 2 advance. Price becomes wide, loose, and sideways. The moving averages flatten and catch up. Breakouts lose their follow-through, and good news may produce disappointing reactions.
That poor reaction to good news is important. If the market has every reason to move higher but cannot sustain the move, the tape is warning that expectations may already be priced in. Protect gains, reduce exposure, and stop treating every dip as an automatic buying opportunity.
Watch for:
- Wide and loose price action after a large advance.
- Moving averages flattening and slicing through price.
- Failed breakouts or weak follow-through.
- Good news that cannot push price meaningfully higher.
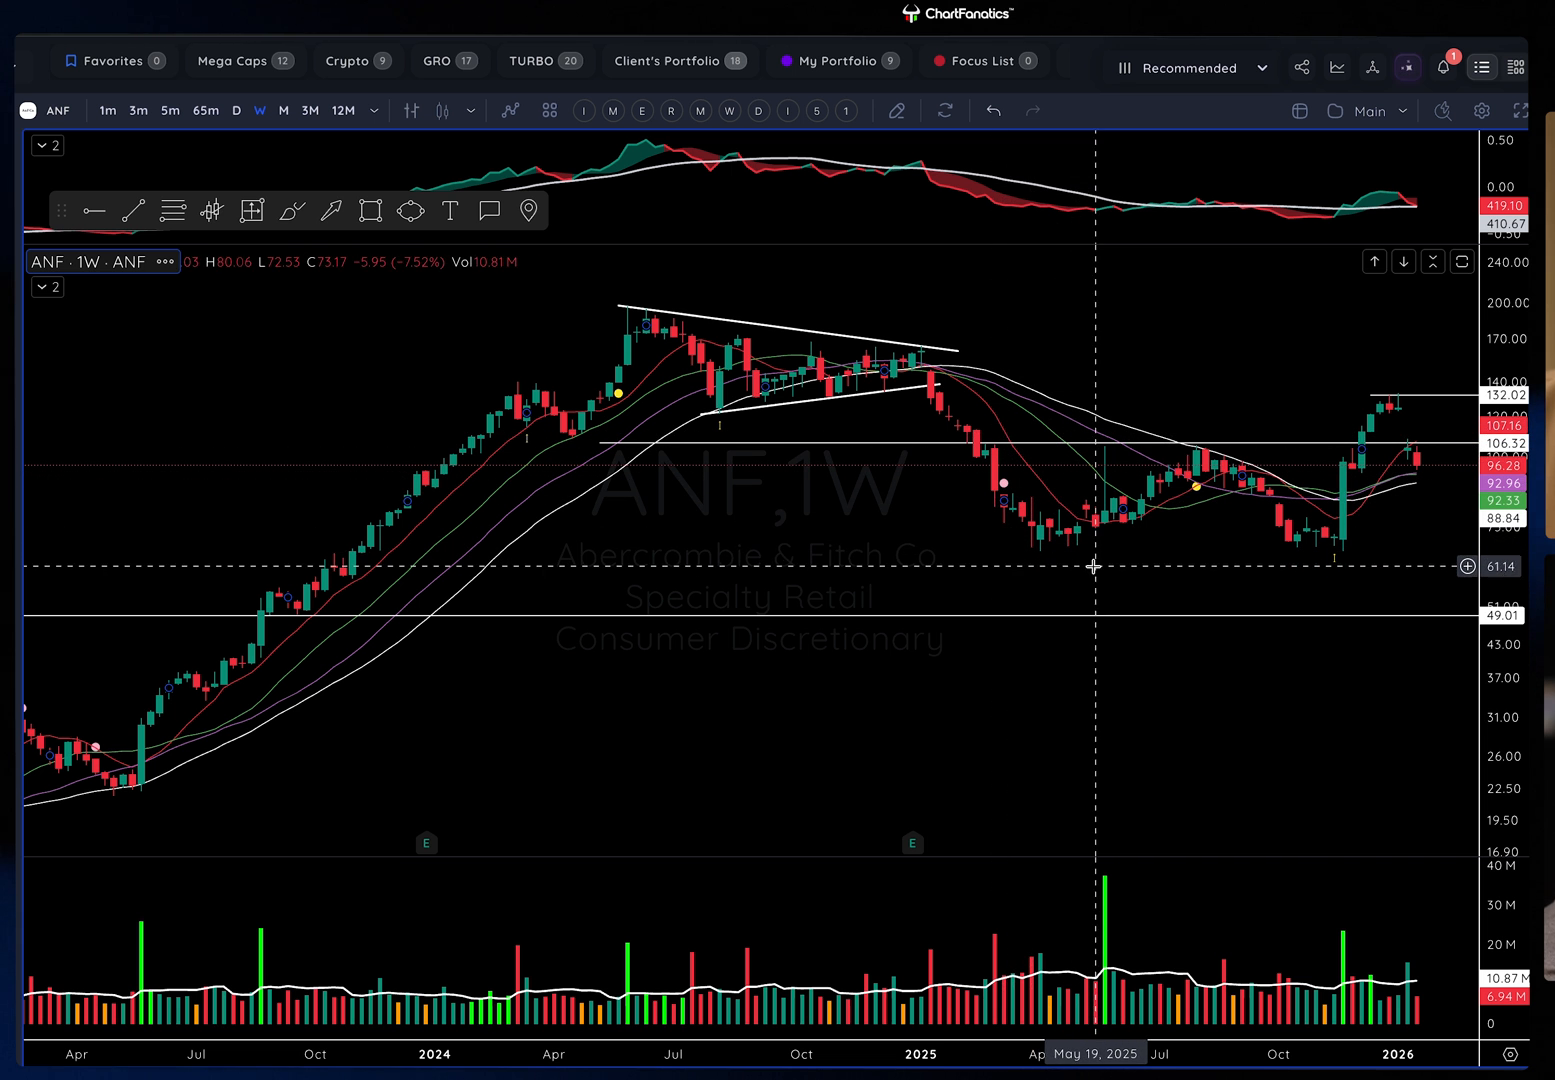
Abercrombie & Fitch Stage 3 Breakdown
Abercrombie & Fitch shows why price reaction matters more than the headline. After a major Stage 2 advance, the stock became wide and loose while the moving averages flattened and began slicing through price. The decisive warning arrived when better-than-expected earnings produced a gap down instead of renewed strength.
Zhang used that failed reaction as a personal short signal. The lesson is not to short every disappointing earnings response. The lesson is that good news failing inside an already deteriorating Stage 3 structure can confirm that institutions are distributing rather than accumulating.
Stage 4: Downtrend and Markdown
Stage 4 begins when price breaks below the key weekly averages and the trend turns down. Price builds lower highs and lower lows, the 10-week moving average falls below the 30-week, and the 30-week falls below the 40-week. The bearish alignment makes the long-term direction easy to read at a glance.
Long-biased traders should preserve capital here. Short-biased traders can use Stage 4 as the higher-time-frame direction for their own setups, but the larger lesson is simple: do not confuse a temporary bounce with a new bull cycle.
Setup Qualification
For long continuation trades, require a Stage 2 environment and a clean base rather than a loose, erratic range. The first multi-month base is especially attractive after a strong initial Stage 2 leg. Ideally, price holds near the 10-week or 20-week moving average, shakes out weak holders, reclaims the lows, builds higher lows, and tightens on the right side before breaking out with volume.
A strong first multi-month base usually includes:
- A large initial Stage 2 move.
- Support near the 10-week or 20-week moving average.
- A shakeout followed by reclaimed lows.
- Higher lows and tightening action on the right side.
- A clearly defined breakout area.
Entry Models
Stage 2 Transition
The transition entry appears as price leaves a Stage 1 base and reclaims the key weekly moving averages. Interest improves once price is above the 10-week, 20-week, 30-week, and 40-week averages, with the 10-week above the 20-week and 30-week. Use the daily chart to enter on a defined breakout as the weekly trend turns up.
First Multi-Month Base Continuation
After the first strong move into Stage 2, wait for the asset to digest its gains. The ideal base forms while price surfs the 10-week or 20-week moving average and becomes tighter on the right side. A shakeout, reclaimed lows, and higher lows show that supply is being absorbed. Enter when price resolves above the breakout area with confirmation and place the stop below the base structure that should hold.
First Consolidation Above the 40-Week Moving Average
A longer-term investor-style entry can appear when price leaves Stage 1, holds above the 40-week moving average, and forms its first constructive consolidation. The breakout from that consolidation becomes the trigger, with invalidation below the structure that should remain intact if the new Stage 2 is real.
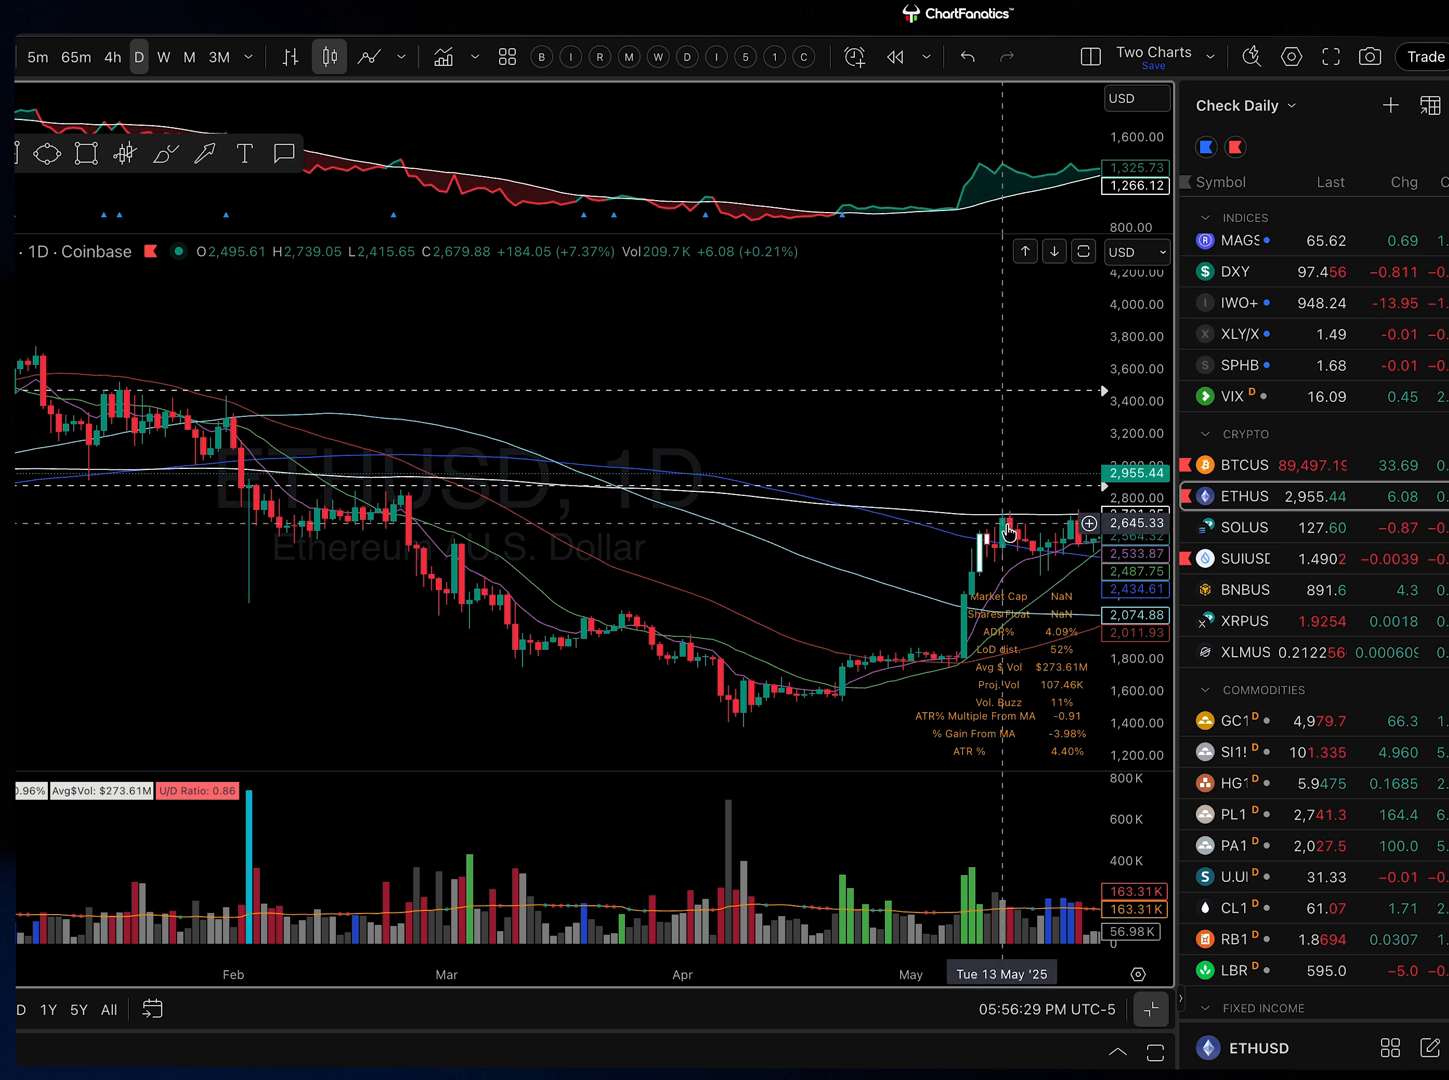
Stage 4 Mean Reversion
Stage 4 also contains a separate tactical setup. When price becomes extremely stretched below the 30-week and 40-week averages, it may form a tight shelf around the 10-week average. On the daily chart, that shelf can create a defined mean-reversion entry toward the slower averages. Treat this as a tactical trade with a clear invalidation point, not as proof that a full Stage 2 trend has begun.
Risk Rules
Stop Placement
Define invalidation before entry. For a base breakout, the stop belongs below the base or below the level that proves the breakout failed. If price loses its Stage 2 structure and falls back below the key averages, reduce risk or exit rather than rationalize the change.
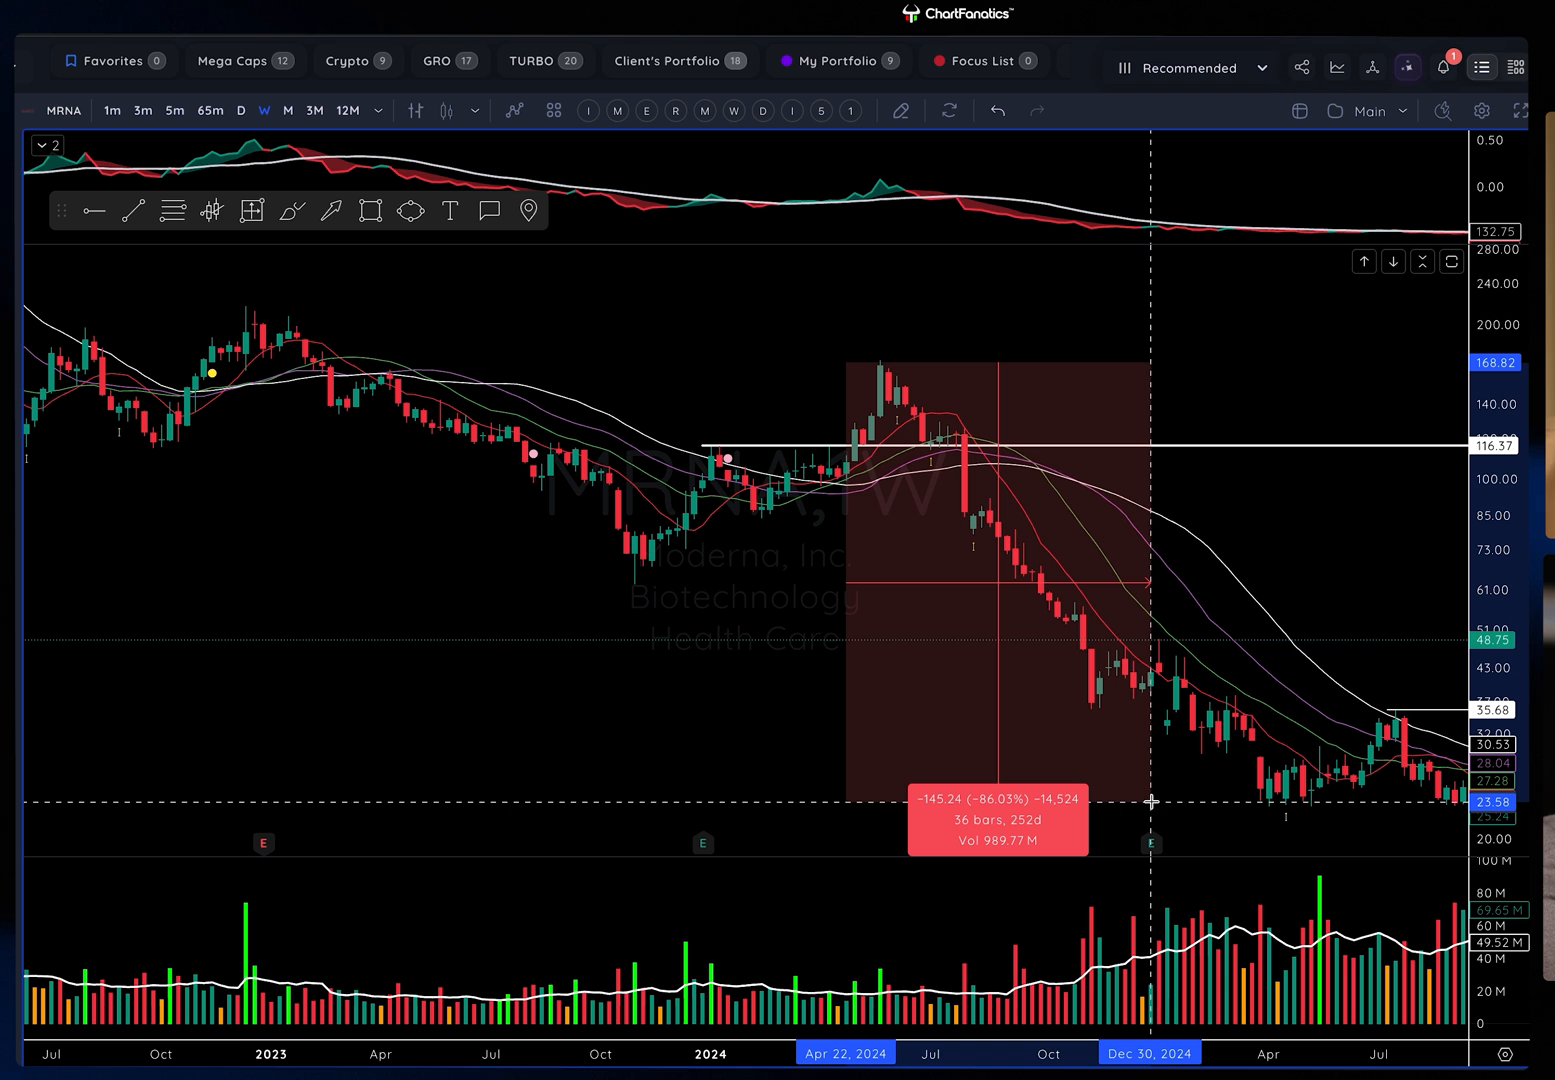
Moderna Failed Breakout
Moderna shows why a technically valid setup still requires a stop. After a long decline, the stock appeared to leave Stage 1 through a clean flat base above the 10-week, 20-week, 30-week, and 40-week moving averages. The breakout was reasonable in real time, but it failed and returned to Stage 4.
Zhang emphasizes that the correct response is to exit and wait for a new opportunity. From the failed-breakout area, Moderna later fell substantially further. A disciplined loss prevented a valid setup from becoming a destructive long-term hold.
Positioning Rules
Match position size to the stop distance and account for the wider risk of weekly-chart setups. Do not hold through a deep drawdown simply because the long-term story remains attractive. When market breadth shows more assets shifting into Stage 3 and Stage 4, reduce overall portfolio exposure.
Targets and Management
Typical Target Logic
Prior highs and previous all-time highs are natural reference points, but Stage 2 is not a fixed-target strategy. Allow a clean trend to develop while price respects the rising 10-week and 20-week averages. For Stage 4 mean-reversion trades, target the slower moving averages rather than assume a full cycle reversal.
The goal is to capture the middle of the move. The early portion often belongs to uncertainty and false starts. The final portion often belongs to verticality, crowded optimism, and expensive mistakes.
Trade Management
Do not assume every Stage 2 position must be held through the full cycle. Modern markets can mean-revert sharply even during healthy longer-term trends. Rotate capital toward cleaner Stage 2 bases when other positions become extended or enter long consolidation periods.
Reduce or exit when price becomes wide and loose, repeatedly slices through the moving averages, or fails to respond to good news. When price becomes unusually vertical and extended, sell into strength rather than chase.
No-Trade Rules
Avoid the trade when:
- Price remains inside a clean Stage 4 decline.
- Stage 1 might be forming but the asset has not broken out.
- A loose Stage 3 topping range is already visible.
- The breakout is extended and the entry would be a chase.
- Bullish news is present but Stage 2 price structure is missing.
- The base is too messy to define invalidation clearly.
Trade Breakdowns
Rare-Earth ETF First Multi-Month Base
A rare-earth ETF completed a Stage 1 base and broke out with strong volume into Stage 2. That first move was large and linear, so the next opportunity was not to chase the extension. The better setup appeared when price paused and formed its first multi-month base while surfing the 10-week and 20-week moving averages.
The base showed constructive behavior. Price shook out weak holders, reclaimed the lows, started building higher lows, and tightened on the right side. The breakout area sat near 75. Entering as price cleared that area kept the weekly Stage 2 trend behind the trade while preserving a logical invalidation below the base structure or reclaimed-low area.
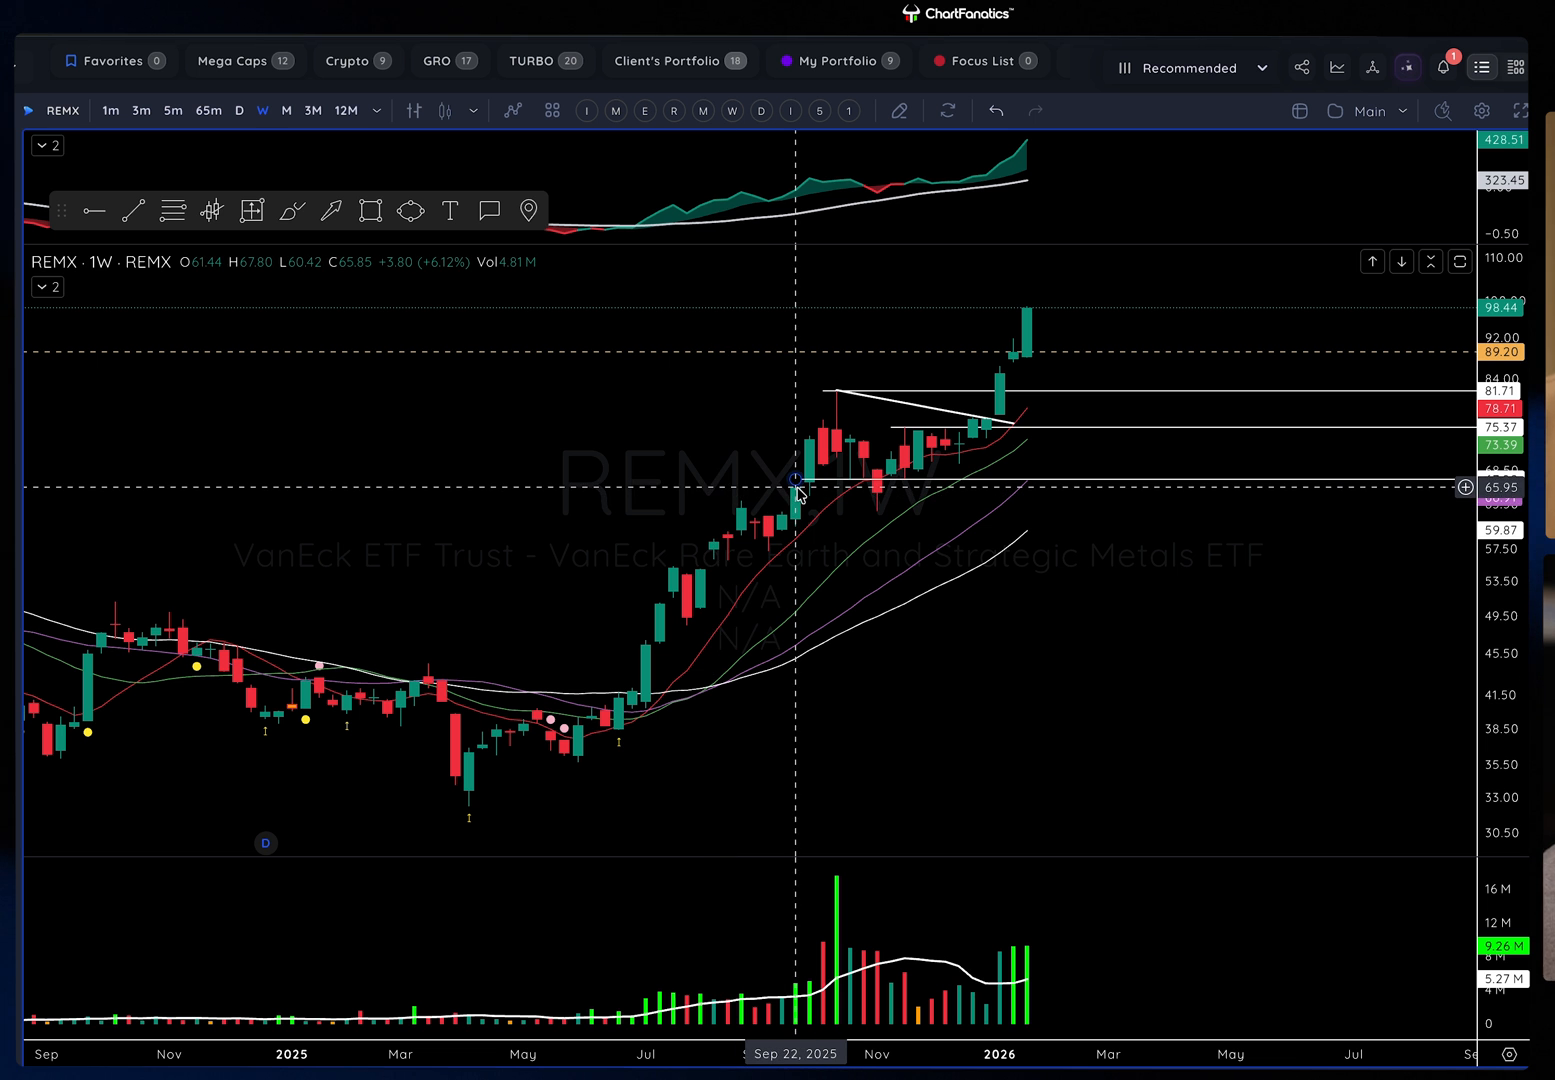
The continuation produced roughly 25-30% follow-through after the breakout. The lesson is not that every base will work. The lesson is that the first multi-month base after a strong Stage 2 leg can create a cleaner opportunity than chasing the original move.
How to Backtest This Stage Analysis Strategy
The fastest way to test this Stage Analysis Strategy is with TradeZella's automated no-code backtesting. Define your rules in plain English, hit run, and TradeZella runs them across 11+ years of historical data in seconds, then shows you every individual trade along with your win rate, profit factor, and expectancy instantly, without you stepping through a single chart. It is the quickest way to see whether the setup holds up before you risk a dollar.
You can also test it manually by replaying the market bar by bar. Plot the 10-week, 20-week, 30-week, and 40-week moving averages on the weekly chart the way you trade live, and replay price bar by bar. Classify the weekly stage first, then drop to the daily chart for the entry: a Stage 2 transition as price reclaims the key averages, a first multi-month base continuation, a first consolidation above the 40-week average, or a tactical Stage 4 mean-reversion shelf. Take long setups only in Stage 2, avoid clean Stage 4 declines, and define invalidation below the base or the level that proves the breakout failed before entering. Use automatic position sizing and drag your stop and target directly on the chart. Every trade gets logged automatically with your entry, exit, position size, and P&L. Tag each trade by stage and entry model so you can see which conditions produce your edge, add notes, tag mistakes, and review the session the same way you would a live trade. After 30 to 50 trades, you can see your win rate, profit factor, and expectancy on this specific setup. Manual replay is the best way to build screen time and a real feel for the setup.
When you start trading live, import your live trades into TradeZella, the AI trading journal that does the journaling for you. Your backtest results and live results live in the same platform, so you always know how the strategy performs in testing vs how it performs with real money, without switching between tools or maintaining separate spreadsheets.
Start Backtesting This Strategy Using TradeZella
Frequently Asked Questions
What is the Stage Analysis Strategy?
The Stage Analysis Strategy uses Stan Weinstein-style stage analysis to classify an asset as basing, trending, topping, or declining before any capital is committed. It is a higher-timeframe decision framework that combines price structure with the 10-week, 20-week, 30-week, and 40-week moving averages. The edge is not a single crossover; it comes from knowing which part of the cycle is active, aligning with the dominant trend, and stepping aside when the market becomes destructive or indecisive, so you capture the cleaner middle of the move.
What are the four market stages?
Markets move through a repeating four-stage cycle. Stage 1 is the basing period after a decline. Stage 2 is the uptrend where long exposure is favored. Stage 3 is the topping period where risk should be reduced. Stage 4 is the downtrend where longs should usually be avoided and short setups may be favored. Stage 2 is the main environment for long ideas, while Stage 1 and Stage 3 are void stages that deserve patience, and Stage 4 is the capital-preservation stage for long-biased traders.
Which moving averages does this strategy use?
It plots the 10-week, 20-week, 30-week, and 40-week simple moving averages alongside price structure and volume. Price structure shows whether the market is building higher highs and higher lows or lower highs and lower lows, while the averages smooth the trend and reveal whether momentum is strengthening or flattening. In a clean Stage 2, price is above all four averages with the 10-week above the 20-week and 30-week; in Stage 4 the alignment inverts, with the 10-week below the 30-week and the 30-week below the 40-week.
What are the entry models?
There are four. The Stage 2 Transition enters on a daily breakout as price leaves a Stage 1 base and reclaims the key weekly averages. The First Multi-Month Base Continuation enters after the first strong Stage 2 leg, once price digests its gains, surfs the 10-week or 20-week average, shakes out weak holders, and tightens before breaking out. The First Consolidation Above the 40-Week is a longer-term investor entry on the breakout from the first constructive base above that average. The Stage 4 Mean Reversion is a tactical trade off a tight shelf around the 10-week average when price is stretched below the slower averages.
What instruments and timeframes does this strategy use?
The framework is built for liquid stocks, ETFs, crypto, commodities, fixed income, and currencies, and is most useful for swing and position trading. You use the weekly chart to classify the primary stage and the daily chart to refine the entry. The concept is fractal, so faster traders can adapt the same logic to lower timeframes after studying how the stages behave at their chosen horizon. Broader market breadth matters too: if more assets are shifting into Stage 3 and Stage 4, confidence in new long exposure should fall.
Can I backtest the Stage Analysis Strategy?
Yes. You can test this strategy using TradeZella's backtesting with 11+ years of historical data. Plot the four weekly averages, classify the stage, then drop to the daily chart and take a Stage 2 transition, first multi-month base, first consolidation above the 40-week, or Stage 4 mean-reversion entry with invalidation below the base. Every trade logs automatically with entry, exit, position size, and P&L, and you can tag each trade by stage and model. After 30 to 50 trades you can see your win rate, profit factor, and expectancy on this specific setup before risking real money.
What is TradeZella backtesting?
TradeZella backtesting lets you test a trading strategy against 11+ years of historical market data across forex, futures, stocks, and crypto, down to seconds-level timeframes. You can do it two ways. Replay the market bar by bar and place trades as if you were trading live, with your own timeframes, automatic position sizing, and stops and targets you drag right on the chart, and every trade logs automatically with entry, exit, size, and P&L. Or use automated no-code backtesting: define your strategy rules in plain English and the engine runs them across years of data in seconds, returning every individual trade it took with the exact setup drawn on the chart, so you see why each trade fired instead of just an equity curve. Zella AI then analyzes the results and flags what to fix.