How to Track Trading Habits With Data, Not Willpower (2026)
How to Track Trading Habits With Data, Not Willpower (2026)
Most traders try to fix bad habits with willpower. This guide shows you a better way: tag five specific behaviors on every trade, filter by each tag weekly, and let the data tell you exactly which habits are costing you money and which ones are building your edge.
class SampleComponent extends React.Component {
  // using the experimental public class field syntax below. We can also attach
  // the contextType to the current class
  static contextType = ColorContext;
  render() {
    return <Button color={this.color} />
  }
}
Last Updated: March 31, 2026
Why Do Most Traders Fail at Tracking Their Habits?
You know that feeling. You finish a bad trading day and think, "I need to be more disciplined." Or "I need to control my emotions." Or "I need better risk management."
These thoughts dissolve by the next morning. By next week, they're gone entirely. You're back to the same patterns that lost you money last month.
Here's why: you're trying to track habits that are too vague to act on.
"Be more disciplined" isn't a habit you can track. "Control emotions" isn't measurable. "Better risk management" is a direction, not a destination. Without specificity, your brain has nothing to attach to. Without data, you have nothing to reinforce.
Most traders fail at habit formation because they confuse the feeling of intention with the fact of behavior change. Knowing what you should do and knowing whether you're actually doing it are two completely different things. The traders who break through are the ones who stop trying to change how they feel and start tracking what they do.
This distinction separates traders stuck in the 40-50% win rate range from those consistently above 60%. It's not about having better entries or smarter analysis. It's about having systematic evidence of what works and what doesn't, broken down to the behavioral level.
What Are the 5 Trading Habits That Actually Predict Profitability?
Not all habits are worth tracking. Most traders waste time measuring things that don't predict performance. Here are the five categories of habits that actually correlate with profitability.
1. Setup Adherence
Did you take the trade because it met your setup criteria, or because you wanted to "be in the action"? This is foundational. Traders who take only high-probability setups have win rates 15-25% higher than those who take marginal entries.
Track every trade and mark it as either "high-conviction setup" or "marginal entry." In TradeZella, you can tag this using custom strategies. Create a strategy for your A+ setup with exact criteria, and tag every trade against it. After 50 trades, you'll see your average win rate by category. Most traders discover their marginal entries hit 35-40% win rates while high-conviction setups reach 55-65%. That data alone transforms your decision-making.
The beauty is that setup adherence is binary: either your entry criteria were met or they weren't. No interpretation needed. No judgment. Just facts.
2. Emotional State at Entry
What was your state of mind when you entered? FOMO-driven (afraid you'd miss the move). Revenge-driven (making back losses). Confident (checklist confirmed). Frustrated (forcing trades when bored). This reveals your biggest leak.
We've seen traders discover that 78% of their losses come from FOMO entries, while patience-based entries have 67% win rates. Once you see that number, you stop FOMO trading. Not through willpower. Through evidence. Your brain makes a cost-benefit calculation. If FOMO entries lose money 72% of the time, why would you take them?
3. Time-of-Day Patterns
Trading at 9:30 AM EST feels different from 2 PM. Your attention span, market volatility, caffeine level, and emotional state all shift. Most traders don't track this systematically.
Track the time of entry and correlate it to win rate. Most equity traders discover they trade best during the first 30 minutes and worst between 12-2 PM. Scalpers often find an even tighter window. Swing traders might find their analysis is sharpest in the pre-market session.
You don't need to track any of this manually. TradeZella's time-of-day analytics automatically break down your performance by hour, so the pattern is already there waiting for you to look at it.
4. Position Sizing Discipline
How much did you risk on this trade relative to your daily limit? Did you size down after losses? Size up after wins? The habit isn't just "use proper position sizing." It's "maintain consistent sizing regardless of emotional state."
Tag every trade with your risk amount. Most traders discover they take larger positions on winning days (overconfidence) and smaller positions on losing days (fear). This is backwards. When you're winning, you're closer to your daily limit, so you should size down. When you're losing, you have more room, so you can maintain consistency. Reversing that one habit changes bottom-line returns by 12-18%.
5. Rule Violations
How many rules did you break on that trade? Did you enter before confirmation? Hold past your exit? Add to a losing position? Did you trade outside your designated hours? Track the number of violations per trade and correlate to outcome.
You'll find that trades with zero rule violations have significantly higher win rates than trades with one or more violations. This matters even more if you are trading a prop firm challenge, where a single rule violation on drawdown or position size can end the entire challenge.
The traders who stop breaking rules aren't the ones with more willpower. They're the ones who have data showing exactly how much each violation costs them.
These five categories concentrate the evidence. Everything else is noise.
Why Does Tracking "Be More Disciplined" Never Work?
The problem with vague habit goals is neurological. Your brain doesn't store abstract concepts as memories. It stores specific, contextual experiences. When you say "I'll be more disciplined," your brain has no picture to attach to. When you say "I'll only take trades meeting my three-point setup checklist," your brain can create a specific scenario it can recognize and repeat.
This is why most habit trackers fail. They track feelings instead of behaviors. "Was I disciplined today?" requires judgment. You're tired, you want to feel good about your day, you mark "yes." But "How many times did I enter without all three confirmation criteria?" is a fact. Zero is zero. Three is three. No interpretation.
Second, vague metrics don't reinforce behavior. Behavioral change requires immediate feedback. If you track something abstract, the feedback loop breaks. But if you track "FOMO entries" and discover they have 28% win rates while disciplined entries hit 67%, the feedback is immediate and causal. Your brain connects the behavior directly to the consequence. That connection changes behavior automatically.
Third, vague metrics don't create accountability. When your metric is "be more disciplined," nobody can evaluate whether you succeeded, not even you. But when your metric is "take zero FOMO trades this week," success or failure is binary. That clarity separates traders who make progress from traders who stay stuck.
How Does the Tag-and-Review System Work?
Here's the operational system. You need three things: a way to tag trades immediately after entry, a way to organize those tags, and a weekly review ritual.
Step 1: Establish Your Tag Categories
Decide what you're tracking. Start with the five categories above, but customize to your trading. If you're a day trader, time-of-day patterns matter more. If you're a swing trader, you might track overnight risk. If you're trading options, you might track implied volatility environment.
In TradeZella, you can create custom tags for any category you want to track. Create a strategy for each setup type, and use the notes field for emotional state and rule violations. Keep them specific and binary. Not "good setup" (too vague) but "setup met all three criteria: entry zone, volume confirmation, trend alignment."
Step 2: Tag Immediately After Entry
Don't wait until end of day. Tag the trade within five minutes of entry. Your memory of your state of mind is sharpest right then. If you wait until end-of-day review, you rationalize. "Well, it looked good when I thought about it again..." No. Tag it while the truth is fresh.
Most traders find that tagging immediately is when real insight happens. You start noticing your own patterns in real-time. You catch yourself about to take a FOMO trade and stop. The system doesn't just measure behavior. It changes behavior as it's happening.
Tradezella Trade View Tag Trades
Step 3: Record the Outcome When You Exit
Add the P/L or win/loss to each tagged trade. Now you have the data pair: behavior tag plus result. This creates your feedback loop. In TradeZella, your P/L is captured automatically when trades sync from your broker, so all you need to add is the behavioral tag.
Step 4: Weekly Tag Review
Every Sunday or Monday, spend 20 minutes reviewing tagged trades. Calculate:
You're looking for patterns. What category has the worst win rate? What habit is your biggest leak? Also check your profit factor and expectancy by tag. A setup with a 45% win rate but 3:1 R-multiple winners still has positive expectancy. Win rate alone does not tell the full story.
Step 5: One-Habit Focus
Don't try to fix five habits at once. Pick the one with the worst data. If FOMO entries are killing you at 28% win rate, your only goal for next week is zero FOMO trades. That's specific, measurable, and achievable.
This focus creates psychological momentum. One successful week feels like transformation. One month feels like the habit is fixed.
Traders using this system see behavioral shifts within 2-3 weeks. Not because they have more willpower, but because they have evidence driving behavioral change automatically.
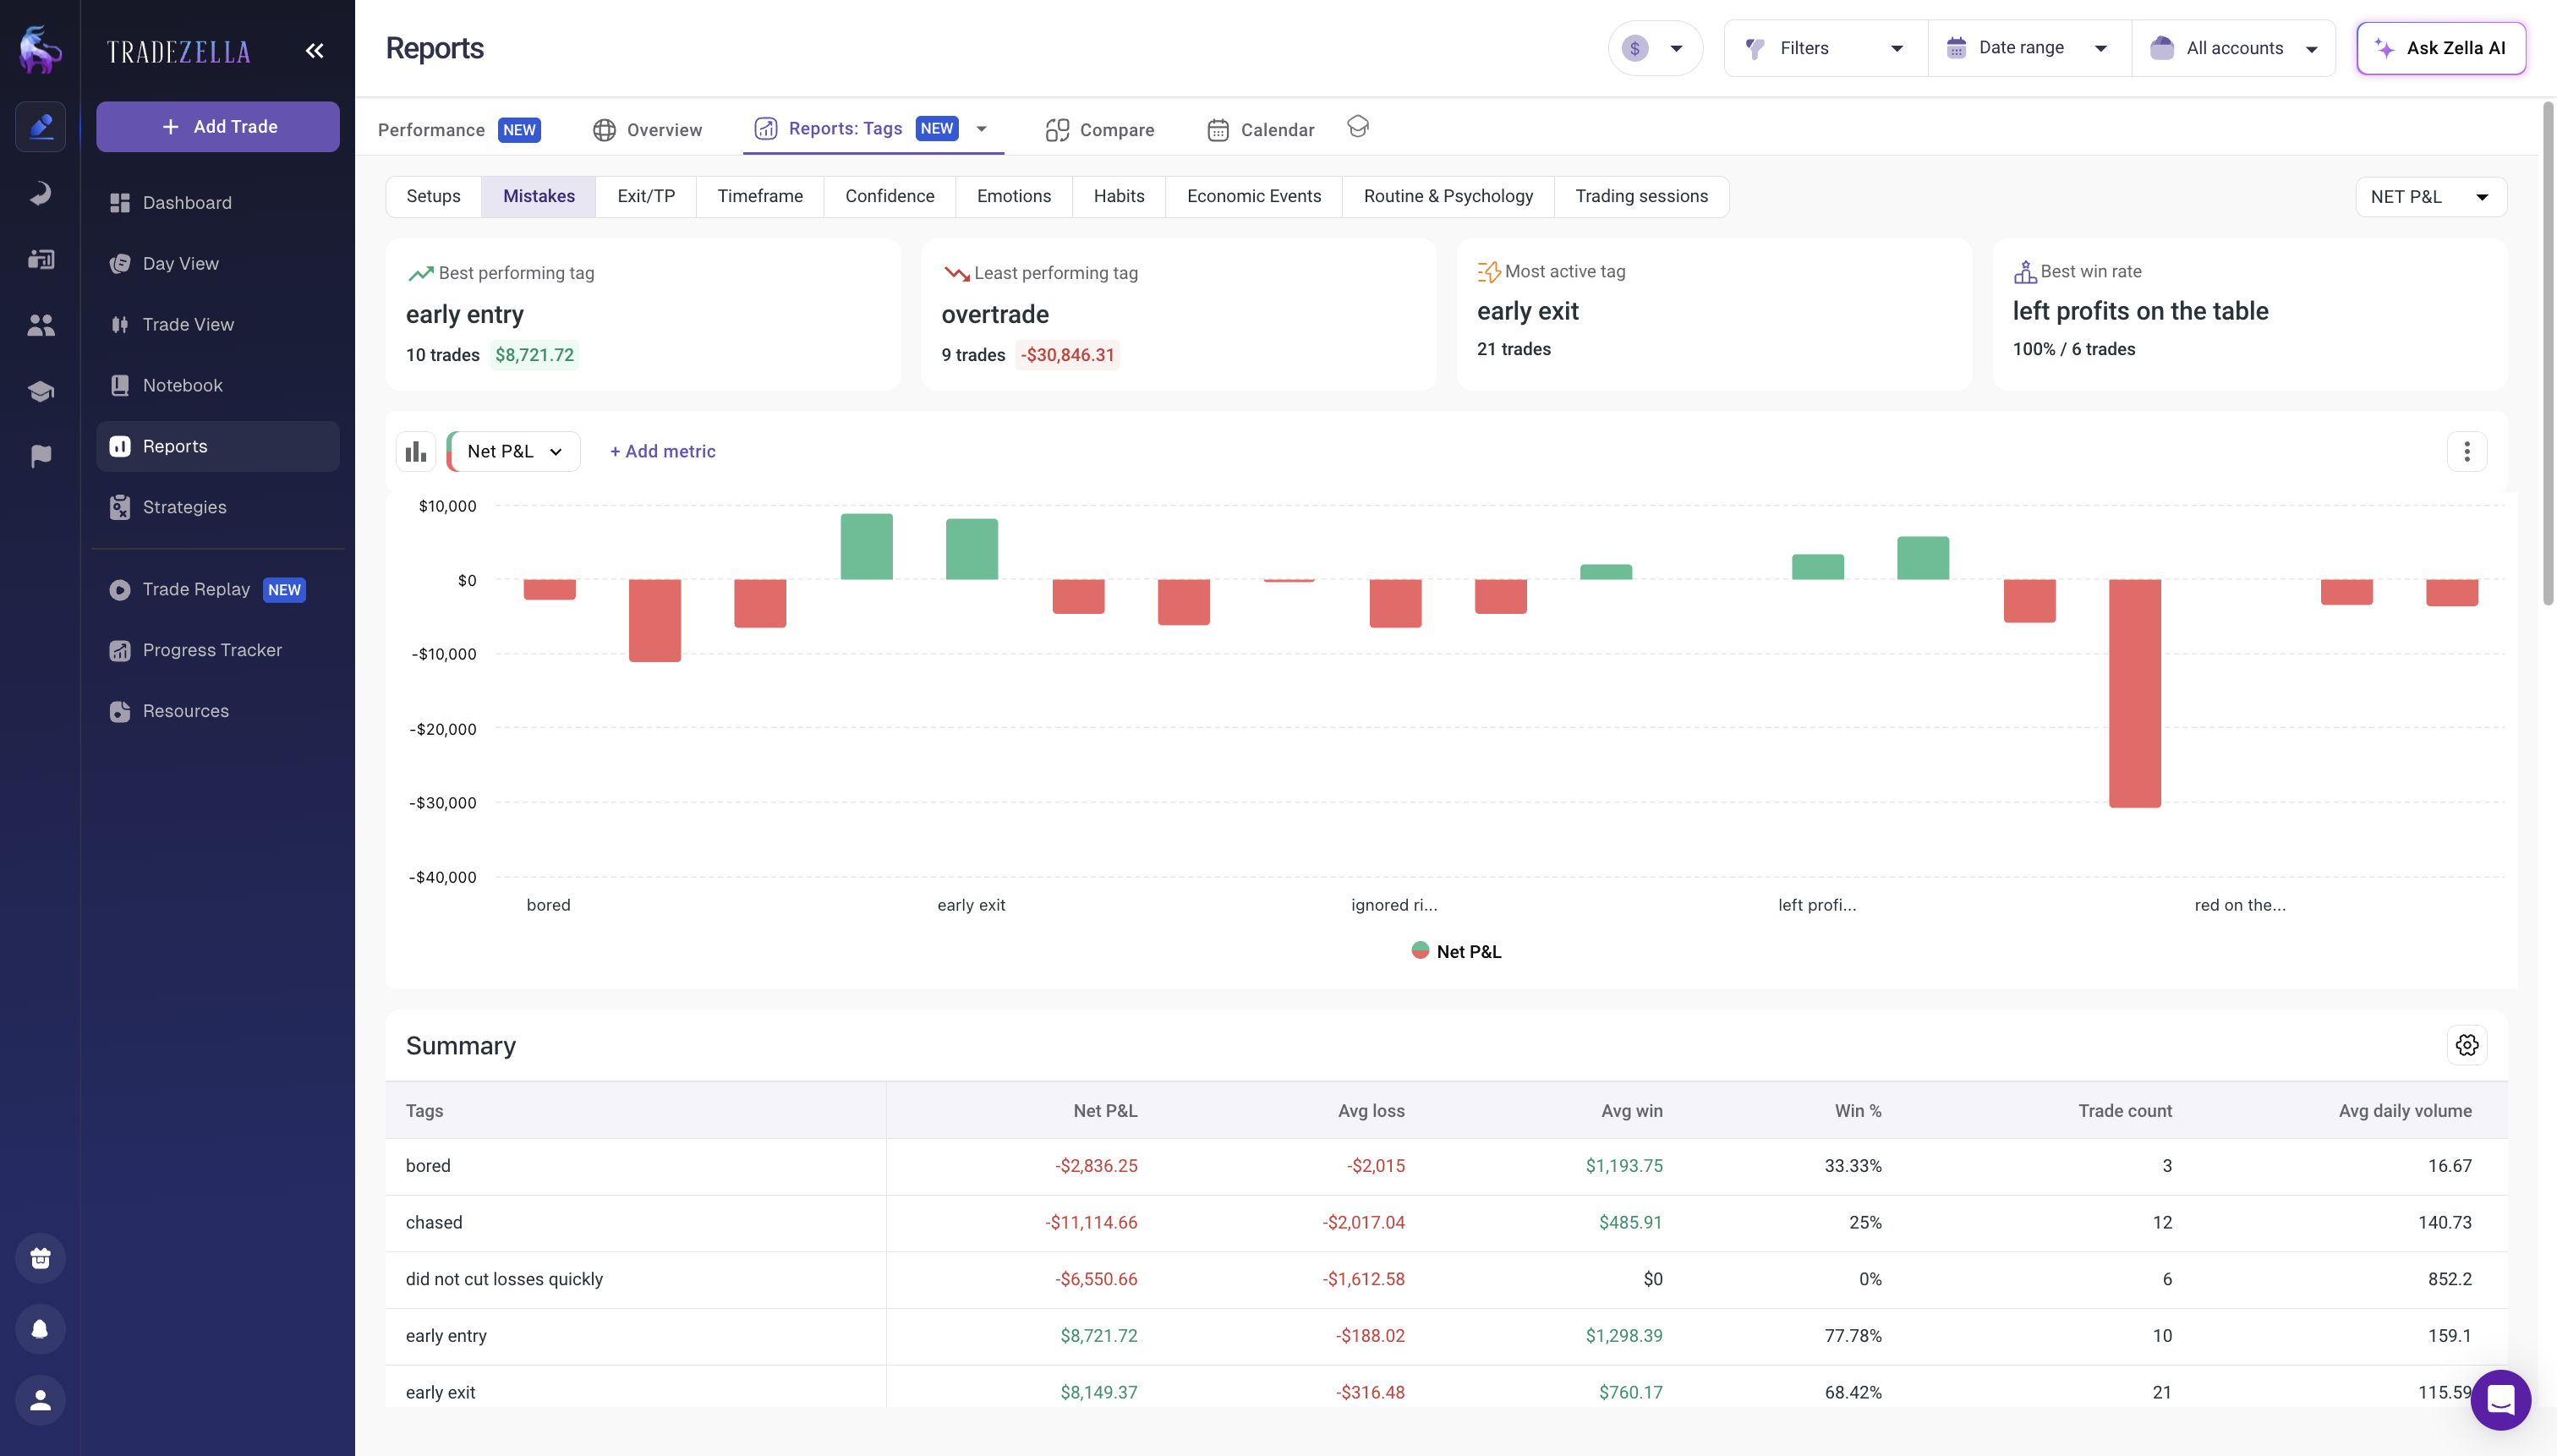
What Does the Data Actually Reveal?
Here's what traders consistently discover when they track habits with precision.
The FOMO vs. Setup Breakdown
One trader tracked 142 trades over 8 weeks. She tagged each as either "FOMO-driven" or "setup-driven." FOMO entries: 28% win rate, average P/L of -$187. Setup-driven entries: 67% win rate, average P/L of +$312. The gap is massive. But here's the shock: she'd been telling herself she was "mostly disciplined." The data showed she was taking FOMO trades 40% of the time. Within three weeks of seeing this number, FOMO trades dropped to 12% of her activity. Not through trying harder. Through knowing exactly how much they cost.
The Time-of-Day Pattern
Another trader noticed he felt sharp at 9:30 AM and foggy at 2 PM. He had a feeling, not data. Once he tagged trades by entry time, the evidence was clear. 9:30-10:30 AM: 59% win rate. 10:30-11:30 AM: 54%. 12:00-2:00 PM: 38%. 2:00-3:00 PM: 52%. 3:00-3:45 PM: 61%.
His worst period was the lunch window. His best period was the final 45 minutes. He restructured his day to avoid trading during the slump window. Win rate went from 48% to 56% in one month, just from trading at better times.
The Sizing Leak
A third trader found that he sized down after losses (playing it safe) and sized up after wins (overconfident). He calculated: days when he maintained consistent sizing showed a 9% win rate improvement over 40 days compared to days when he sized emotionally. Using a consistent risk management approach where he risked the same percentage on every trade, regardless of his recent results, accelerated his account growth because he was no longer under-sizing his best setups.
The Rule Violation Cost
One trader broke down trades by rules violated. Zero violations: 61% win rate. One violation: 47%. Two violations: 34%. Three or more violations: 19%. Each rule violation correlated with roughly 10-15% drop in win rate. After seeing this, he became obsessive about rule adherence. Not from discipline. From knowing each violation was worth about 12% in expected win rate.
These aren't outlier cases. Every trader has a leak. Measurement finds it.
How Do You Build Habit Streaks That Actually Stick?
Once you have data, the next phase is building streaks. A habit streak is consecutive days or weeks of behavior without violations.
Your brain responds to streaks differently than isolated successes. One good trade feels lucky. A five-day streak of following your setup criteria feels like you're changing. Two weeks of zero FOMO entries feels like you've fixed that habit.
The key is that your streak is based on specific behavior, not P/L. If your focus is "zero FOMO entries," then a FOMO entry breaks the streak, regardless of whether you made money on it. A high-P/L FOMO trade that breaks your streak is still a streak-breaker. This forces you to decouple behavior from outcome, which is exactly what you want.
Most traders find that after a 2-3 week streak, the behavior becomes automatic. You don't have to think about it. Your brain recognizes the situation and executes the right behavior without conscious deliberation. That's when habits stick.
Once one streak is solid (3-4 weeks minimum), move to the next habit. Don't try to maintain five streaks simultaneously. Serialize them. Fix FOMO, then fix time-of-day patterns, then fix position sizing. Each one compounds on the previous.
Key Takeaways
Track behaviors, not feelings. "Be more disciplined" is unmeasurable. "Take zero FOMO entries" is a fact.
Start tracking from today. Historical data is valuable, but current data is more useful because you can control it. If you connect your broker to TradeZella, your full trade history imports automatically. If you are starting fresh, within 4-6 weeks you will have enough data to identify your top three habit leaks.
How specific should my tags be?
The more specific, the better. "Good entry" tells you almost nothing. "Setup met all three criteria: price in zone, volume above 20-day average, trend aligned to my timeframe" is trackable. Specificity connects behavior to outcome. Broad categories are where tracking systems fail.
Should I track P/L on every trade, or is just win/loss enough?
Win/loss is the baseline, but P/L tells you more. A 60% win rate on $100 trades and 60% win rate on $1,000 trades are different stories. Track both win rate and average R-multiple by habit category. You might discover that your FOMO trades have a decent 48% win rate, but your average loss is so large that they destroy your bottom line.
How long does it take to see changes from habit tracking?
Most traders see awareness shift within 1-2 weeks, behavioral shift within 2-4 weeks, and automatic habit shift by week 4-6. After 8-12 weeks, the behavior is typically automatic.
What is the best tool to track trading habits and see patterns automatically?
A trading journal that tracks your habits, tags, and performance data in one place without manual work. TradeZella lets you create custom tags, apply them to every trade as you journal, and automatically breaks down your performance by tag, time of day, setup type, and more in the reports section. Instead of building spreadsheets, everything is calculated for you so you spend your time acting on the data, not collecting it.
What if my win rate is 40% across all categories?
That means you haven't isolated your tags enough. Broaden your data collection and track more categories. A 40% win rate across every habit suggests you're either in a bad market period or your tags are too broad. Once you narrow them down, the differences will emerge.


.png)