Five risk management tools that professional traders use to protect their accounts from catastrophic losses. Covers maximum drawdown, risk per trade, daily loss limits, the giveback rule, and stop orders, with dollar examples and journal tracking for each.
class SampleComponent extends React.Component {
  // using the experimental public class field syntax below. We can also attach
  // the contextType to the current class
  static contextType = ColorContext;
  render() {
    return <Button color={this.color} />
  }
}
Last Updated: May 14th, 2026
Risk management tools are the rules and systems traders use to control how much money they can lose on any single trade, in any single day, and across their entire account. Professional traders treat these tools as non-negotiable infrastructure, not optional add-ons. Without them, one bad day can erase months of profitable trading.
Most traders know they need a stop loss. But a stop loss is just one piece. Professional traders use a layered system where five tools work together: a maximum drawdown sets the absolute floor, risk per trade controls each individual position, a daily loss limit caps the damage on any single session, the giveback rule protects open profits from evaporating, and stop orders execute the plan automatically when emotions get in the way.
This guide covers all five tools with specific dollar examples on a $50,000 account, how to calculate each one, common mistakes that weaken each tool, and how to track everything in your journal so you can measure whether you are actually following your own rules.
Why Do Traders Need Risk Management Tools?
Risk management is the only part of trading you can fully control. You cannot control whether a trade wins or loses. You cannot control overnight gaps, news events, or liquidity. But you can control exactly how much you lose when you are wrong.
Without a structured risk management plan, traders leave themselves vulnerable to three scenarios that destroy accounts:
The slow bleed. No single loss is catastrophic, but dozens of undersized wins and oversized losses gradually drain the account. After three months, the trader is down 30% and does not understand why because no individual loss felt significant. The profit factor report in a journal catches this immediately: if profit factor is below 1.0, the account is bleeding.
The revenge spiral. A bad loss triggers emotional trading. The trader doubles position size to "make it back," takes another loss, doubles again. What started as a $500 loss becomes $3,000 in 90 minutes. This is the most common path to blowing an account, and it happens because the trader has no daily loss limit to force them to stop.
The giveback day. The trader is up $2,000 by 11 AM. Instead of protecting those profits, they keep trading. By 3 PM, they are down $800. A $2,000 winning day became an $800 losing day. The giveback rule prevents this entirely.
Each of the five tools below addresses a specific failure mode. Together, they create a system where no single mistake can cause permanent damage to your account.
Tool 1: The Maximum Drawdown
Your maximum drawdown is the absolute most you are willing to lose from your account's peak equity before you stop trading and reassess everything. It is the nuclear option, the line that says "my current approach is not working and I need to step back before I cause more damage."
Every trader already has a maximum drawdown whether they define it or not: it is their account balance. When the money runs out, trading stops. The point of setting a formal maximum drawdown is to stop far before that point, while you still have enough capital to recover.
How to Calculate Your Maximum Drawdown
There are two approaches, and the right one depends on your situation:
Percentage-based (most common): Set maximum drawdown at 15-25% of your account. On a $50,000 account, a 20% maximum drawdown means you stop trading if the account drops to $40,000. This leaves $40,000 of capital to restart with, which is enough to recover if the underlying strategy is sound.
Dollar-based (for newer traders): Set maximum drawdown at the amount you can genuinely afford to lose without it impacting your life. If losing $5,000 would cause financial stress, your maximum drawdown is $5,000, regardless of what percentage that represents.
When your account hits the maximum drawdown line, stop all live trading. Do not reduce size and keep going. Do not take "just one more trade." Close all positions, step away, and spend at least one to two weeks reviewing your journal data to identify what went wrong. The answer is in the data: filter by Strategy, time of day, and trade quality tags to find where the losses are concentrated.
For a detailed protocol on what to do at each drawdown level, read the complete drawdown management guide which breaks the response into three tiers: stay the course (0-3%), cut size (3-5%), and stop trading (5%+).
Prop Firm Maximum Drawdown
On prop firm accounts, the firm sets your maximum drawdown, typically 8-12% of the starting balance. This is a hard limit: breach it once and the account is terminated permanently. There is no "step back and reassess." The account is gone and you pay another evaluation fee to start over.
Because of this, prop firm traders need to set a personal maximum drawdown that is tighter than the firm's limit. If the firm allows 10% ($10,000 on a $100,000 account), set your personal maximum drawdown at 7% ($7,000). This gives you a $3,000 buffer before the firm terminates the account, which can be the difference between a temporary setback and losing the account entirely. Read more about how prop firms work to understand how these limits differ between firms.
How to Track Maximum Drawdown in Your Journal
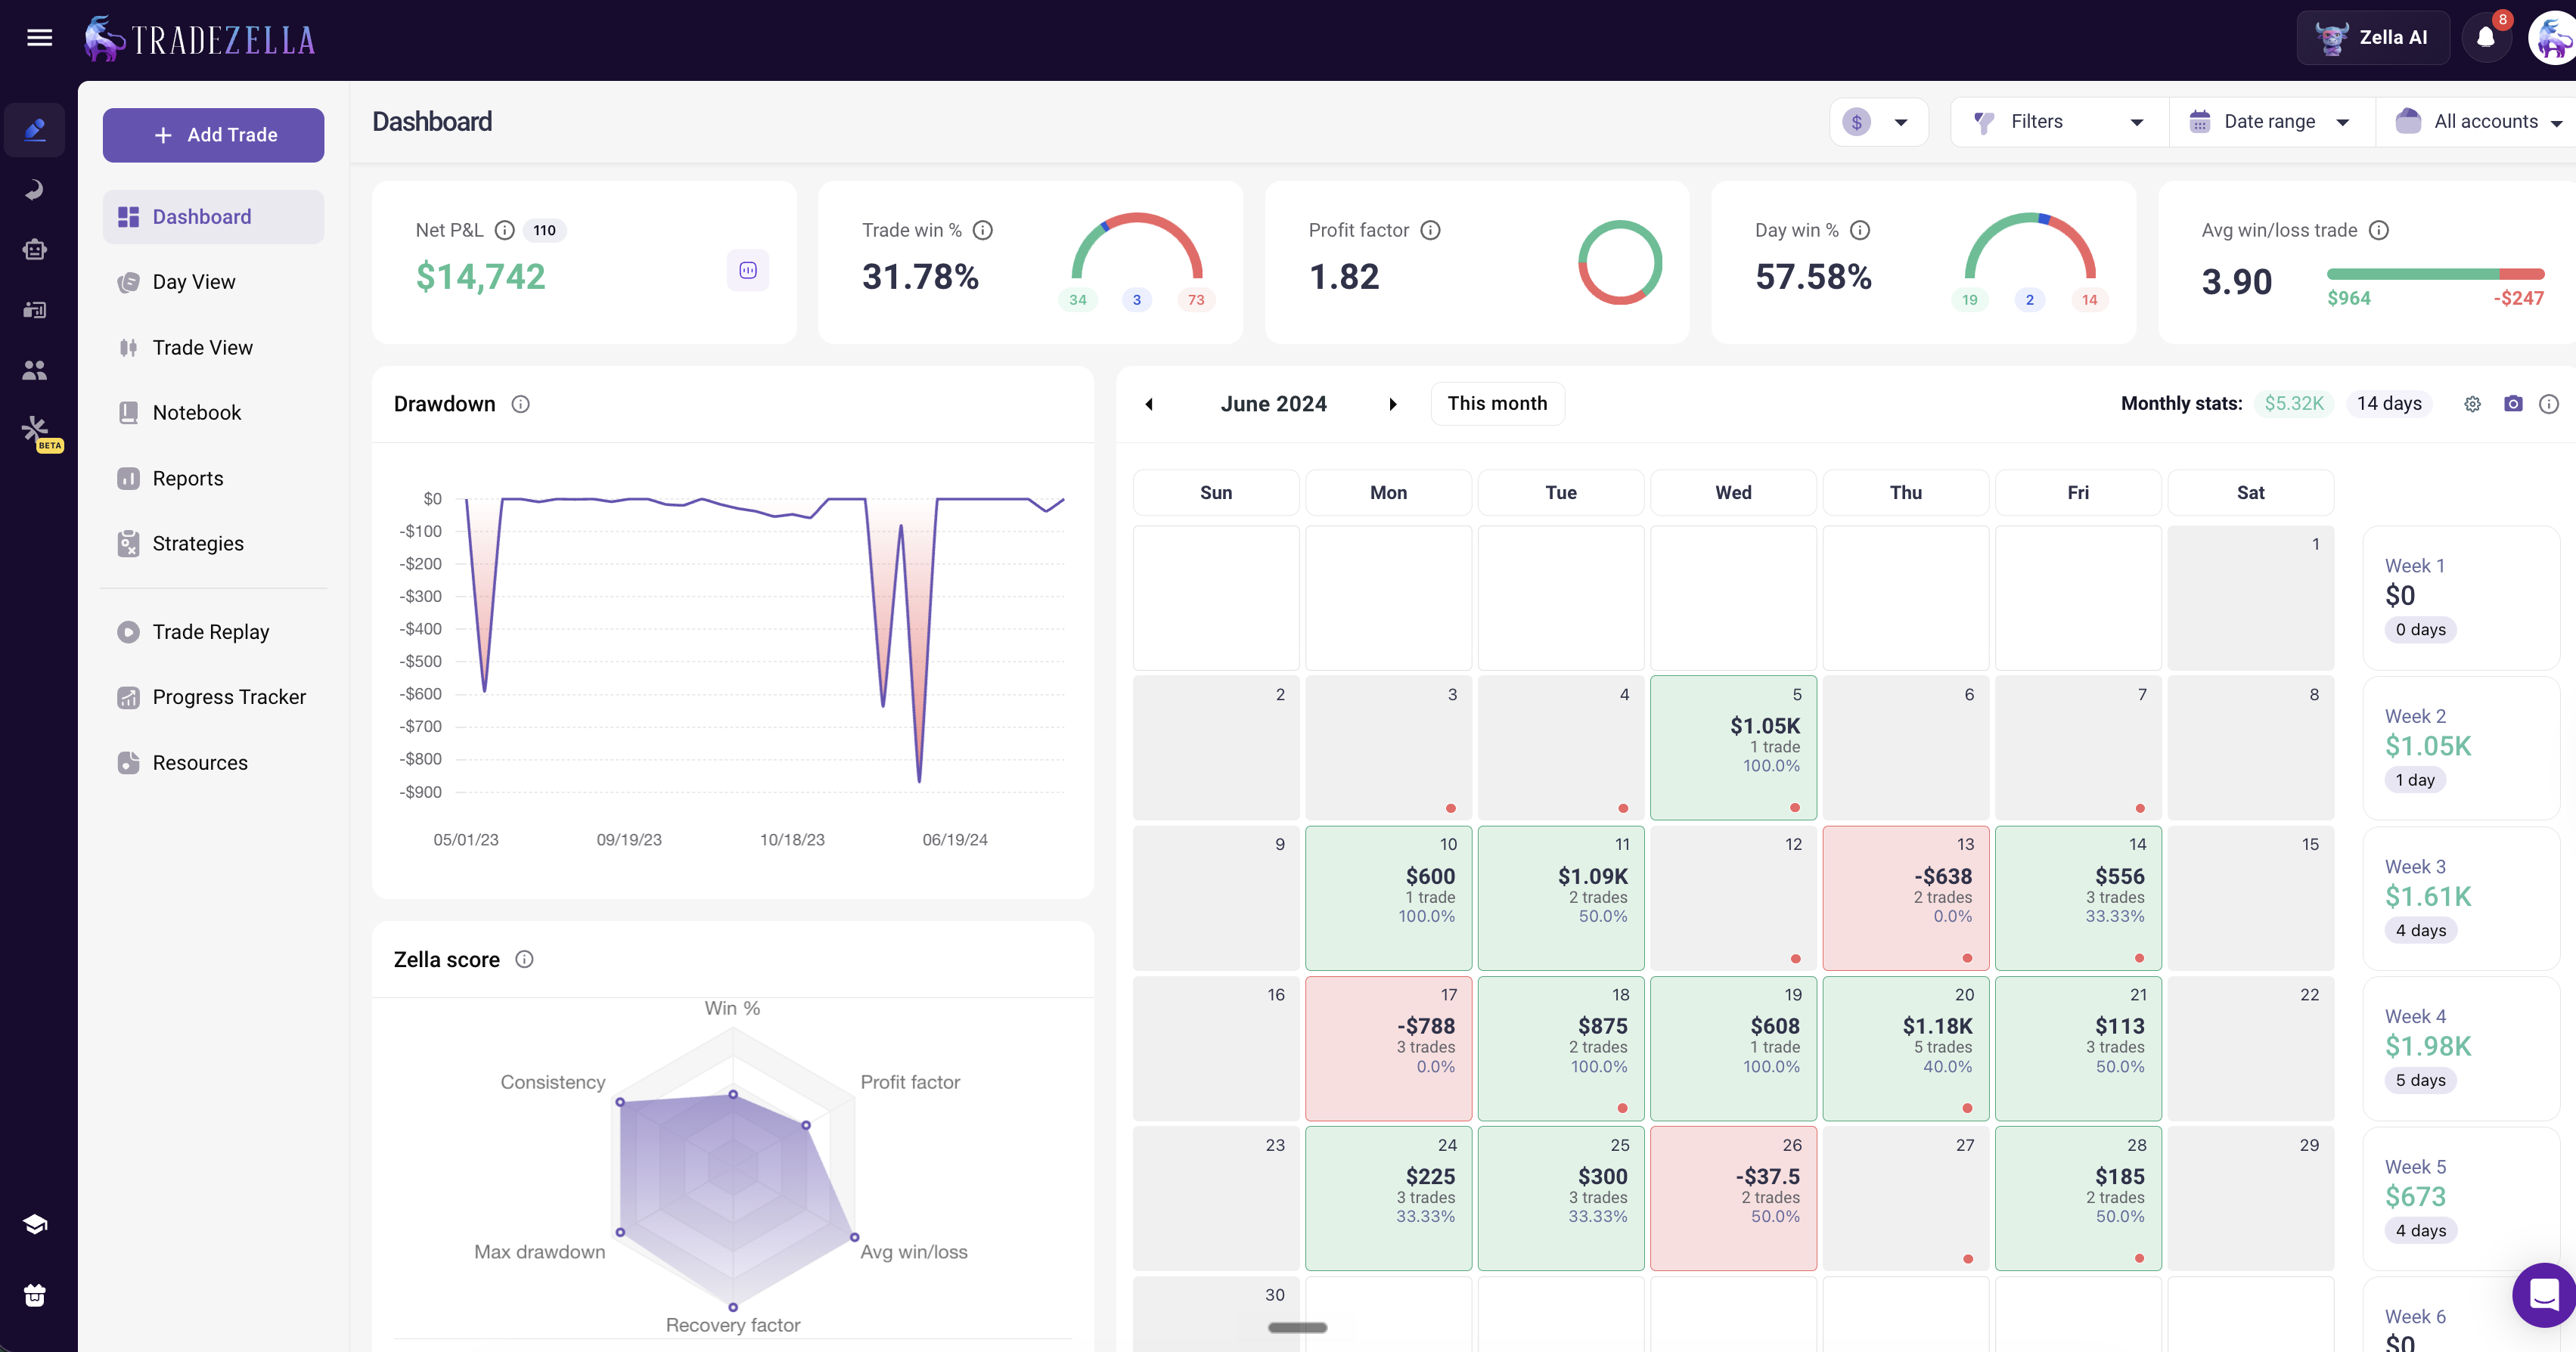
In TradeZella, your drawdown is tracked automatically on the analytics dashboard. The Calendar view shows your daily P&L at a glance, so you can see exactly when drawdowns started and how long they lasted. Filter by Strategy to determine if the drawdown is caused by one specific setup failing or if it is spread across all trading.
Check your peak-to-trough drawdown weekly. If you are approaching 50% of your maximum drawdown limit, it is time to cut position size in half, not wait until you hit the full limit.
TradeZella analytics dashboard showing drawdown tracking and daily P&L calendar
Tool 2: The Risk Per Trade
Risk per trade is the maximum dollar amount you are willing to lose on any single position if the stop loss is hit. It is calculated as a fixed percentage of your current account equity, and it is the single most important number in your risk management plan because every other tool depends on it.
The standard is 1% of account equity. On a $50,000 account, that is $500 per trade. On a $25,000 account, that is $250. The percentage stays the same regardless of account size.
Step-by-Step: Calculating Risk Per Trade
Step 1: Current account equity. Use today's balance, not the starting balance. If you deposited $50,000 and are currently at $47,200 after a losing streak, your equity is $47,200.
Step 2: Multiply by 0.01 (1%). $47,200 × 0.01 = $472. That is your maximum risk on the next trade.
Step 3: Find your stop loss distance. If you are buying AAPL at $192.50 with a stop at $190.00, the distance is $2.50 per share.
Step 4: Calculate position size. $472 ÷ $2.50 = 188 shares. Round down to 185 for a clean number. Never round up.
Use the position size calculator to run this math automatically for any instrument, including stocks, futures, and forex.
Why 1% and Not 2% or 3%?
The answer is drawdown math. At 1% risk, 10 consecutive losses cost you 9.6% of your account. At 2%, 10 losses cost 18.3%. At 3%, 10 losses cost 26.3%, which requires a 35.7% gain just to get back to even.
A trader with a 50% win rate has roughly a 1-in-1,024 chance of losing 10 in a row. That sounds rare, but over 2,000 trades across two years of active trading, it is almost guaranteed to happen at least once. The 1% rule ensures that when it does happen, it is survivable.
Adjusting by Trading Style
Scalping strategies with 10-30 trades per day should use 0.25% to 0.5% per trade. Twenty scalps at 0.5% means 10% total daily exposure. Day traders taking 3-8 trades can use the standard 0.5% to 1%. Swing traders taking 1-2 new positions per week can go as high as 1-2% because the lower frequency limits cumulative exposure.
The key variable is total daily risk exposure, not just risk per trade. A scalper risking 0.5% on 20 trades has more total risk than a swing trader risking 2% on one trade.
How to Track Risk Per Trade in Your Journal
In TradeZella, every trade auto-imports from your broker with exact entry and exit prices. Use the R-multiple view on the analytics dashboard to see every trade normalized to risk. If your planned risk was $500 and your actual loss was $730, that trade was -1.46R, meaning you lost 46% more than planned. Tag these trades "Risk Exceeded" and filter the Tags report monthly to see how often it happens.
If more than 10% of your losing trades exceed -1R, you have a risk execution problem. Either stops are being moved, slippage is worse than expected, or position sizes are being calculated incorrectly.
Tool 3: The Daily Loss Limit
A daily loss limit is the maximum amount you allow yourself to lose in a single trading session. When you hit it, you stop trading for the day. No exceptions, no "one more trade," no reduced size. The screens go off.
The daily loss limit exists for one reason: to prevent a bad day from becoming a catastrophic day. Without it, a trader who loses $1,000 in the morning will try to make it back in the afternoon, which triggers revenge trading, which leads to overtrading, which turns a $1,000 loss into a $3,000 loss. The daily loss limit breaks this cascade before it starts.
How to Calculate Your Daily Loss Limit
The best method is to set your daily loss limit at your average good winning day, not your average day and not your best day, but the midpoint between your average winning day and your best winning day.
Here is why: if your daily loss limit is higher than what you typically earn on a good day, then after a losing day you will need an unusually good day just to break even. That psychological pressure increases the probability of making mistakes the next day, which can trigger a multi-day slide.
Example calculation on a $50,000 account:
Look at the last 60 trading days in your journal. Pull up the Calendar view and identify:
Average winning day: $600
Best winning day: $2,400
Midpoint: ($600 + $2,400) / 2 = $1,500
Your daily loss limit is $1,500. If you lose $1,500 at any point during the day, you are done for the day.
If you do not have 60 days of trading data yet, use 3× your risk per trade as a starting point. At 1% risk ($500 per trade), that is a $1,500 daily loss limit, which means three full losers in a row stop your day.
Why 3× Risk Per Trade Works for Beginners
Three consecutive losses is enough to recognize that something is off, either the market is not cooperating with your setups or your execution is breaking down. But it is not so much that recovery requires an exceptional day. At $500 per trade, three losses is $1,500. That is recoverable with two to three good winning days at $500-$750 each.
Compare that to a trader with no daily loss limit who loses seven trades in a row ($3,500). Now they need an entire week of above-average performance just to get back to where they started the day. That kind of deficit creates psychological pressure that feeds into the FOMO trading and trading tilt cycle.
Prop Firm Daily Loss Limits
Most prop firms set a hard daily loss limit of 4-5% of the starting account balance. On a $100,000 account, that is $4,000-$5,000. Breach it once and you fail the evaluation or lose the funded account.
Set your personal daily loss limit inside the firm's limit. If the firm allows $5,000, set yours at $3,000. This leaves a $2,000 buffer for slippage, commissions, and any intraday drawdown that happens before you can close the position. For the complete evaluation strategy, including how daily loss limits interact with maximum drawdown, read how to pass a prop firm challenge.
How to Track Daily Loss Limits in Your Journal
In TradeZella, the Calendar view shows your daily P&L at a glance. At the end of each week, count how many days exceeded your daily loss limit. If the number is more than one out of five trading days, the problem is not bad luck, it is a pattern that needs diagnosis.
Tag any day where you hit the daily loss limit ("DLL Hit") and any day where you exceeded it ("DLL Exceeded"). The difference matters: hitting the limit and stopping is the system working. Exceeding it means you traded through the limit, which is a trading discipline problem.
Tool 4: The Giveback Rule
The giveback rule is a risk management tool that prevents you from turning a winning day into a losing day. It sets a threshold: once your unrealized daily profits reach a certain level, you activate a floor below which you stop trading for the day. If your profits fall back to that floor, you close everything and walk away with a profit instead of giving it all back.
This is one of the most underused risk management tools among retail traders, but it is standard practice at professional trading firms. The giveback rule solves a specific psychological trap: a trader having a great morning starts feeling invincible, takes lower-quality setups in the afternoon, and gives back everything they earned.
How the Giveback Rule Works
The rule: Once you reach +3R in daily profits (three times your risk per trade), your giveback floor activates at +1R. If your daily P&L drops from +3R back down to +1R, you stop trading for the day.
Dollar example on a $50,000 account risking 1% ($500 per trade):
You take three trades in the morning. Two wins at +1.5R each ($750 each) and one loss at -1R ($500). Your daily P&L is +$1,000 (+2R).
You take a fourth trade. It wins +1.5R ($750). Your daily P&L is now +$1,750 (+3.5R). The giveback rule activates.
Your giveback floor is +1R = +$500. You can keep trading, but if your daily P&L drops to +$500, you must stop immediately. You are guaranteed to end the day at least +$500 in profit no matter what happens in the afternoon.
Without the giveback rule, here is what often happens: the trader keeps trading into the afternoon, takes two losses (-$1,000), and ends the day at +$750. Not terrible, but they left $1,000 on the table. Worse, on some days, the afternoon losses continue and the +$1,750 day becomes a -$500 day. That swing, from +$1,750 to -$500, is a $2,250 psychological hit that carries into the next morning.
Why +3R and +1R?
The +3R activation threshold means the rule does not trigger on average days. It only kicks in when you are having a genuinely good day, which is exactly when the temptation to overtrade is highest.
The +1R floor ensures you end the day with enough profit to absorb a full loser the next day and still be ahead. If you end at +$500 today and lose $500 on your first trade tomorrow, you are still at breakeven for the two-day period. That removes the psychological pressure of feeling like you "need" to win the first trade the next morning.
Some traders use a tighter floor. A common variation is the 50% giveback rule: once your daily P&L hits a new high, you stop if it drops by 50%. So if you peak at +$2,000, you stop if it drops to +$1,000. Both approaches work. The important thing is having a defined rule, not the specific numbers.
When to Override the Giveback Rule
There are only two legitimate reasons to continue trading after your daily P&L starts dropping from a high:
1. An A+ setup appears. If your highest-conviction setup, the one with the best trading expectancy in your journal data, triggers in the afternoon, you can take it. But only that specific setup. No "close enough" trades.
2. You are managing an existing swing position. The giveback rule applies to new trade entries, not to managing positions that are already open with defined stops and targets.
Everything else is a rationalization. "The market is really moving" is not a reason. "I feel good about this one" is not a reason. If your P&L has dropped from peak and you do not have an A+ setup, the giveback rule says stop.
How to Track the Giveback Rule in Your Journal
At the end of each trading day, record your peak daily P&L and your closing daily P&L. The difference is your giveback amount. Over time, track two numbers monthly: average giveback (dollars given back from peak), and giveback days (how many days you gave back more than 1R from peak).
In TradeZella, use the Notebook to log your peak P&L each day alongside your closing P&L. Tag days where you violated the giveback rule ("Giveback Violation") and filter the Tags report to see the monthly cost. Many traders discover that their giveback violations cost them more per month than their actual losing trades.
Tool 5: Stop Orders and Bracket Orders
A stop order is a pre-set instruction to exit a losing trade at a specific price. A bracket order combines a stop loss (downside exit) with a profit target (upside exit) into a single order, so the trade is fully managed the moment you enter it. Both tools remove the need to make exit decisions under emotional pressure.
Every risk management tool discussed above depends on stop orders to work. Your risk per trade calculation assumes the stop loss will be honored. Your daily loss limit assumes losses will be capped at the planned amount. Without hard stops, none of these tools function because actual losses can exceed planned losses by multiples.
Hard Stop vs. Mental Stop
A hard stop is an actual order sitting on the exchange or with your broker. A mental stop is a price level you plan to exit at, relying on your discipline to execute when the time comes.
Use hard stops. Mental stops fail at exactly the moment they matter most. When a trade drops through your planned exit, your brain starts rationalizing: "It will come back," "The support is just below," "Let me give it one more minute." By the time you override the rationalization and manually exit, the loss is 2-3× what you planned.
This is not a discipline problem unique to beginners. Markets can move so fast during news events, earnings releases, or liquidity gaps that even experienced traders freeze. A hard stop executes automatically regardless of what your emotions are doing in that moment.
Bracket Orders: The Complete Solution
A bracket order is a hard stop and a profit target submitted together. When one fills, the other automatically cancels.
Example: You buy 185 shares of AAPL at $192.50.
Stop loss at $190.00 (risk: $462)
Profit target at $197.50 (reward: $925)
Risk-reward ratio: 2:1
Once the bracket order is in place, you can step away. If the trade hits your target, the profit is taken automatically. If it hits your stop, the loss is capped automatically. No emotional decision required at either exit point.
When Hard Stops Are Not Enough
Hard stops protect against normal price movement but not against gap risk. If a stock closes at $192.50 and opens the next day at $185.00 due to an earnings miss, your stop at $190.00 fills at $185.00. Your planned $462 loss becomes a $1,387 loss.
This is why position sizing matters more than stop placement. Even with gap risk, a position sized at 1% account risk limits the damage. A $1,387 loss on a $50,000 account is 2.8%, painful but survivable. A trader who sized the position at 3% risk would face an 8.4% loss on the same gap, which could approach or breach a prop firm's daily loss limit on a single trade.
For overnight and swing trades, account for gap risk by reducing position size. If your normal risk is 1%, size the position at 0.5-0.75% for trades held through earnings, FOMC announcements, or other scheduled catalysts.
How to Track Stop Execution in Your Journal
In TradeZella, every trade imports with exact fill prices. Compare your planned stop to your actual exit price on losing trades. The difference is slippage. Track average slippage monthly. If your average slippage is consistently above $20-30 per trade, you may be trading instruments or times of day with insufficient liquidity.
Also track "stop moved" trades. Create a custom tag for trades where you moved the stop further from entry (widening risk). These are some of the most expensive mistakes in trading because they combine a larger loss with the psychological damage of knowing you broke your own rule. Filter the Tags report to see the monthly cost of stop-moving, and you will likely find it is one of your largest expense categories.
How Do These Five Tools Work Together?
Each tool operates at a different level, and they form a hierarchy from account-level protection down to individual trade execution:
Level 1: Maximum Drawdown (account level). Sets the absolute floor. If the account drops to this level, all trading stops.
Level 2: Daily Loss Limit (session level). Caps the damage any single day can do. Prevents one bad session from putting a meaningful dent in the account.
Level 3: Giveback Rule (session level, profit protection). Protects open profits during a winning day. Prevents giving back gains to the market.
Level 4: Risk Per Trade (trade level). Controls the size of each individual position based on the stop loss distance.
Level 5: Stop Orders (execution level). Ensures the planned risk is actually honored when the trade moves against you.
Write all five into your trading plan with specific dollar amounts. Before each trade, verify that the planned position does not violate any level. After each day, verify in your journal that all five were followed.
Tool
What It Controls
When It Activates
Example ($50K Account)
What Happens When Hit
Maximum Drawdown
Total account loss from peak
When account drops below threshold
$40,000 (20% below peak)
Stop all trading. Review journal. Minimum 1-2 weeks off.
Daily Loss Limit
Maximum loss in one session
When daily P&L hits limit
-$1,500 (3× risk per trade)
Close all positions. Done for the day.
Giveback Rule
Profit protection on winning days
When daily P&L reaches +3R, floor at +1R
Activates at +$1,500, floor at +$500
Stop if P&L drops to floor. Walk away with profit.
Risk Per Trade
Individual position size
Before every entry
$500 (1% of equity)
Size position so max loss = $500.
Stop Orders
Exit execution
Immediately after entry
Hard stop at planned level
Automatic exit. No emotional decision.
What Are the Most Common Risk Management Mistakes?
Having these tools is not enough. The most common failure is having the rules but not following them. Here are five mistakes that break the system:
1. Moving your stop loss. You enter a trade with a stop at $190.00, but when the price drops to $190.50, you move the stop to $188.00 "to give it more room." You just doubled your risk without adjusting your position size. The trade that was supposed to risk $500 now risks $1,000. This single behavior, when repeated, accounts for a significant percentage of blown accounts.
2. Trading through your daily loss limit. You hit $1,500 in losses and tell yourself "the next trade will be the one that turns it around." It almost never is. Data from trading journals consistently shows that trades taken after hitting the daily loss limit have worse outcomes than average because the trader is operating in a compromised emotional state. This is the entry point for revenge trading.
3. Not having a giveback rule at all. Most retail traders do not use a giveback rule. They let winning days run until the market closes, which means their best days are almost always smaller than they could have been. The psychological cost is even worse: repeatedly watching profits evaporate trains the brain that profits are temporary, which leads to cutting winners short on future trades.
4. Using mental stops instead of hard stops. "I know my stop level, I will exit manually." This works 80% of the time. The 20% where it fails, the fast moves, the news events, the moments of hesitation, those are the trades that cause outsized damage.
5. Calculating risk per trade incorrectly. Some traders think risk per trade is the total position value. Risking "1%" by buying $500 worth of stock is not the same as risking 1% ($500) with a defined stop loss. The first method tells you nothing about your actual downside. The second method precisely controls it.
How Do You Build a Risk Management Checklist?
The simplest way to implement all five tools is a pre-trade checklist. Before every entry, run through these questions:
1. Am I within my maximum drawdown? Check your current account equity against your drawdown limit. If you are within 3% of the limit, do not trade.
2. Am I within my daily loss limit? Check today's P&L. If you have already lost 75% of your daily limit, stop. Do not wait until 100%.
3. Is my giveback rule active? If today's P&L peaked above +3R and has dropped back, check whether it has hit your floor. If so, no more trades today.
4. Is my position size correct? Run the position size calculator: account equity × risk percentage ÷ stop loss distance = position size. Round down.
5. Is my stop order placed? Before the entry order fills, the stop order (or bracket order) must be ready to submit. Not "after I see how the trade develops." Before entry.
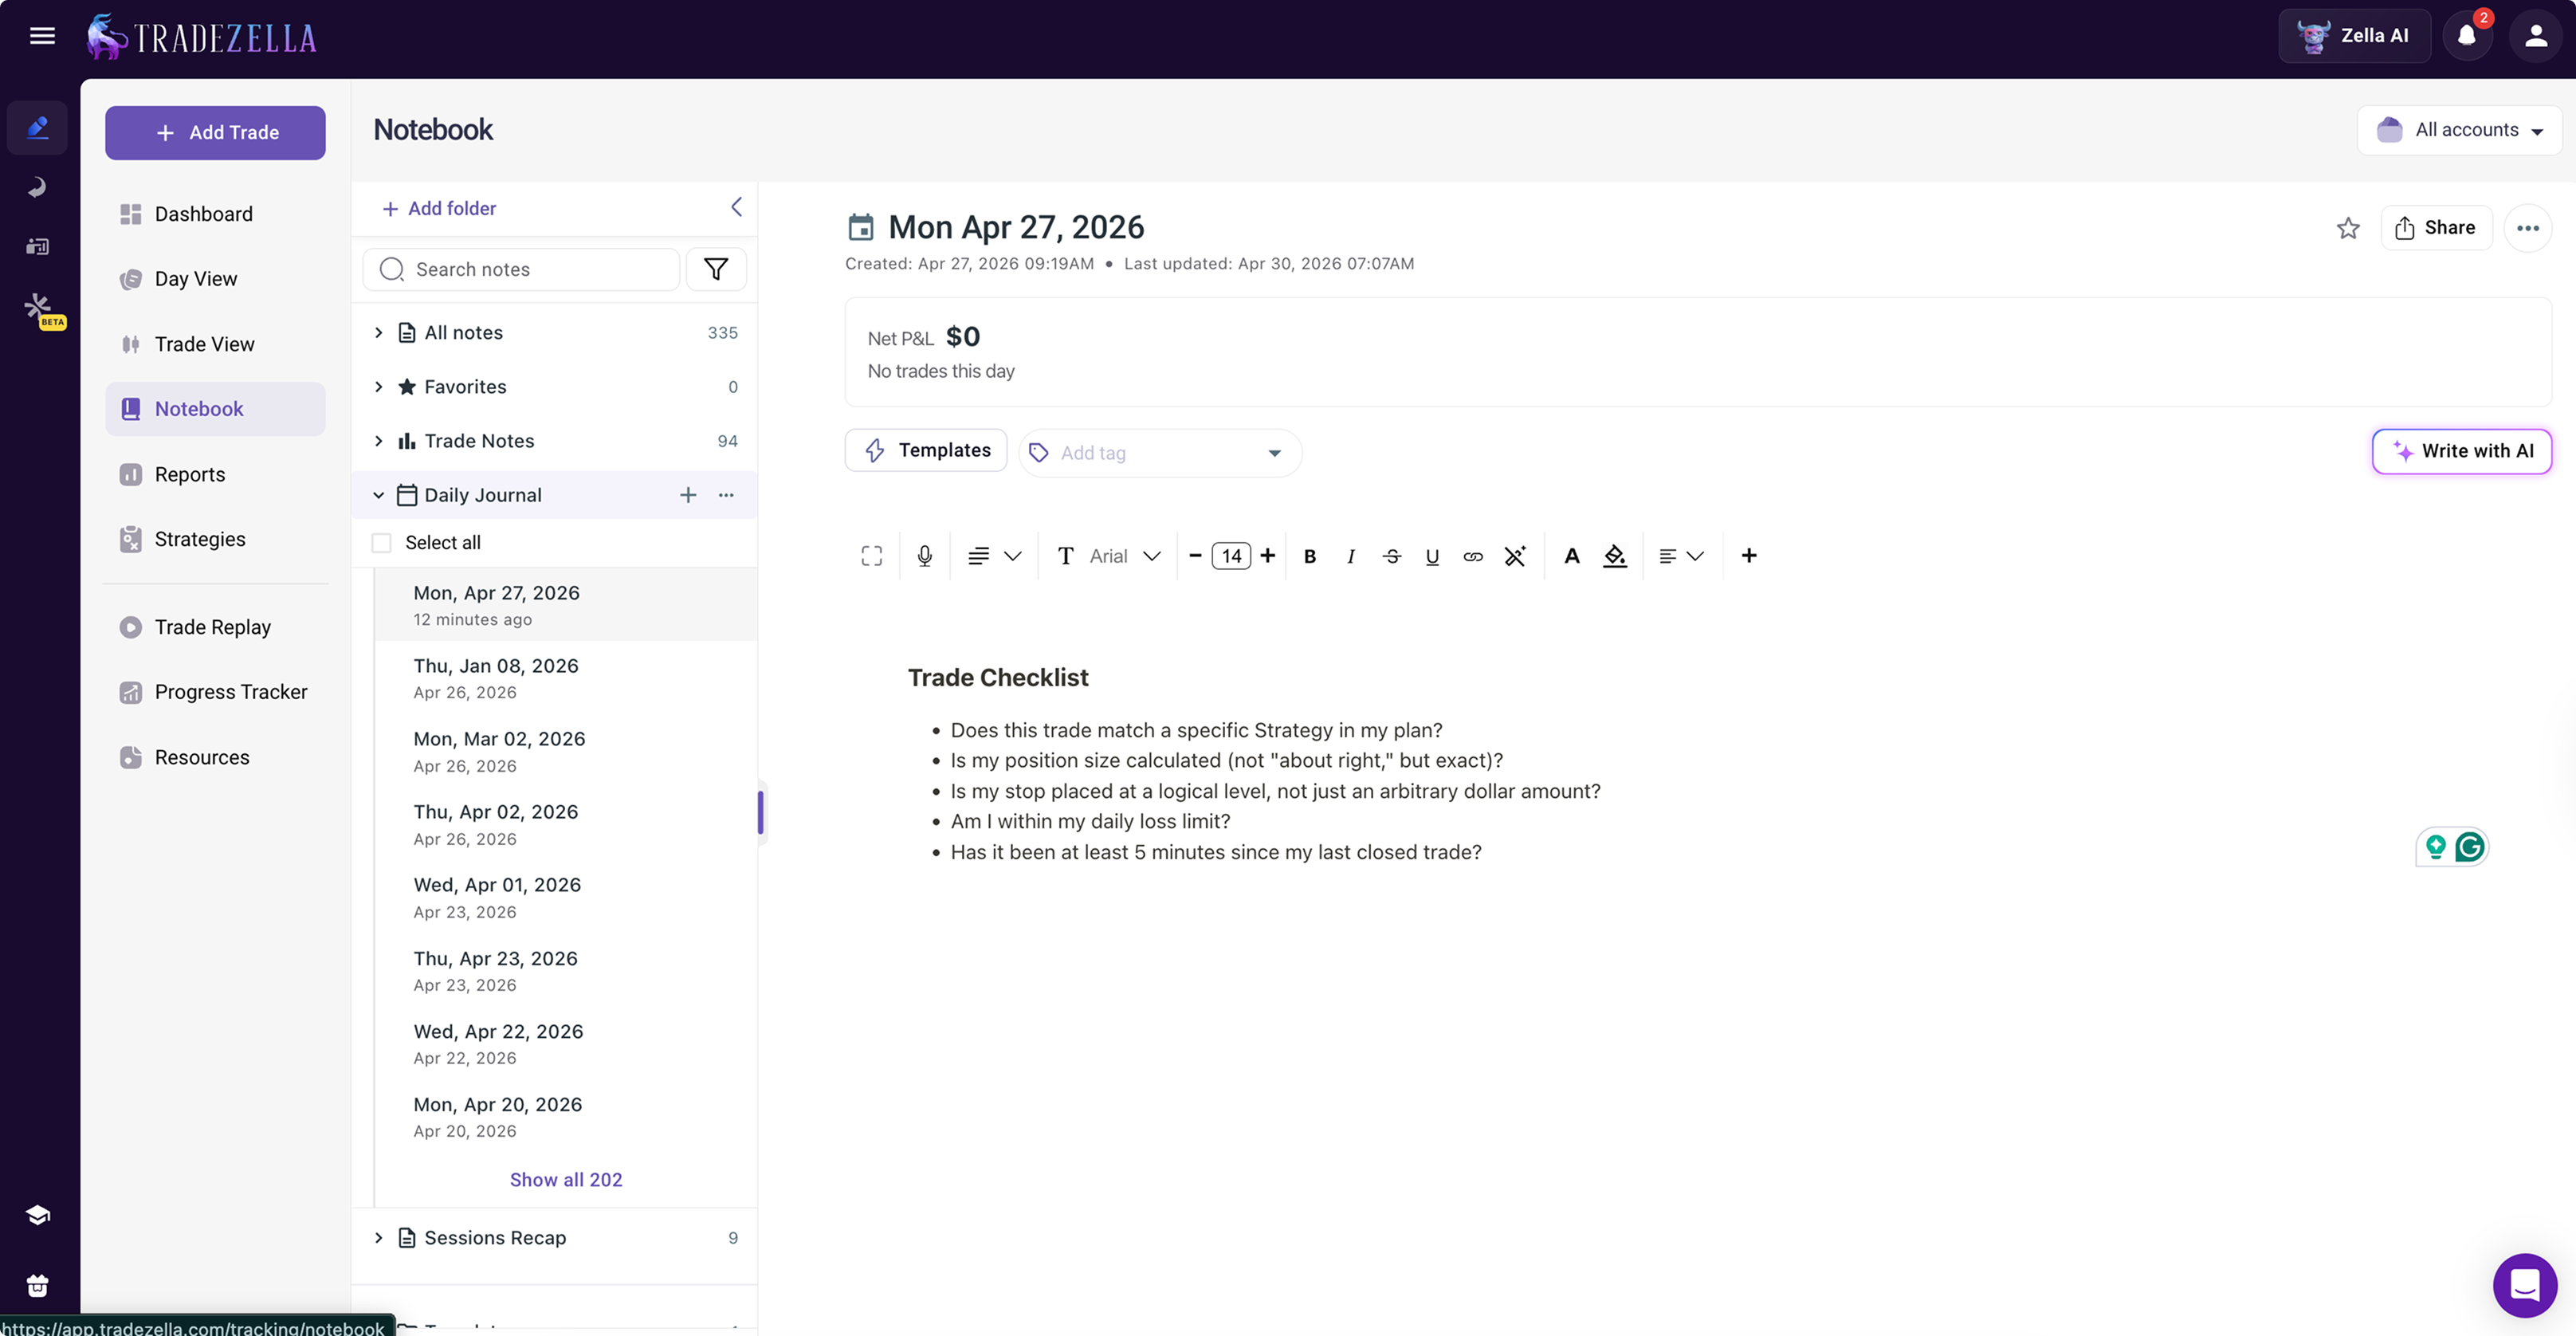
In TradeZella, use the Notebook feature as your pre-trade checklist. Document these five questions and answer them before every single trade. Over time, the Tags report will show you which rule gets broken most often and how much each violation costs per month.
For the complete weekly review workflow that ties all of these tools together, read how to analyze your trading performance using your trading dashboard.
Key Takeaways
Professional traders use five layered risk management tools: maximum drawdown, risk per trade, daily loss limit, the giveback rule, and stop orders.
Maximum drawdown is the absolute floor for your account. Set it at 15-25% for personal accounts or 3% below the firm's limit for prop accounts.
Risk per trade at 1% ($500 on a $50K account) survives 10+ consecutive losses without catastrophic damage.
Set your daily loss limit at your average good winning day (midpoint between average win day and best win day) or 3× your risk per trade.
The giveback rule activates at +3R daily profit with a floor at +1R. It prevents winning days from turning into losing days.
Use hard stops and bracket orders for every trade. Mental stops fail when they matter most.
Track all five tools in your journal with custom tags and review compliance weekly.
Frequently Asked Questions
What are the most important risk management tools for traders?
The five most important risk management tools for traders are maximum drawdown (the total amount you are willing to lose before stopping), risk per trade (the maximum loss on any single position, typically one percent of account equity), daily loss limit (the maximum you can lose in one trading session), the giveback rule (a profit protection rule that prevents winning days from turning into losing days), and stop orders (pre-set exit orders that execute automatically). These five tools work as a layered system from account level protection down to individual trade execution.
What is the giveback rule in trading?
The giveback rule is a risk management tool that protects intraday profits. Once your daily profit and loss reaches a threshold, typically three times your risk per trade (three R), a profit floor activates at one R. If your daily profit drops back to that floor, you stop trading for the day and walk away with a guaranteed profit. For example, on a fifty thousand dollar account risking one percent (five hundred dollars) per trade, the giveback rule activates when daily profit reaches fifteen hundred dollars and sets a floor at five hundred dollars. Without this rule, traders frequently give back morning profits during afternoon overtrading.
How do I calculate my daily loss limit?
Calculate your daily loss limit by finding the midpoint between your average winning day and your best winning day over the last sixty trading days. For example, if your average winning day is six hundred dollars and your best winning day is twenty four hundred dollars, your daily loss limit is fifteen hundred dollars. If you do not have sixty days of data yet, use three times your risk per trade as a starting point. At one percent risk on a fifty thousand dollar account (five hundred dollars per trade), that equals a fifteen hundred dollar daily loss limit.
Should I use a hard stop or a mental stop?
Always use a hard stop. A hard stop is an actual order placed with your broker that executes automatically. A mental stop relies on your discipline to manually exit when the price reaches your planned level. Mental stops fail at the exact moments they matter most: during fast moves, news events, and emotional situations where the brain rationalizes holding. Data from trading journals consistently shows that trades where the stop was moved or not honored result in losses two to three times larger than planned.
How much should I risk per trade on a prop firm account?
On prop firm accounts with a five percent daily loss limit, risk zero point five to zero point seven five percent per trade. This allows six to ten losing trades before hitting the daily limit, leaving room for slippage and commissions. Set your personal maximum drawdown three percent below the firm's hard limit. For example, if the firm allows ten percent total drawdown on a one hundred thousand dollar account, set your personal limit at seven percent (seventy thousand dollars remaining). This buffer prevents a single bad day from terminating the account.
What is the biggest risk management mistake traders make?
The biggest risk management mistake is moving the stop loss further from entry after the trade is open. This behavior doubles or triples the planned risk without adjusting position size, turning a controlled five hundred dollar loss into an uncontrolled one thousand dollar or fifteen hundred dollar loss. Traders who move stops often do so repeatedly, creating a pattern that compounds over time. In a trading journal, you can tag every trade where the stop was moved and filter the Tags report to calculate the exact monthly cost of this behavior.
How do these five risk management tools work together?
The five tools form a hierarchy from account level to execution level. Maximum drawdown sets the absolute floor for the entire account. Daily loss limit caps damage on any single day within that account. The giveback rule protects profits during winning days. Risk per trade sizes each individual position. Stop orders execute the exit plan automatically. Each level reinforces the others: risk per trade ensures you never hit the daily loss limit too quickly, the daily loss limit ensures you never approach the maximum drawdown too fast, and the giveback rule ensures that winning days actually contribute to the account balance instead of evaporating.