


Built For
Instruments: Futures
Trading Style: Scalping
Strategy Overview
This Strategy is built on the principles of Auction Market Theory (AMT), Volume Profile, and Order Flow.
The core idea is simple: the market is an auction that moves between two conditions:
- Balance – where price rotates around fair value and most trading activity happens.
- Imbalance – where one side is aggressive, pushing the price away to search for a new fair value.
Most traders lose because they try to trade every breakout or market structure pattern without checking if the market is balanced or not. In balance, 70% of the time, the market stays stuck, so trying to trade breakouts there usually ends in multiple stop-outs. The key is to only act when the market is giving you clear conditions.
This model solves that problem by combining three simple steps:
- Market State – First, read whether the market is in balance or out of balance.
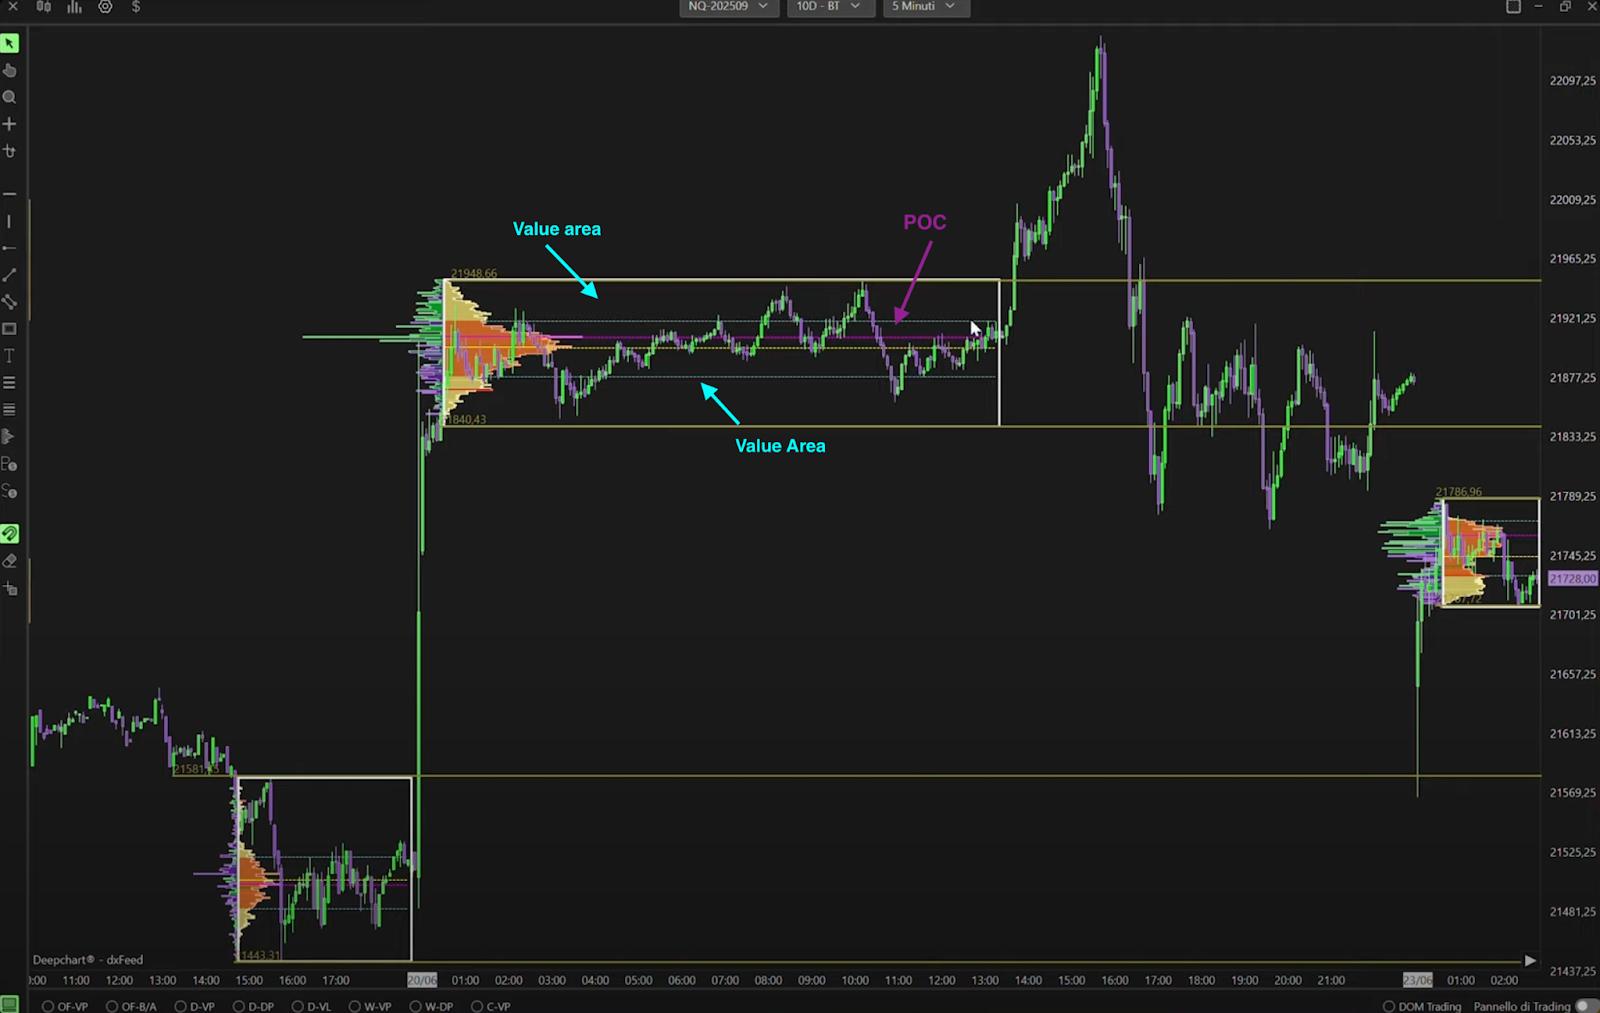
- Location – Next, use the Volume Profile to find the exact levels that matter, like LVNs (low-volume nodes) and POC (Point of Control).
- Aggression – Finally, wait for clear order flow confirmation at those levels, big prints, imbalances, or strong CVD pressure.
When these three align, you have a trade. If even one is missing, you stay flat.
The playbook has two complementary setups:
- Trend Model – Trade continuation when the market is out of balance and searching for new value.
- Mean Reversion Model – Trade the snap-back when the market fails outside balance and comes back inside.
Both setups are intraday, risk-controlled, and built to adapt to different market conditions. Together, they give a trader structure to handle both trending and ranging environments without relying on prediction.
Strategy Setups
Setup 1: Trend Model (Out-of-Balance → Seek New Balance)
This setup is designed for when the market is out of balance and pushing directionally. Instead of guessing breakouts inside balance, you wait until the market clearly shows it’s moving away from value and then ride that continuation into the next balance area.
When to Use
- Works best in the New York session (NASDAQ, ES).
- Avoid the London open, too many fake breakouts.
- Use this setup when the market is out of balance and moving with momentum.
Step 1 – Market State
- Confirm that the market is out of balance.
- You should see displacement and momentum away from the prior value.
- If the price is just rotating up and down, skip this setup.
Step 2 – Location
- Take the impulse leg that broke the structure.
- Apply a Volume Profile to that leg.
- Identify Low-Volume Nodes (LVNs) inside that move. These LVNs are key reaction points.
- Place alerts just before LVNs — don’t place blind limit orders.
Step 3 – Execution Trigger
- When the price comes back into the LVN, check the order flow. Look for aggression in the direction of the trend:
- Big sell bubbles or footprint imbalance for shorts.
- Big buy bubbles or imbalance for longs.
- Only enter when you see aggression. No aggression = no trade.
Step 4 – Risk Management
- Stop Loss: Place just beyond the aggressive print. Add a 1–2 tick buffer before the obvious swing high/low to avoid slippage.
- Break-even: If CVD (Cumulative Volume Delta) shows strong pressure, move the stop to break-even early.
- Risk Size: Keep risk small, 0.25% to 0.5% of the account per trade.
Step 5 – Target
- Target the previous balance POC (Point of Control).
- Close the full position there.
- On rare strong trend days, you can trail beyond, but the main rule is to exit at the POC because 70% of the time, the price reverses from balance.
Setup 2: Mean Reversion Model (Out-of-Balance → Back Into Balance)
This setup is the opposite of the Trend Model. Instead of following a strong move away from balance, you watch for times when the price breaks out but can’t hold. When that happens, the most likely outcome is that the market returns to the Point of Control (POC) inside the balance area where most trading activity occurred.
When to Use
- Works best in the London session or during compressed summer conditions.
- Use this when the market tries to break out of balance but fails.
Step 1 – Market State
- Market must be in balance or consolidation.
- Simple approach: use the previous day’s profile as the balance reference.
- Watch for the price to push out of balance and then fail.
Step 2 – Location
- Do not take the first move back; that’s risky.
- Wait for:
- A clear reclaim inside balance.
- A pullback into the reclaim leg.
- Apply volume profile on the reclaim leg and mark the LVNs.
Step 3 – Execution Trigger
- On the pullback into the LVN, check the order flow.
- Look for aggression in the direction of the snap-back:
- Big buy prints for longs after reclaim.
- Big sell prints for shorts after failed upside breaks.
- Enter only when aggression shows up.
Step 4 – Risk Management
- Stop Loss: Place just beyond the aggressive print. Add a 1–2 tick buffer before obvious highs/lows.
- Risk Size: Keep risk small (0.25–0.5% of account per trade).
- Invalidation: If you’re wrong, you should be wrong immediately. Never widen the stop.
Step 5 – Target
- Target the balance POC (center of value).
- Exit full position there.
- Don’t stretch for the other side of the range unless conditions are exceptional.
Pros and Cons of the Strategy
This Strategy is designed to deliver high-quality, repeatable setups — but like any trading strategy, there are key things to understand before using it.
Note: The cons listed here aren’t disadvantages. They are things to be aware of — important characteristics that require patience, discipline, and proper management to make the strategy work effectively.
Pros
- Clear and structured. The model simplifies trading into three steps: market state, location, and aggression, making decisions straightforward and rule-based.
- Adaptable to conditions. With one model for trending days and another for ranging days, the Strategy provides coverage across different market environments.
- Tight and efficient risk. Stops are placed just beyond aggression, keeping losses small and allowing quick invalidation.
- Frequent trade opportunities. The approach generates a large sample of trades, helping traders build consistency and recover quickly from drawdowns.
- Built-in discipline. If the conditions aren’t present, no trade is taken. This naturally prevents overtrading and revenge trades.
- Scalable returns. Normal trades often deliver 1:2.5 to 1:5 reward-to-risk, and on strong days, much larger ratios are possible.
Cons
- Mentally demanding. Multiple small stop-outs in a row are common, and seeing consecutive losses can be difficult to handle.
- Requires focus and time. The setups demand full attention during the London or New York sessions. It’s not suitable for casual or part-time trading.
- Lower win rate in choppy markets. On compressed or indecisive days, expect more failed trades and a reduced strike rate.
- Psychological pressure with size. Managing large position sizes intraday can be stressful, even if the model has positive expectancy over time.
Trade Breakdown
Model 1: Trend Continuation (Out of Balance → New Balance)
Market Condition:
New York session, market is out of balance and trending higher.
Trade Breakdown
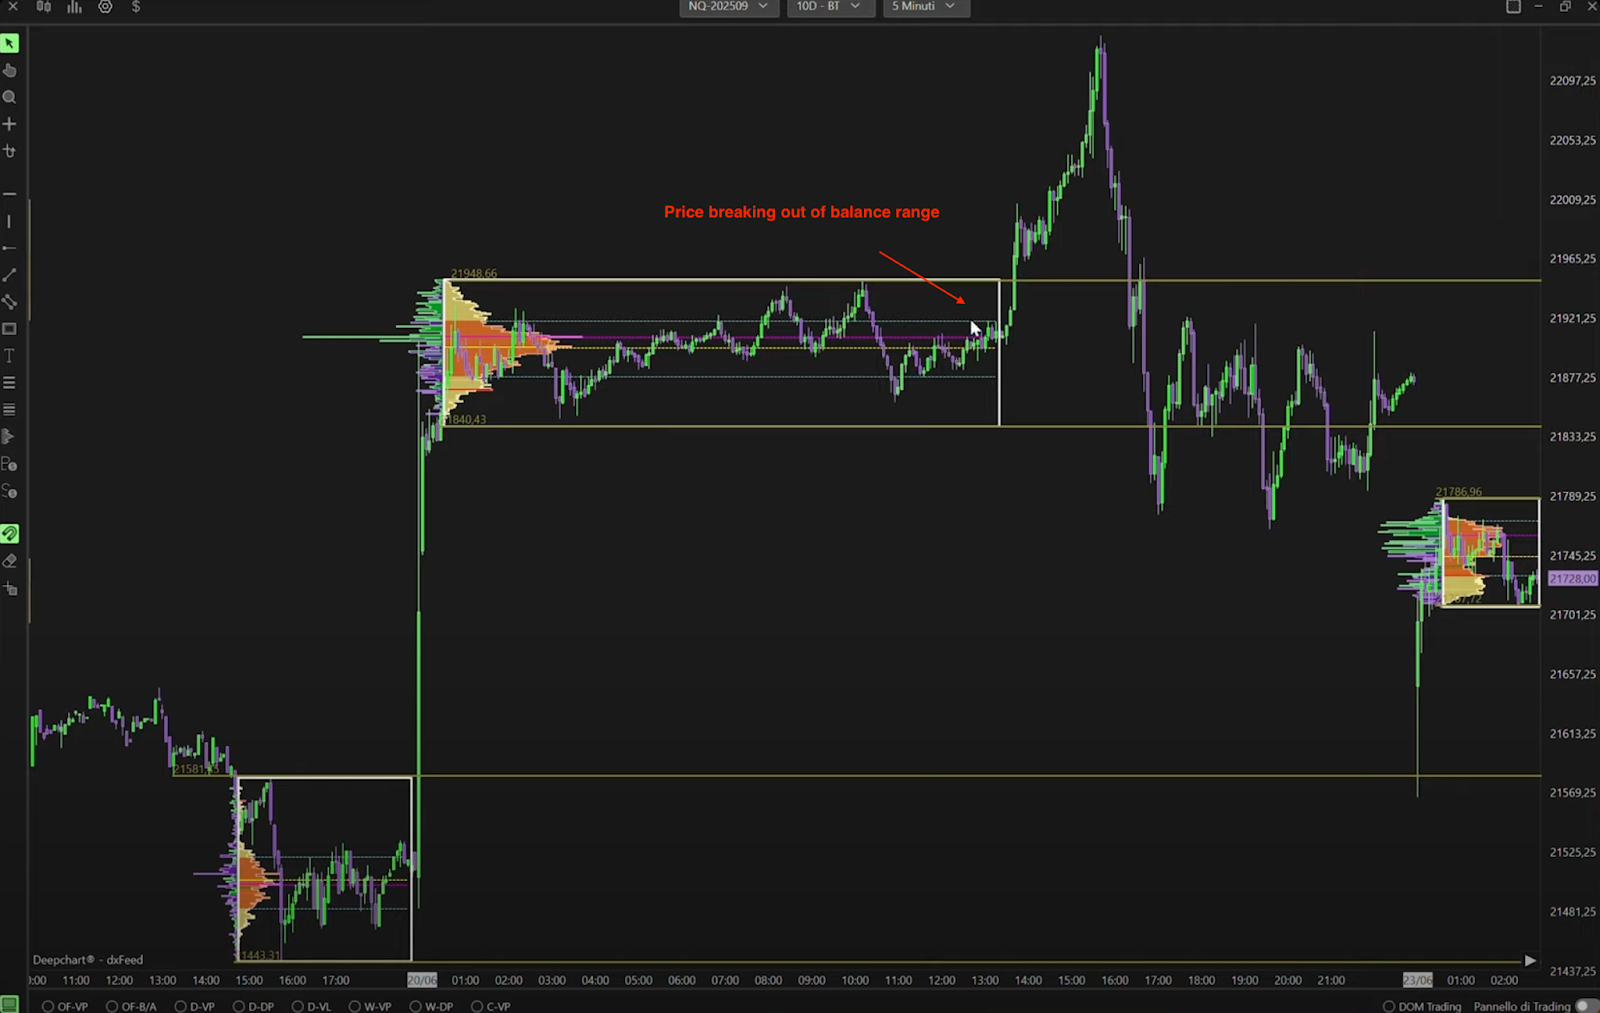
- Price breaks out of balance in New York and pushes strongly upward.
- Plot the profile from the start of the impulse to the top of the move. A clear low-volume node (LVN) forms in the retracement zone.
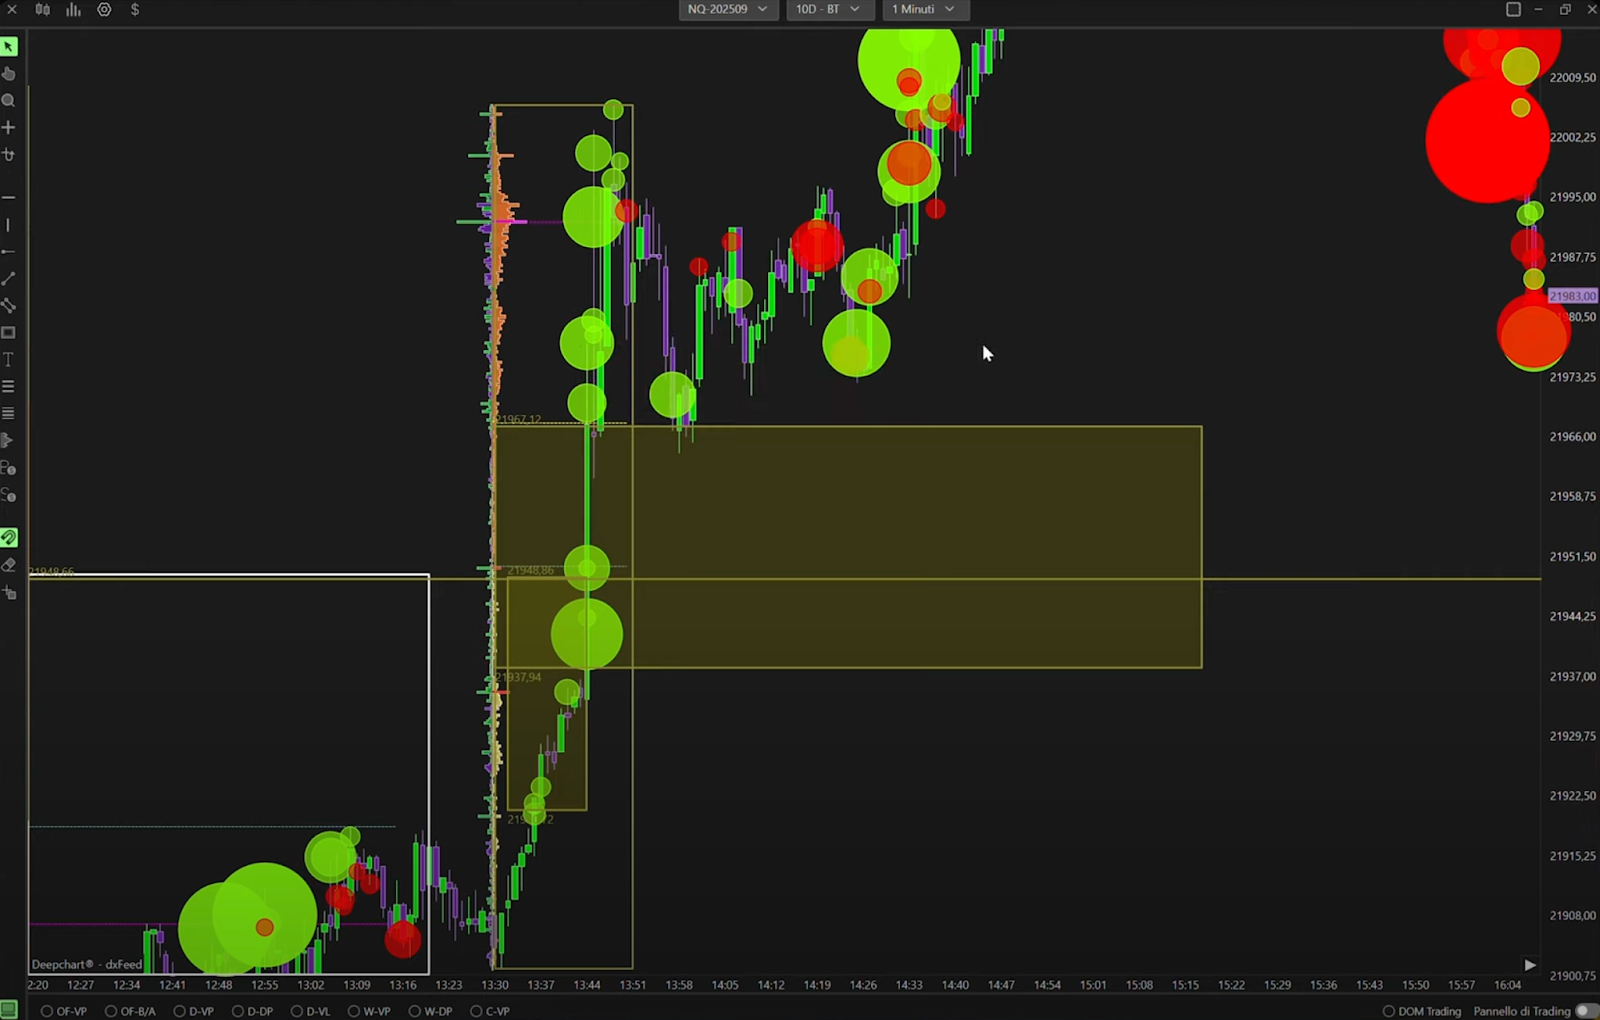
- On the footprint, big buy aggression hitting right at that LVN — the confirmation to wait for.
- Enter long with a stop just below the LVN.
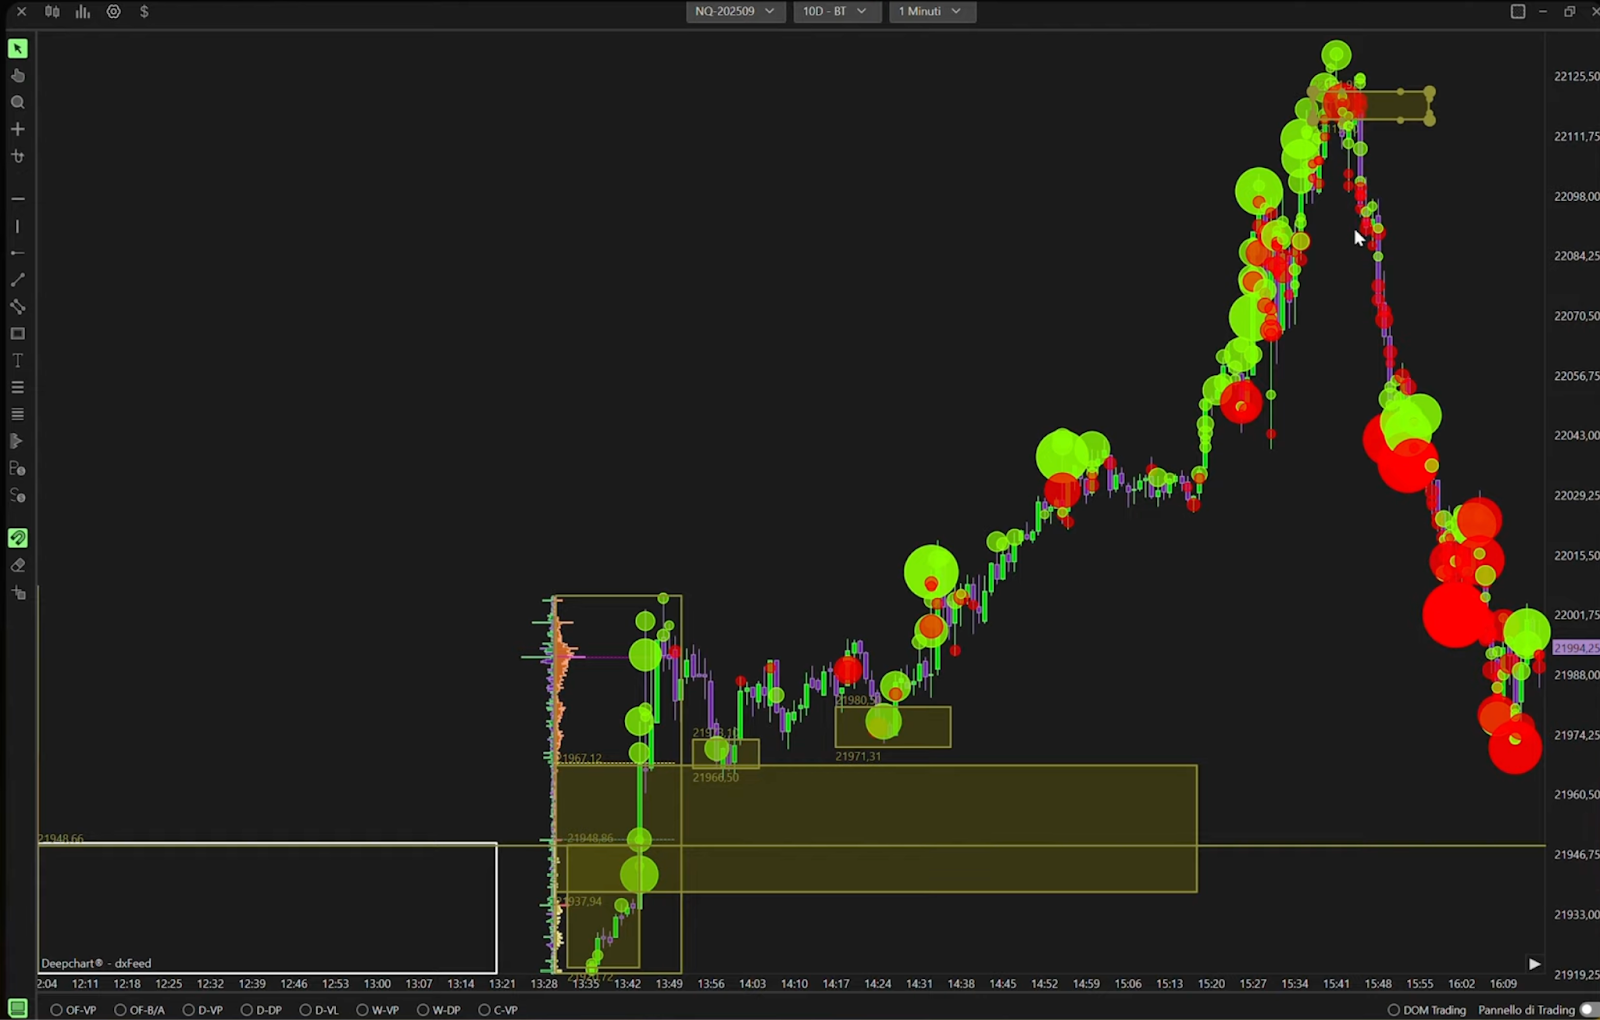
- Price continues higher in line with the flow. As momentum builds, sellers try to fight back, but there’s no follow-through. Buyers remain in control.
- As sellers appear with aggression and start to challenge the move, the trade is exited to protect profits.
Model 2: Mean Reversion (Failed Breakout → Back to Balance
Market Condition:
London session, market is balanced and attempting a breakout out of the balance range.
Trade Breakdown
- Price first pushes above the balance area and looks like it might continue higher, but there’s no real follow-through. That first attempt ends up failing.
- A second breakout attempt also fails, and this is where the reversion model comes into play.
- On the volume profile, price rejects above the value area and comes back inside balance.
- Order flow confirms it — buyers are hitting, but they can’t push the market through. Aggression dies out.
- Enter short once price is firmly back inside balance, with a stop just above the failed high.
- Target is the POC inside the balance, and price rotates cleanly back into value to hit it.
Want to Learn More from Fabio?
He's recording an exclusive masterclass for Chart Academy, a free education platform, where he'll break down his Auction Market Theory approach in detail with live chart examples.
Join the Chart Academy waitlist to get early access when it launches — it's completely free.
How to Backtest This Auction Market Strategy
The fastest way to test this Auction Market Strategy is with TradeZella's automated no-code backtesting. Define your rules in plain English, hit run, and TradeZella runs them across 11+ years of historical data in seconds, then shows you every individual trade along with your win rate, profit factor, and expectancy instantly, without you stepping through a single chart. It is the quickest way to see whether the setup holds up before you risk a dollar.
You can also test it manually by replaying the market bar by bar. Load 11+ years of historical data, set up your volume profile and chart the way you trade live, and replay the session bar by bar. Read the market state first to decide whether price is in balance or out of balance, apply a volume profile to the relevant leg to find your low-volume nodes and point of control, then wait for order flow aggression at those levels. For the Trend Model, enter on a pullback into an LVN in the direction of the move and target the previous balance POC. For the Mean Reversion Model, wait for a failed breakout to reclaim balance, enter on the pullback, and target the POC. Place stops just beyond the aggressive print, keep risk small, and use automatic position sizing with your stop and target on the chart. Every backtested trade gets logged automatically with your entry, exit, position size, and P&L. Tag Trend Model and Mean Reversion Model trades separately so you can compare them, add notes, and review the same way you would a live trade. After 30 to 50 trades, you can see your win rate, profit factor, and expectancy on each model. Manual replay is the best way to build screen time and a real feel for the setup.
When you start trading live, import your live trades into TradeZella, the AI trading journal that does the journaling for you. Your backtest results and live results live in the same platform, so you always know how the strategy performs in testing vs how it performs with real money, without switching between tools or maintaining separate spreadsheets.
Start Backtesting This Strategy Using TradeZella
Frequently Asked Questions
What is the Auction Market Strategy?
The Auction Market Strategy is a futures scalping model built on Auction Market Theory, volume profile, and order flow. It treats the market as an auction moving between balance, where price rotates around fair value, and imbalance, where one side pushes price away to find new value. It uses two complementary setups, a Trend Model for continuation when the market is out of balance and a Mean Reversion Model for the snap-back when a breakout fails, so you have a plan for both trending and ranging conditions.
What is balance and imbalance in Auction Market Theory?
Balance is when price rotates around fair value and most trading activity happens, and the market tends to stay stuck there roughly 70% of the time. Imbalance is when one side is aggressive and pushes price away to search for a new fair value. Most traders lose by trading every breakout without checking the state first. This strategy only acts when the market gives clear conditions, which is why reading balance versus imbalance is the first step.
What are the three steps of this strategy?
Every trade comes down to three steps that must align. First is Market State: read whether the market is in balance or out of balance. Second is Location: use the volume profile to find the exact levels that matter, like low-volume nodes and the point of control. Third is Aggression: wait for clear order flow confirmation at those levels, such as big prints, footprint imbalances, or strong cumulative volume delta pressure. When all three align you have a trade. If even one is missing, you stay flat.
What is the difference between the Trend Model and Mean Reversion Model?
The Trend Model is used when the market is out of balance and moving with momentum. You apply a volume profile to the impulse leg, wait for price to pull back into a low-volume node with aggression in the trend direction, and target the previous balance point of control. The Mean Reversion Model is the opposite: when a breakout fails to hold, you wait for a reclaim back inside balance and a pullback, enter on aggression toward the snap-back, and target the point of control. The Trend Model fits the New York session, while Mean Reversion fits the London session and compressed conditions.
What instruments and session does this strategy use?
This is a futures scalping strategy, traded on instruments like NASDAQ and ES. The Trend Model works best in the New York session and avoids the London open because of too many fake breakouts, while the Mean Reversion Model works best in the London session or compressed summer conditions. Risk is kept small at around one quarter to one half of one percent of the account per trade, with stops placed just beyond the aggressive print.
Can I backtest the Auction Market Strategy?
Yes. You can test this strategy using TradeZella's backtesting with 11+ years of historical data. Replay the session bar by bar, read the market state, apply your volume profile to find LVNs and the POC, and only enter when order flow aggression confirms at those levels. Every trade logs automatically with entry, exit, position size, and P&L, and you can tag Trend Model and Mean Reversion Model trades separately to compare them. After 30 to 50 trades you can see your win rate, profit factor, and expectancy on each model before risking real money.
What is TradeZella backtesting?
TradeZella backtesting lets you test a trading strategy against 11+ years of historical market data across forex, futures, stocks, and crypto, down to seconds-level timeframes. You can do it two ways. Replay the market bar by bar and place trades as if you were trading live, with your own timeframes, automatic position sizing, and stops and targets you drag right on the chart, and every trade logs automatically with entry, exit, size, and P&L. Or use automated no-code backtesting: define your strategy rules in plain English and the engine runs them across years of data in seconds, returning every individual trade it took with the exact setup drawn on the chart, so you see why each trade fired instead of just an equity curve. Zella AI then analyzes the results and flags what to fix.