


Built For
Instruments: Futures/Forex/Crypto
Trading Style: Day Trading
Strategy Overview
This strategy is built around the idea that price seeks liquidity, and that retail traders often get trapped around key highs and lows. Instead of entering trades before price hits liquidity, this playbook waits for the market to run stops (take liquidity) and then trade the reversal after the trap is formed.
The concept is simple: buy below lows, sell above highs, but only when those lows or highs have respected structure and moved away, forming clear resting liquidity. The key is to use liquidity to determine direction, entry, invalidation, and targets.
Strategy Rules
Directional Bias
- Use liquidity to determine bias. If a high is respected and price moves away, there’s liquidity above it. That suggests the market may return there eventually.
- Don’t trade unless liquidity is built. Wait until the price has taken liquidity or formed an inducement before planning a trade.
- If a big move has already happened and left no clear highs/lows with liquidity, there is no trade.
Buy Setup Rules
- Identify a low that was respected and caused the price to move away (creates liquidity below).
- Wait for the price to return and trade below that low.
- Look for confirmation (internal structure, false reaction, trap).
- Buy below the low — never above.
- Place a stop-loss below the low that just got taken.
- Target liquidity at highs, especially highs that were respected and moved the price.
Sell Setup Rules
- Identify a high that was respected and caused the price to move away (creates liquidity above).
- Wait for the price to return and trade above that high.
- Look for confirmation (internal structure, false reaction, trap).
- Sell above the high, never below.
- Place a stop-loss above the high that just got taken.
- Target liquidity at lows, especially lows that were respected and moved the price.
Execution
- Execute after liquidity is taken, not before.
- Use market execution once the high/low is taken and the trap is confirmed.
- Always cover the last high/low with your stop.
- Don’t refine entries too much; keep it simple.
Management
- Only move your stop after price moves in your favor and forms a higher low or lower high.
- No break-even stops unless partials have been taken.
- Don’t take partials at arbitrary R-multiples. Take them only at actual liquidity targets (internal or external).
- Let trades run to meaningful areas, don’t cut trades early unless your system says so.
Timing
- Have a specific session window (e.g. New York Open).
- If your setup doesn’t form in that window, no trade.
- Ignore price action outside your session. You only care about what happens inside your time window.
Pros and Cons of the Strategy
This Strategy is designed to deliver high-quality, repeatable setups — but like any trading strategy, there are key things to understand before using it.
Note: The cons listed here aren’t disadvantages. They are things to be aware of — important characteristics that require patience, discipline, and proper management to make the strategy work effectively.
Pros
- Clear Direction: Liquidity gives structure, bias, and direction without relying on complicated indicators.
- Simple and Logical: No over-complication, just reading highs, lows, and reactions.
- Fractal: Works on all timeframes; the same model applies whether you’re trading 1-minute or daily charts.
- Strict Rules: Clear structure for entries, stops, targets, and invalidation.
- Eliminates Noise: Avoids false setups and reactions by waiting for liquidity to get taken.
- Fits Any Asset: Works across markets (futures, forex, crypto, etc.).
- No Indicators Needed: Entirely price-action based, just using raw highs/lows and time.
Cons
- Requires Patience: Often, you have to wait hours or days for the setup to complete. Most traders struggle with this.
- You Might Miss Moves: If the price moves without taking liquidity, you skip the trade.
- Precision Needed: Must train your eye to see liquidity and traps. This takes time.
- Hard to Unlearn Old Methods: Many struggle to let go of retail concepts like BOS, OB, FVG, etc.
- Not Every High/Low Has Liquidity: You have to judge context properly. Structure alone isn’t enough.
Trade Breakdown
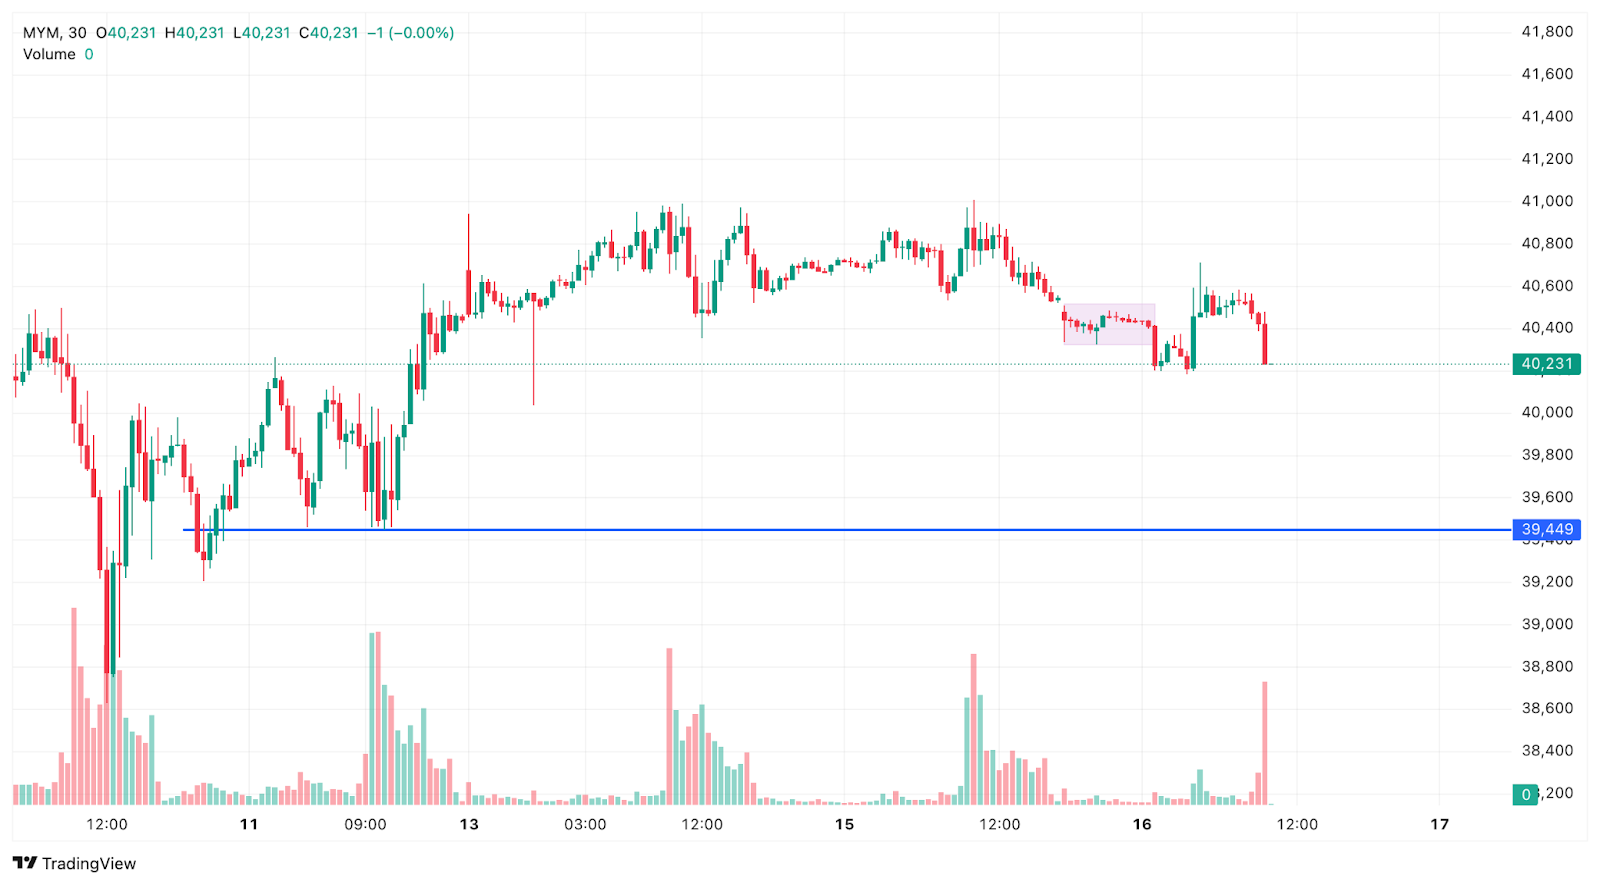
Higher Timeframe Context – 30-Minute Chart
To start the day, the focus was on the 30-minute chart. Price had formed equal lows, meaning multiple lows sitting at the same level. These were likely holding sell-side liquidity, so that area was marked as the target for any short setups.
Pre-New York Price Action
Before the New York open, the price had a bullish move up. During that move, a swing high formed that caused the price to reject and pull back. That high got respected — price didn’t break above it right away — so it became an important level.
This high was marked because liquidity was likely sitting above it.
Set up Forms on the 5-Minute Chart (During NY Open)
Once the New York session opened, the price started moving back toward the high from earlier.
On the 5-minute chart, price ran the high, pushing just above it and triggering stop losses or breakout entries.
But right after the break, the price rejected back below the level. It failed to continue higher, a clear sign of a liquidity grab.
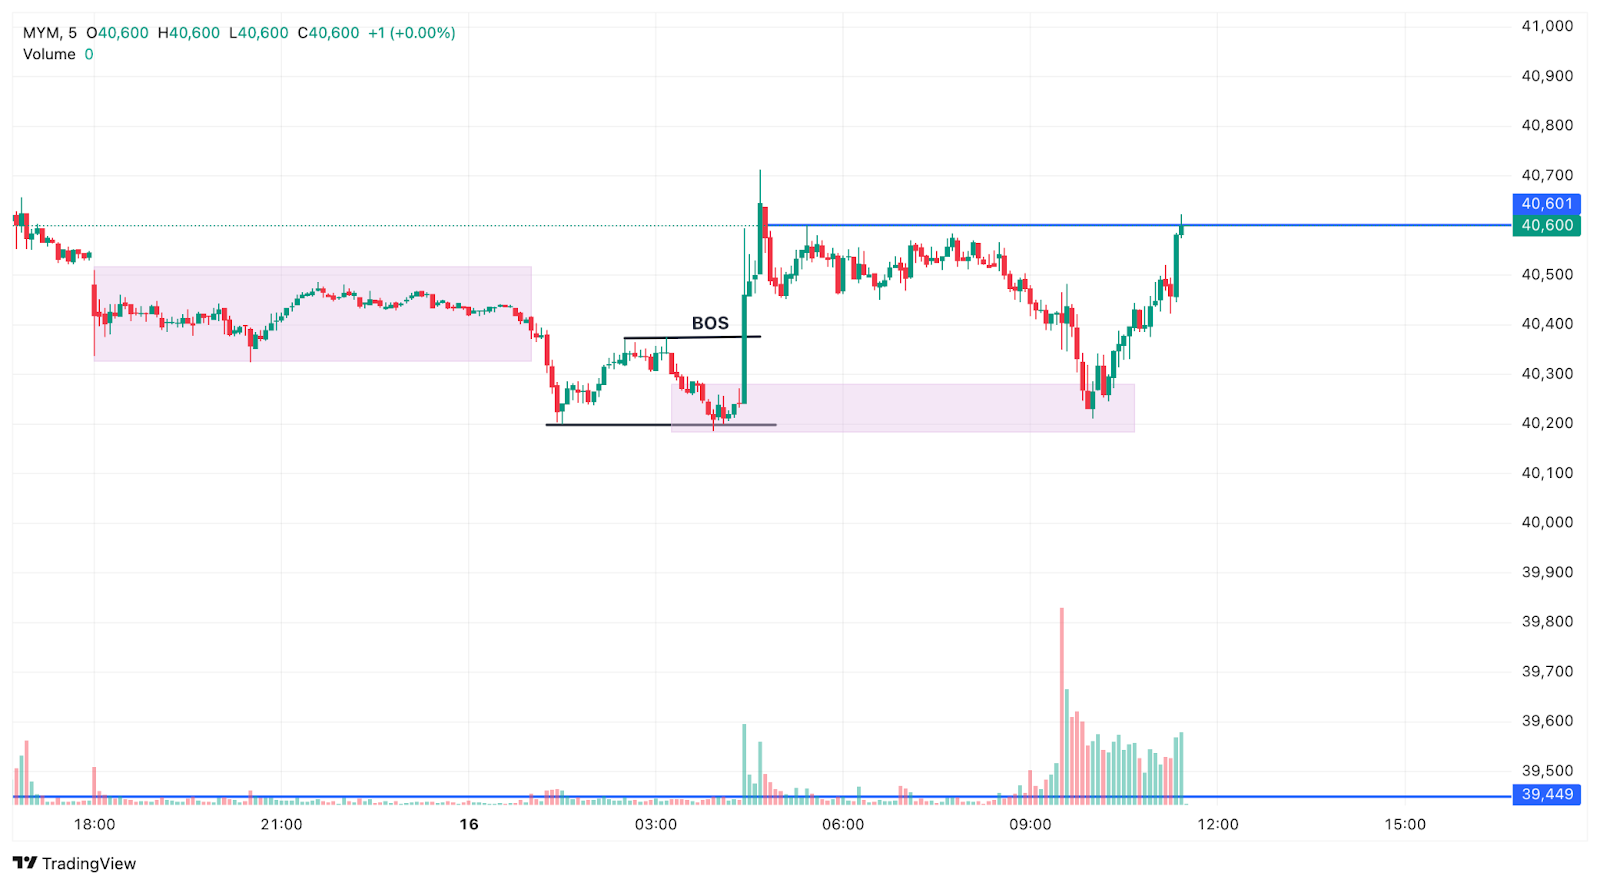
Entry
A short was entered right after the rejection, once the price moved back below the high that had just been taken.
There was no trade before the level was run. The entry came after the trap was confirmed.
Stop Loss
The stop loss was placed just above the swing high that had been taken out. This was a clean structural stop. If the price moved above it again, the trade idea would be invalid
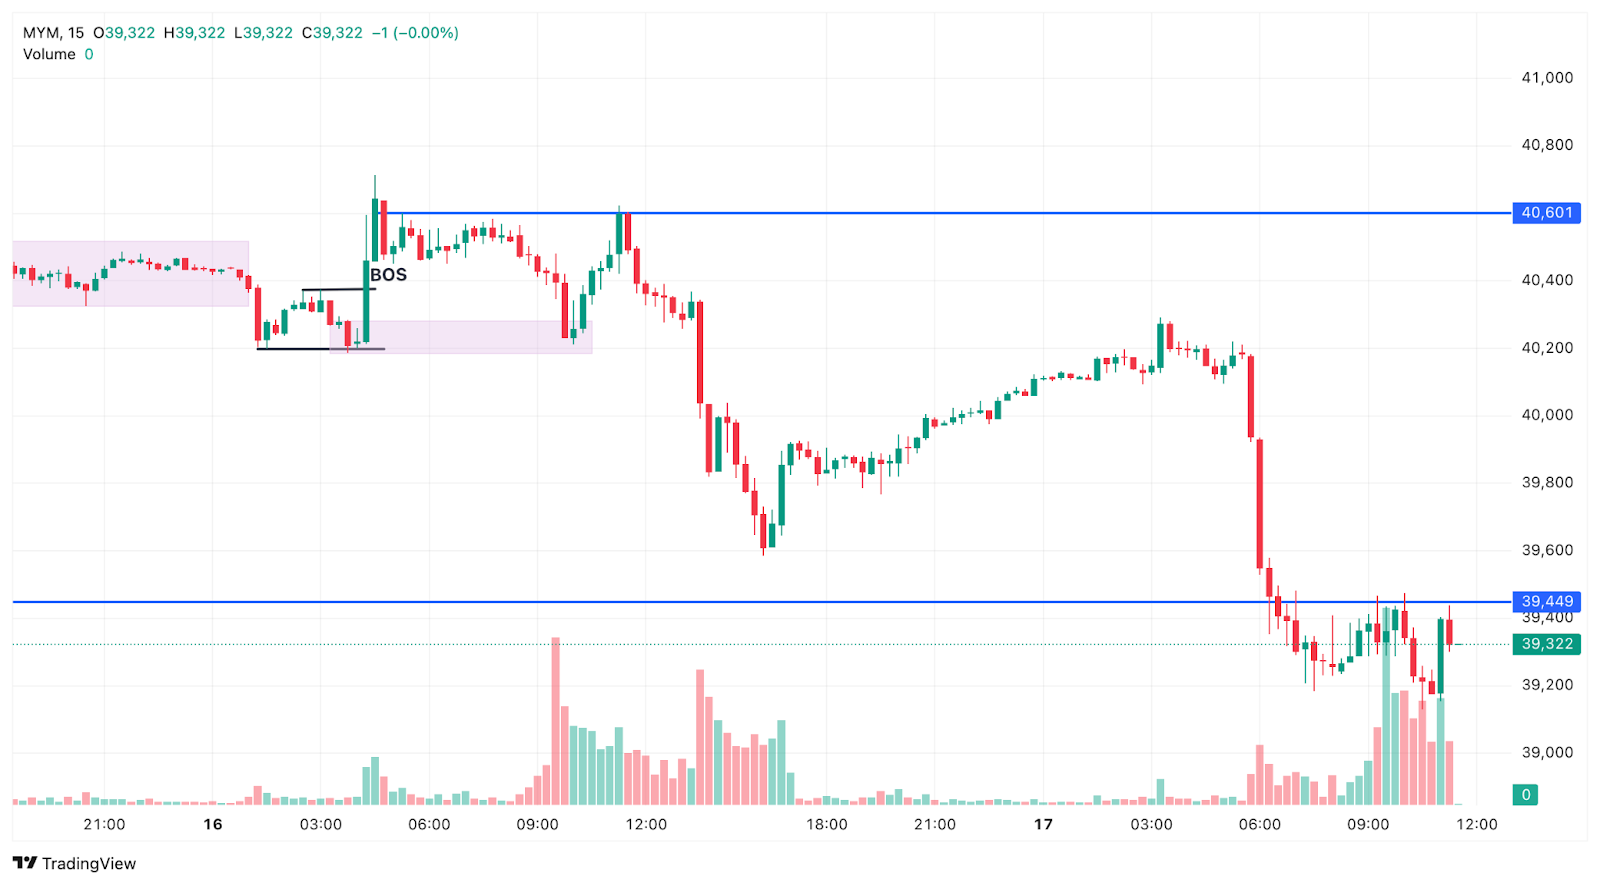
Target
The target was the equal lows marked earlier on the 30-minute chart. These were the liquidity resting below, and the price was likely to move toward them once the trap confirmed.
How to Backtest This Liquidity Strategy
The fastest way to test this Liquidity strategy is with TradeZella's automated no-code backtesting. Define your rules in plain English, hit run, and TradeZella runs them across 11+ years of historical data in seconds, then shows you every individual trade along with your win rate, profit factor, and expectancy instantly, without you stepping through a single chart. It is the quickest way to see whether the setup holds up before you risk a dollar.
You can also test it manually by replaying the market bar by bar. Load 11+ years of historical data, set up your higher timeframe and execution charts the way you trade live, and replay your session window. Mark the highs and lows that were respected and left resting liquidity behind, wait for price to return and take that liquidity, then look for the trap to confirm with a rejection back through the level. Enter after the sweep, place your stop just beyond the high or low that was taken, and target the opposing liquidity. Use automatic position sizing and drag your stop and target directly on the chart. Every trade gets logged automatically with your entry, exit, position size, and P&L. Add notes on what you saw, tag mistakes, and review the session the same way you would a live trading day. After 30 to 50 trades, you can see your win rate, profit factor, and expectancy on this specific setup. Manual replay is the best way to build screen time and a real feel for the setup.
When you start trading live, import your live trades into TradeZella, the AI trading journal that does the journaling for you. Your backtest results and live results live in the same platform, so you always know how the strategy performs in testing vs how it performs with real money, without switching between tools or maintaining separate spreadsheets.
Start Backtesting This Strategy Using TradeZella
Frequently Asked Questions
What is the Liquidity Strategy?
The Liquidity Strategy is a day trading model built on the idea that price seeks liquidity and that retail traders often get trapped around key highs and lows. Instead of entering before price reaches liquidity, you wait for the market to run stops and then trade the reversal after the trap forms. The simple rule is to buy below respected lows and sell above respected highs, using liquidity to define direction, entry, invalidation, and targets.
What is a liquidity sweep, or taking liquidity?
A liquidity sweep happens when price runs through a key high or low where stop orders and breakout entries are clustered, then quickly reverses. The high or low must have been respected and caused price to move away, which leaves resting liquidity behind it. When price returns and takes that level but fails to continue, it confirms the move was a trap rather than a real breakout, and that trap is what this strategy trades.
How do you set entry, stop, and target with liquidity?
For a buy, you identify a respected low, wait for price to trade below it and confirm the trap, then enter below the low, never above, with the stop placed just below the low that was taken and the target at liquidity resting above respected highs. For a sell, you mirror it: enter above a respected high after the sweep, place the stop just above that high, and target liquidity at respected lows. Execution comes after liquidity is taken, not before, and the last high or low is always covered by the stop.
What timeframes and session does this strategy use?
The strategy is fractal, so the same model applies on any timeframe from the 1-minute to the daily chart. In practice you often use a higher timeframe to map resting liquidity and a lower timeframe to execute the trap. It also relies on a specific session window, such as the New York open. If the setup does not form inside that window, there is no trade, and price action outside the window is ignored.
What instruments work best for the Liquidity Strategy?
Because it is entirely price-action based and uses raw highs, lows, and reactions, the strategy works across futures, forex, and crypto. It fits any market where structure and resting liquidity are readable. The key is judging context, since not every high or low holds liquidity, and a big move that leaves no clear levels with liquidity simply means there is no trade.
Can I backtest the Liquidity Strategy?
Yes. You can test this strategy using TradeZella's backtesting with 11+ years of historical data. Replay your session window bar by bar, mark the respected highs and lows holding resting liquidity, wait for the sweep and the trap to confirm, then enter after liquidity is taken with your stop beyond the level. Every trade logs automatically with entry, exit, position size, and P&L. Add notes, tag mistakes, and review the session the same way you would a live trading day. After 30 to 50 trades you can see your win rate, profit factor, and expectancy on this specific setup before risking real money.
What is TradeZella backtesting?
TradeZella backtesting lets you test a trading strategy against 11+ years of historical market data across forex, futures, stocks, and crypto, down to seconds-level timeframes. You can do it two ways. Replay the market bar by bar and place trades as if you were trading live, with your own timeframes, automatic position sizing, and stops and targets you drag right on the chart, and every trade logs automatically with entry, exit, size, and P&L. Or use automated no-code backtesting: define your strategy rules in plain English and the engine runs them across years of data in seconds, returning every individual trade it took with the exact setup drawn on the chart, so you see why each trade fired instead of just an equity curve. Zella AI then analyzes the results and flags what to fix.