


Built For
Instruments: Futures
Trading Style: Scalping/ Day Trading
Strategy Overview
This strategy is built around the idea that price moves are driven by real buying and selling activity — not just patterns on a chart.
Instead of relying purely on candlesticks, this approach focuses on understanding what is happening beneath the surface. By analyzing order flow, volume distribution, and aggressive participation, the trader identifies where meaningful decisions are taking place in the market.
The core objective is to: Identify high-probability support and resistance zones using objective tools, then wait for confirmation through order flow before executing trades.
This strategy operates across two primary market conditions:
- Balanced markets (range-bound)
- Imbalanced markets (trending)
Each condition has its own model, but both are built on the same foundation, reacting to real-time behavior rather than predicting outcomes.
Core Framework: How Levels Are Built
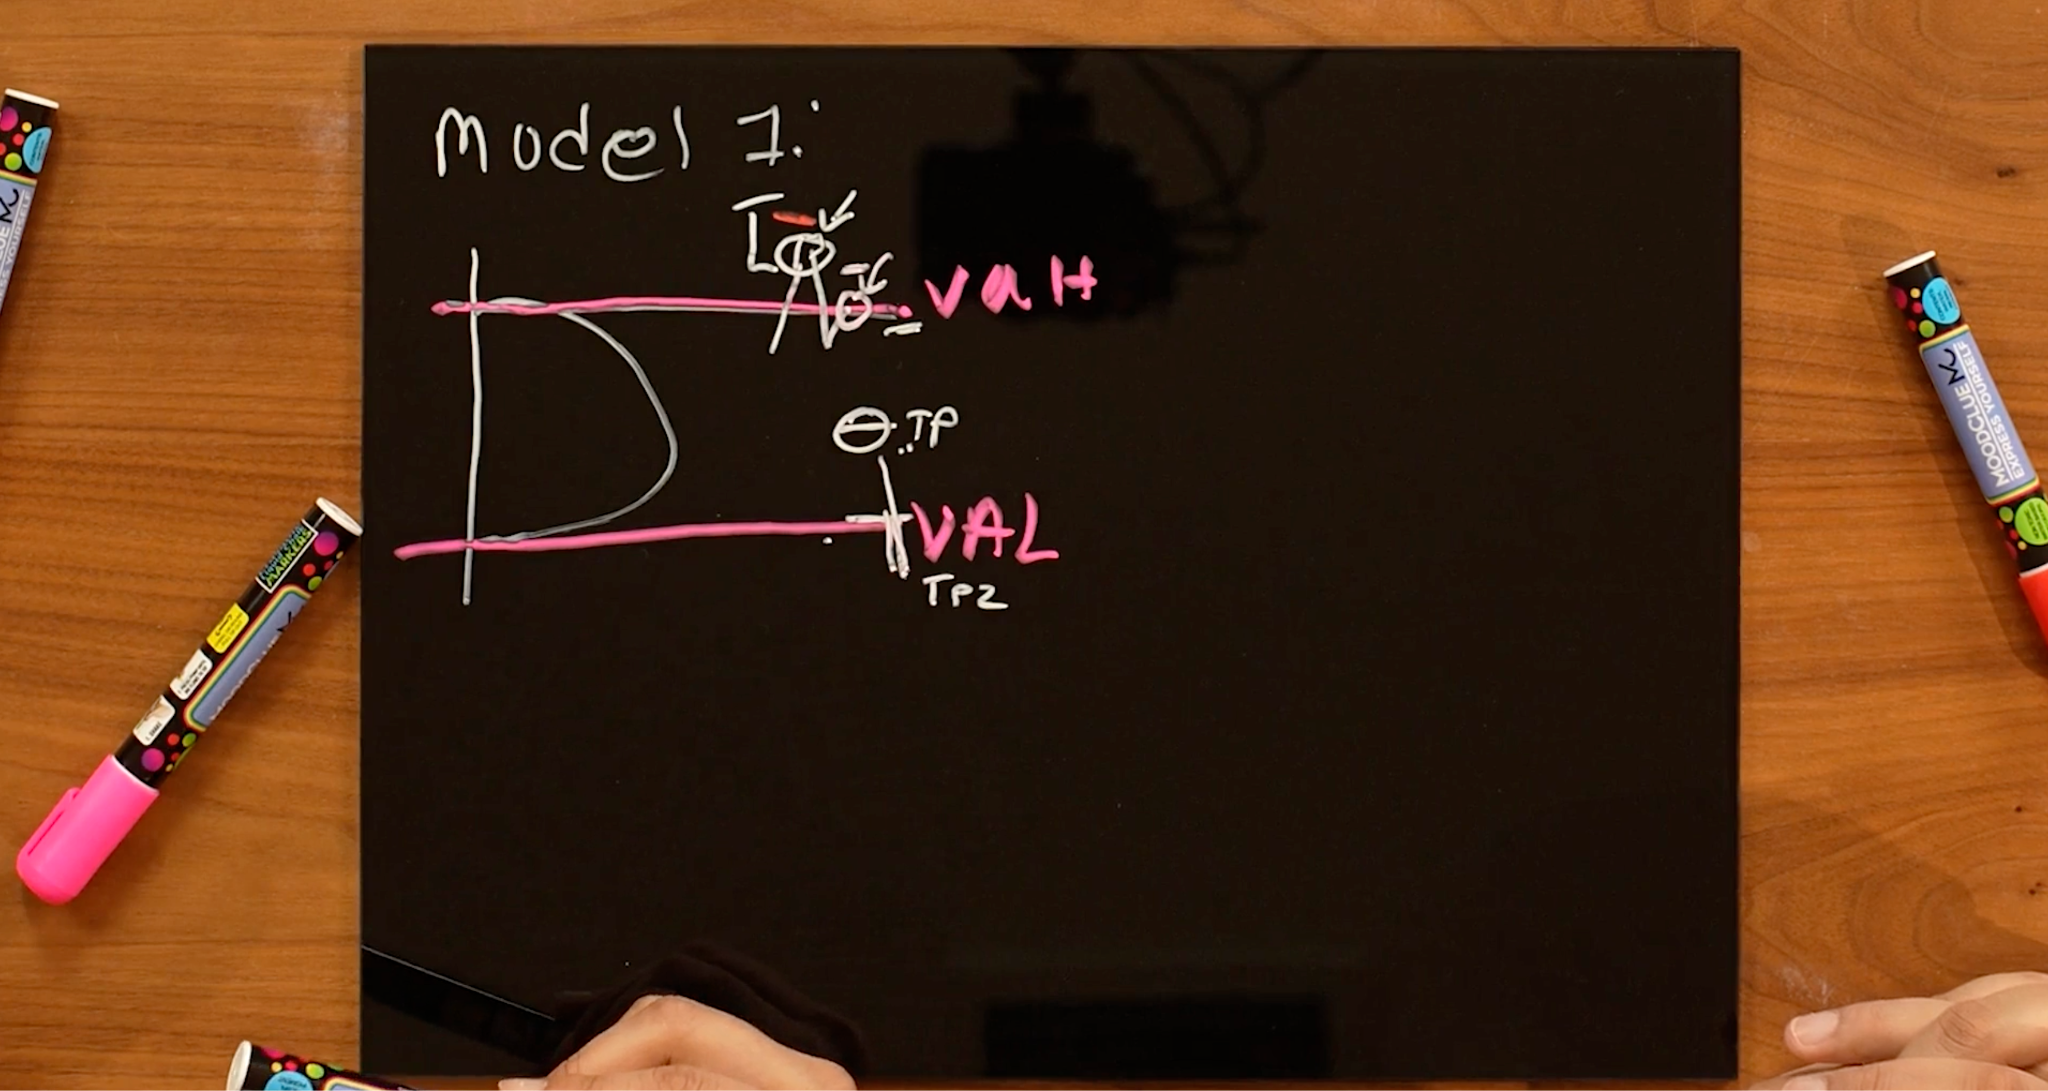
Every trade begins with identifying an Area of Interest (AOI). These are not random levels. They are formed using four key tools. For a level to be valid, at least two of these must align. The more confirmations present, the higher the quality of the setup.
Market-Generated Levels
These are objective price levels created by market structure and commonly watched by participants.
They include:
- Previous Day High and Low
- Overnight High and Low
- Previous Day Close
- Opening Range (32-second ORB)
These levels often act as reaction points because liquidity is concentrated around them.
Volume Profile
Volume profile shows how much trading activity occurred at each price level. This provides insight into where the market finds agreement or disagreement.
Key concepts:
Value Area: This is the range where approximately 70% of volume has traded. When the price is inside this area, the market is considered balanced.
Low Volume Nodes (LVNs): These are areas where the price moved quickly with little trading activity. They represent imbalance and often act as areas for continuation or sharp reactions.
The way price interacts with these areas helps determine whether the market is trending or ranging.
Big Trades
This tool highlights large transactions in the market.
Examples:
- NQ: 75+ lots
- ES: 200+ lots (adjusted based on liquidity)
These large orders reveal where significant participants are active. When big trades appear at key levels, they often signal strong intent or absorption.
Delta Profile
Delta measures aggressive participation:
- Positive delta → buyers hitting the ask
- Negative delta → sellers hitting the bid
This provides insight into who is being aggressive.
Two key behaviors to watch:
Absorption: This occurs when there is heavy buying or selling, but the price does not move. It signals that a passive participant is absorbing orders and defending a level.
Trapped Traders: This happens when traders enter aggressively, but the price reverses against them. These trapped positions often fuel strong moves in the opposite direction.
Areas of Interest (AOIs)
A valid trading zone requires:
- At least 2 confirmations from the framework
- Stronger setups (A+) include 3–4 confirmations
If the price does not return to the AOI, there is no trade. Patience is a key part of the strategy.
Strategy Models
Model 1: Range (Balanced Market)
What This Model Is Built For
This model is used when the market is trading sideways. In this environment, price moves back and forth within a defined range. Buyers and sellers are both active, but neither side has full control.
This creates a balanced condition where price continuously rotates. Many traders lose money in this environment because they attempt to trade breakouts that fail.
This model avoids that by focusing only on reactions at the edges of the range.
How to Identify a Range
A range can be identified when:
- Price stays within a defined area
- Volume is concentrated in the middle (value area)
- Breakouts lack follow-through
- Price frequently reverses at similar levels
Using volume profile, this appears as price trading inside value.
Core Idea
The middle of the range is unpredictable and should be avoided. The edges of the range are where trades are taken. This means focusing only on:
- Value Area High (resistance)
- Value Area Low (support)
How the Setup Forms
Once price reaches an edge, the goal is not to predict a reversal—but to observe behavior. At these levels, traders often become aggressive.
For example:
- Buyers push price above resistance
- Delta becomes strongly positive
- Big trades appear
However, if the price fails to continue higher and instead stalls or reverses, it signals that those buyers are being absorbed. This is where opportunity forms.
Entry Approach
There are two primary entry styles.
Aggressive Entry
This is taken directly at the edge of the range when early signs of rejection appear.
You are looking for:
- Absorption (heavy activity, no movement)
- Strong delta without continuation
- Large trades failing to push price further
Because this entry is early, risk is higher. Position size should be smaller, and stops must be tight.
Confirmation Entry
This is the more conservative approach. Instead of entering immediately, you wait for confirmation. A common pattern is:
- Price breaks above the range
- Buyers chase the breakout
- Price quickly returns inside
This traps breakout traders. Once price re-enters the range and shows rejection, a short entry becomes valid.
Trade Management
Targets are structured because the market is rotating, not trending.
A typical trade is managed as follows:
- First target: midpoint of the range
- Second target: opposite side of value
Once the first target is reached, risk should be reduced immediately by moving the stop to breakeven.
Risk Management
Range markets can reverse quickly.
To manage this:
- Stops are placed just outside the edge
- Winning trades are protected early
- Trades are not allowed to turn negative
If stopped at breakeven, that is acceptable.
Key Mistake to Avoid
The most common mistake is trading the middle of the range.
This area offers:
- Poor risk-to-reward
- No clear direction
- High probability of chop
If the price is not near an edge, there is no trade.
Key Insight
This model is not about predicting reversals. It is about recognizing when one side attempts to move the price and fails. That failure creates the opportunity.
Model 2: Trend (Imbalanced Market)
What This Model Is Built For
This model is used when the market is trending. In this environment, one side (buyers or sellers) is clearly in control, and price is moving in one direction. Unlike range conditions, the goal here is not to fade moves—but to join them.
How to Identify a Trend
A trending market typically shows:
- Strong directional movement
- Value shifting higher (bullish) or lower (bearish)
- Presence of low volume nodes
- Shallow pullbacks
Volume profile plays a key role here. When value continues to shift in one direction, it indicates acceptance at new prices.
Core Idea
Instead of chasing breakouts, this model focuses on entering pullbacks.
The goal is to enter where weaker participants are trapped and stronger participants regain control.
How the Setup Forms
A typical sequence:
- Price moves aggressively in one direction
- A low volume node forms
- Price pulls back into that area
- Opposite side becomes aggressive
- Price fails to continue against the trend. This failure signals that the trend is still intact.

Entry Approach
Aggressive Entry
Enter within the pullback zone when:
- Opposing side shows aggression
- Price does not continue
- Absorption is visible
Stops are tight, as invalidation should happen quickly.
Confirmation Entry
Wait for:
- Reclaim of structure
- Higher low (bullish) or lower high (bearish)
- Shift back in trend direction
This provides more confirmation but may result in a slightly worse entry.
Trade Management
In trending markets, targets are less fixed.
Typical approach:
- Take partial profits at previous highs/lows
- Hold the remaining position for continuation
- Trail based on structure
The goal is to participate in the trend while securing profits along the way.
Risk Management
- Use tight stops on entries
- Add to winning positions (not losing ones)
- Move to breakeven after partial profit
A key principle is to scale into strength, not weakness.
Key Insight
Strong trends are often fueled by trapped traders.
For example:
- Sellers shorting an uptrend get squeezed
- Their exits add buying pressure
This creates momentum and continuation.
Execution Rules
Do Not Anticipate: All trades must be based on confirmation. React to what is happening not what you think will happen.
Minimum Confluence: At least two factors must align to form a valid AOI.
Patience: If the price does not return to your level, there is no trade.
Trade Selection: Limit trading to high-quality setups. Typically: 2 to 3 trades per day
Scalping Mindset: This strategy focuses on:
- Quick execution
- Short holding periods
- Consistent gains
Risk Control
- Define risk before entering
- Never allow winning trades to turn negative
- Accept losses quickly
Avoid Momentum Entries: Do not trade directly into strong momentum. Wait for:
- Slowdown
- Reaction
- Confirmation
Trade Breakdown
Trade Example (Model 2 – Trend)
The setup formed shortly after the open when the price made a strong, aggressive move down below the overnight low. This move was not a normal breakdown; it was driven by liquidation, with stops getting triggered and sellers entering aggressively.
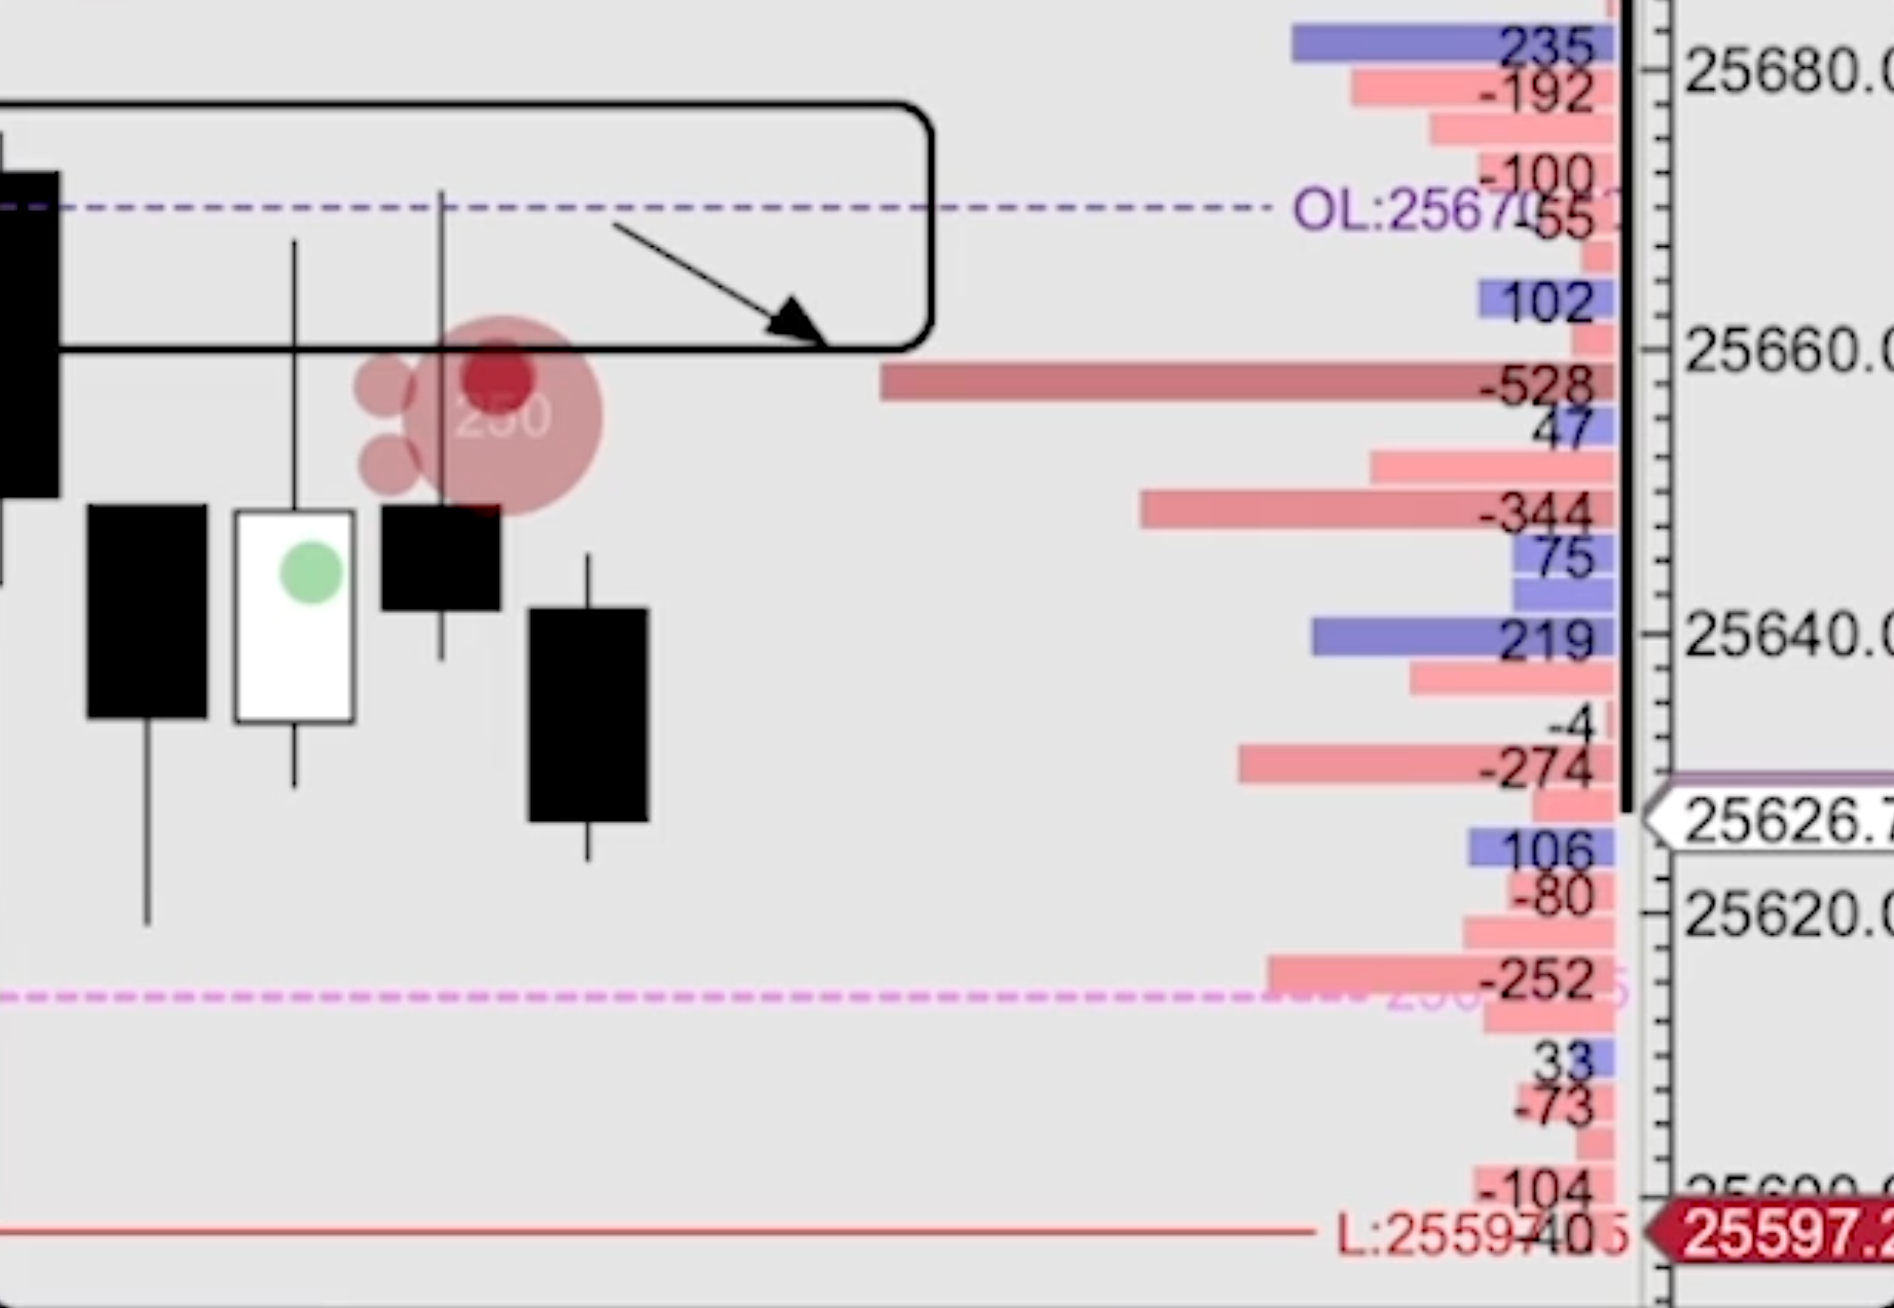
As the price pushed lower, it left behind a low-volume node, showing that the move happened quickly with little resistance. At the same time, a large trade (around 300 lots) printed near the breakdown level. This created a clear area of interest, combining a market level, imbalance, and strong order flow activity.
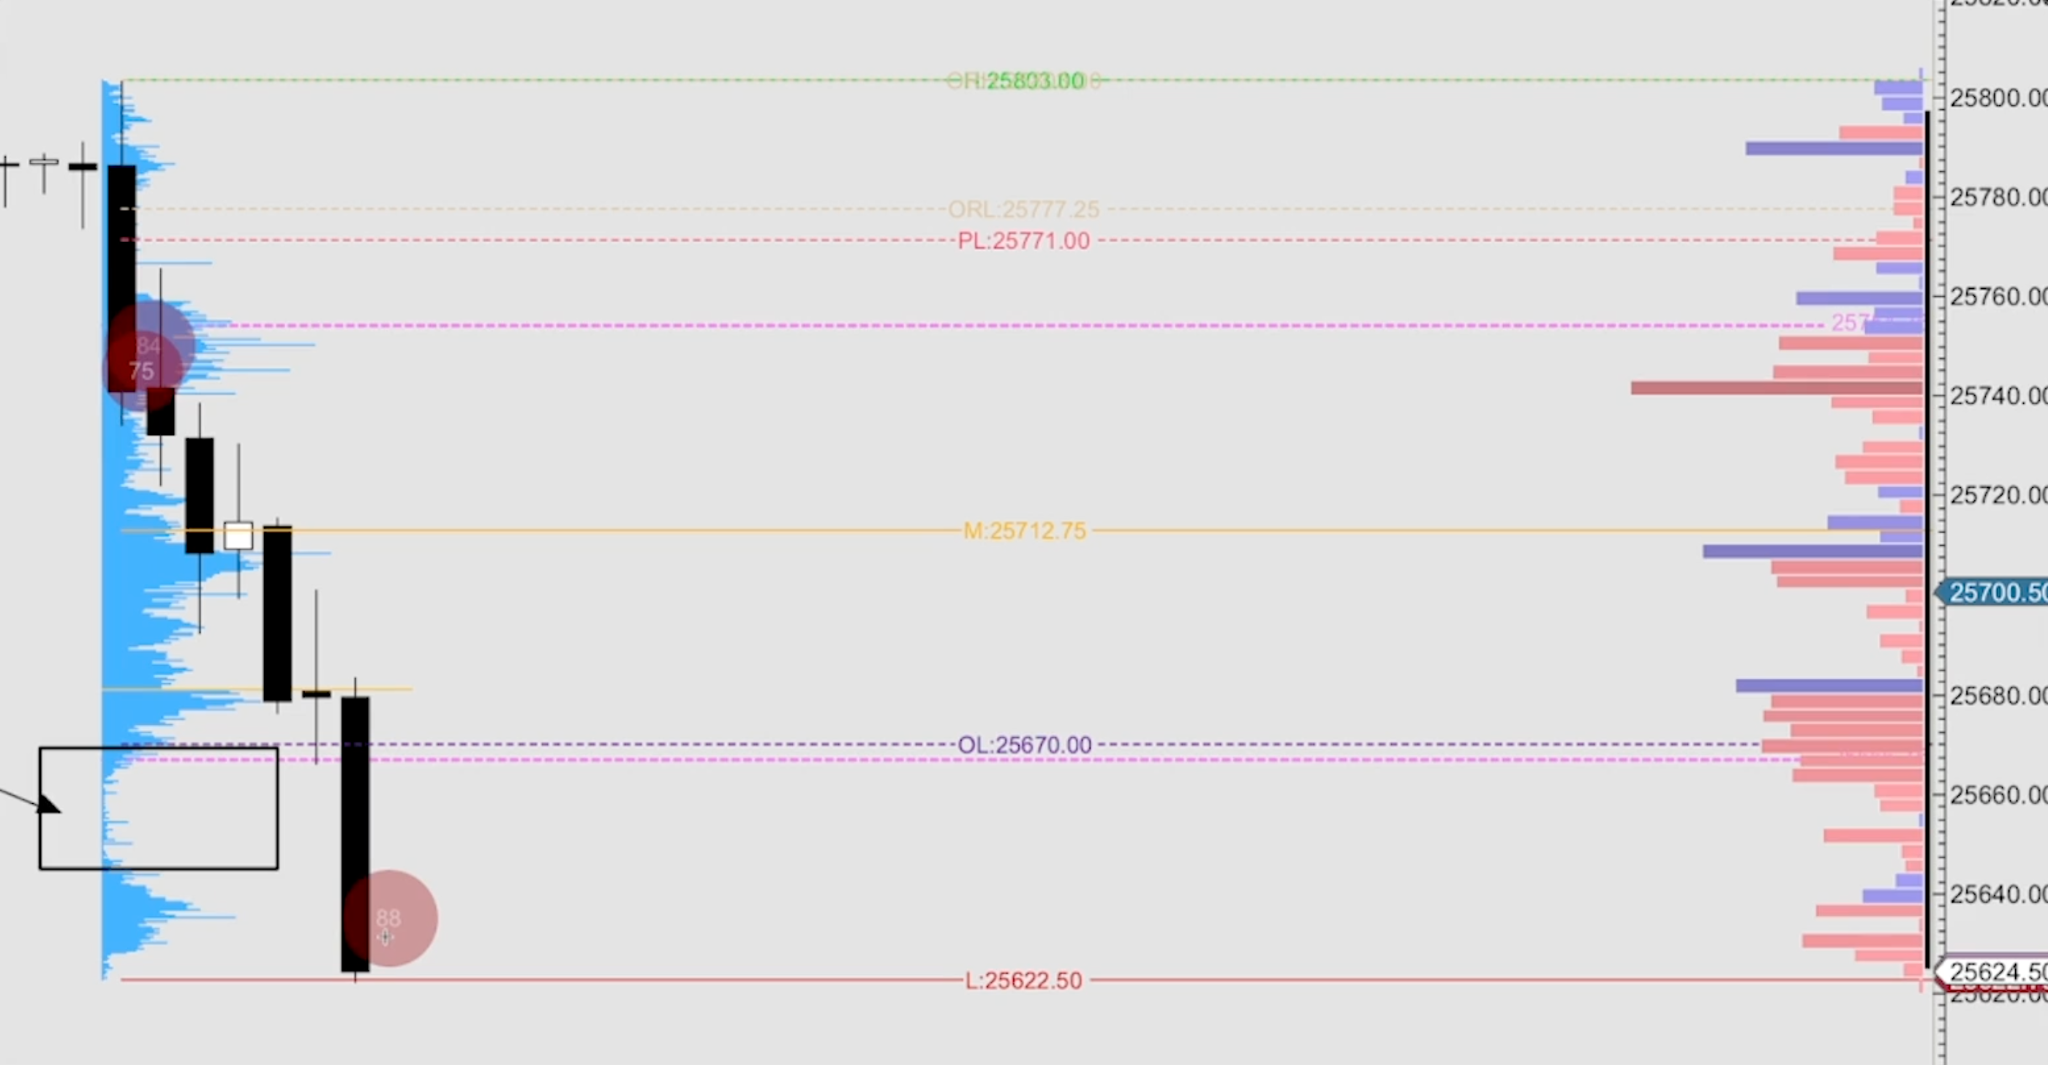
Instead of chasing the move, the approach was to wait for the price to pull back into that area.
When the price retraced back into the zone, the reaction confirmed the setup. There was continued negative delta, showing aggressive selling, along with more large trades hitting the bid. Despite the pullback, buyers were unable to push price higher, indicating that sellers were still in control.

With confirmation in place, the short was taken just below the level, with a stop placed just above the overnight low.
After entry, the price moved quickly lower, breaking the structure and continuing in the direction of the trend. The move was fast and clean, which is typical when trapped participants and aggressive sellers align. The trade was managed by targeting nearby structure and value levels, capturing a quick move while keeping risk tight.
The key idea behind the trade was simple: Identify an imbalance, wait for the pullback, confirm through order flow, and execute with defined risk.
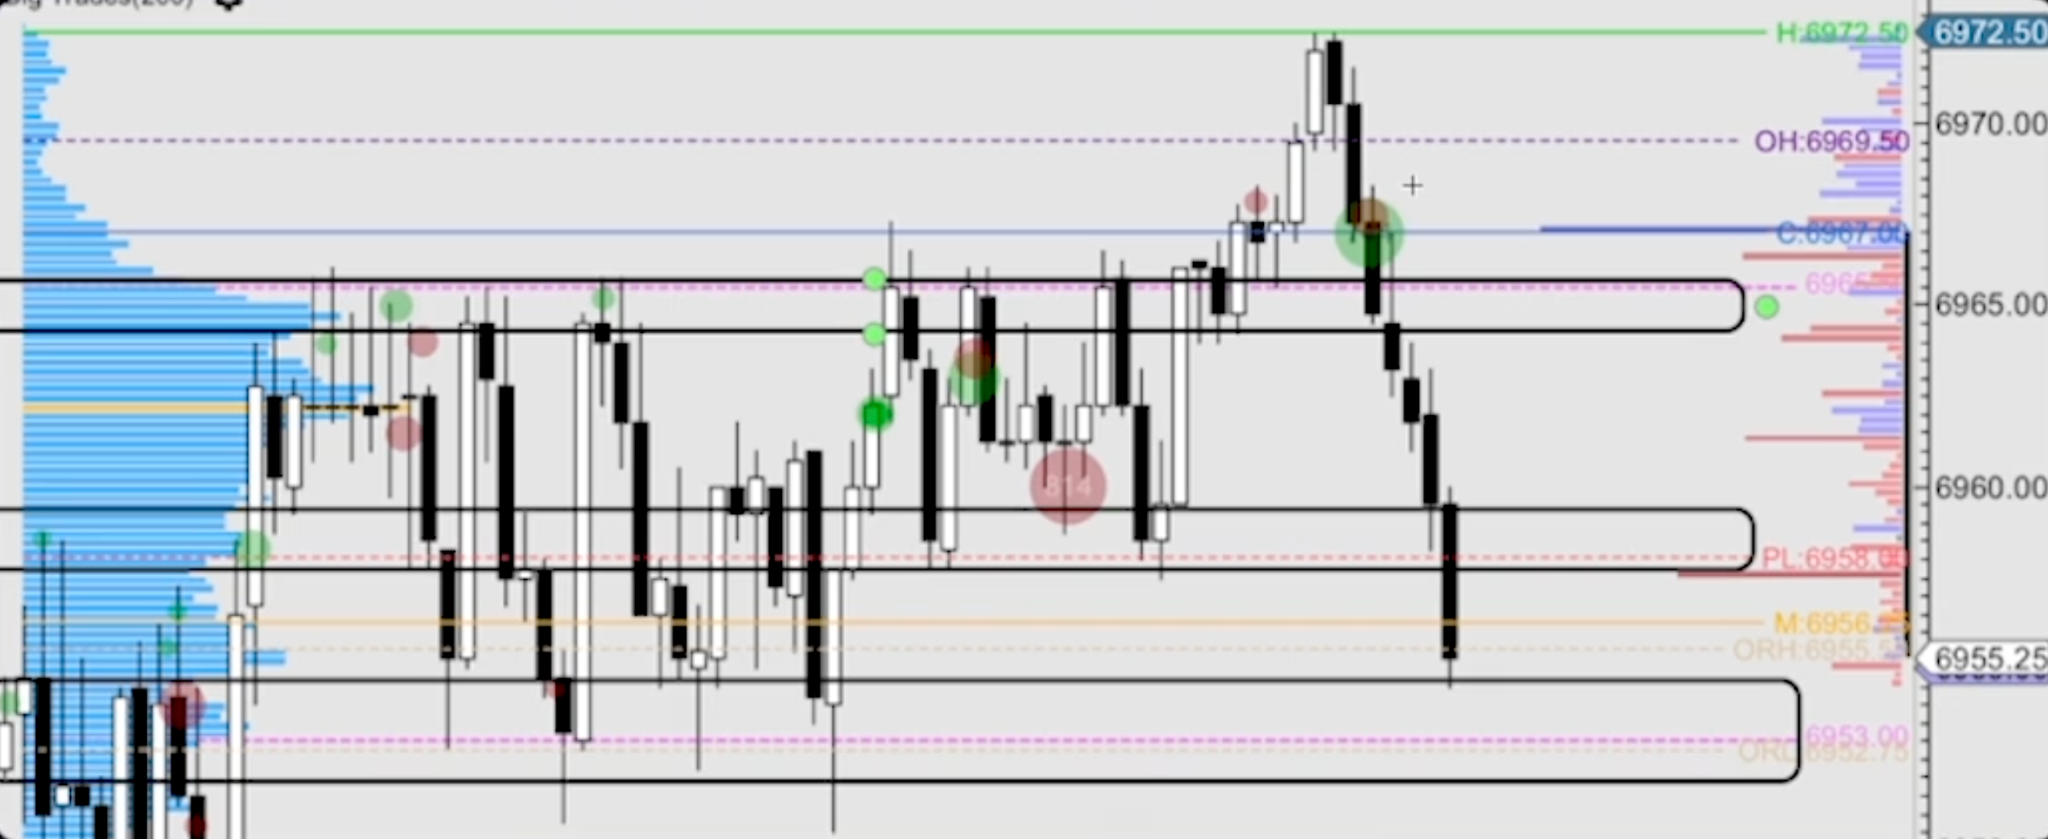
Trade Example (Model 1 – Range, ES)
This trade took place on ES during a range-bound market.
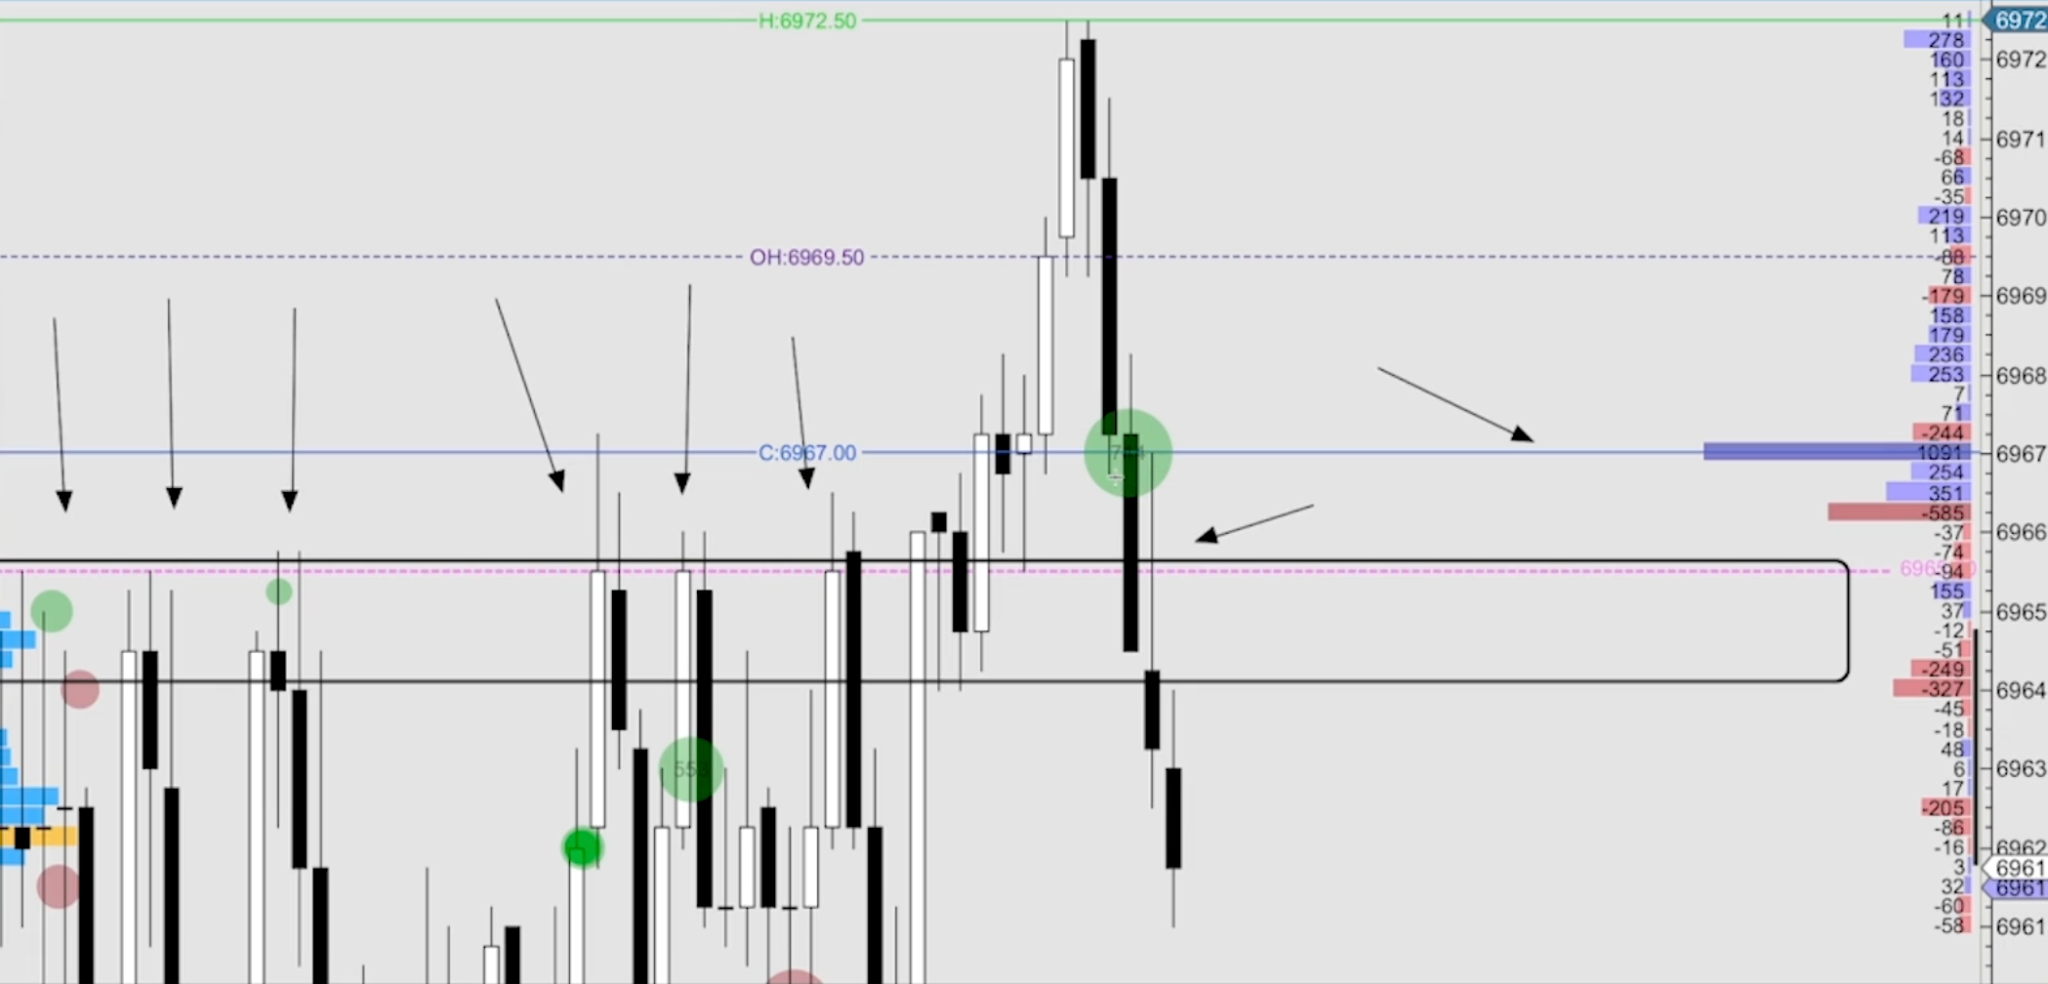
The key area came from observing activity near the highs. On the DOM, there was a large build-up of positive delta, with values around 800, 1800, and even 1900+, showing strong aggressive buying. However, despite all this buying, the price was not moving higher.
This was the first important signal absorption. A passive seller was sitting at that level, absorbing all the aggressive buyers.

At the same time, this was happening near the highs of the range and around the overnight high, which made it a strong area of interest.
Price then pushed slightly higher and swept the overnight high, but the move lacked continuation. Instead of squeezing higher, the price quickly dropped back below the level. This created a look above and fail, trapping the buyers who entered the breakout.
That failure was the confirmation.
The entry was taken short around the level (around the 65 area he referenced), as price moved back below it. The stop was placed just above the highs, around the previous day close / rejection area.
After entry, the price moved down quickly. The first target was the midpoint of the range, followed by the bottom of the range.
The move was clean and fast, driven by trapped buyers being forced out and sellers taking control.
Key Idea
Even though there was heavy buying (positive delta), the price was not moving higher. That imbalance showed absorption, and once buyers were trapped on the breakout, it created the move back down through the range.
How to Backtest This Order Flow Strategy
You can test this Order Flow strategy before risking real money using TradeZella's backtesting. Load 11+ years of historical data, set up your timeframes the way you trade live, and replay the session bar by bar. When the setup develops, place your trade with automatic position sizing and drag your stop and target directly on the chart. Every backtested trade gets logged automatically with your entry, exit, position size, and P&L. Add notes on what you saw, tag mistakes, and review the session the same way you would a live trading day. After 30 to 50 trades, you can see your win rate, profit factor, and expectancy on this specific setup, giving you a real picture of how it is likely to perform in live market conditions before you risk a dollar.
When you start trading live, import your live trades into TradeZella, the AI trading journal that does the journaling for you. Your backtest results and live results live in the same platform TradeZella, so you always know how the strategy performs in testing vs how it performs with real money, without switching between tools or maintaining separate spreadsheets.
TradeZella is also introducing automated no-code backtesting, where you define your rules and run the backtest, and then it shows you how the strategy would have performed over years of historical data without you needing to step through a single chart.
Start Backtesting This Strategy Using TradeZella
Frequently Asked Questions
What is order flow trading?
Order flow trading uses real-time buying and selling data to identify where significant market participants are active. It analyzes delta (aggressive buyers vs sellers), absorption (heavy activity without price movement), volume profile (where trading activity concentrates), and large trades to find high-probability entries at key support and resistance levels.
What is the difference between the range model and the trend model?
The range model trades reactions at the edges of a balanced market, focusing on Value Area High and Value Area Low where breakout traders get trapped. The trend model trades pullbacks into low volume nodes during directional moves, entering when the opposing side fails to continue against the trend. Both models require at least two confirmations before taking a trade.
What is absorption in order flow?
Absorption happens when there is heavy buying or selling activity but the price does not move. It signals that a passive participant is defending a level by absorbing all the aggressive orders. When absorption appears at a key level with other confirmations, it often precedes a reversal or strong rejection.
How many trades should I take per day with this Order Flow strategy?
Yush recommends limiting to 2 to 3 high-quality trades per day. This is a scalping strategy focused on quick execution and short holding periods. The key is waiting for setups where at least two confirmations align at an Area of Interest rather than forcing trades in the middle of ranges or directly into momentum.
What instruments work best for order flow trading?
Futures contracts with deep liquidity and transparent order book data. Yush trades NQ and ES.
Can I backtest this order flow strategy?
Yes. You can test this strategy using TradeZella's backtesting with 11+ years of historical futures data. Replay sessions bar by bar, place trades when the setup develops, and every trade logs automatically with entry, exit, position size, and P&L. Add notes, tag mistakes, and review the session the same way you would a live trading day. After 30 to 50 trades you can see your win rate, profit factor, and expectancy on this specific setup before risking real money.
What is TradeZella backtesting?
TradeZella backtesting lets you replay 11+ years of historical market data across forex, futures, stocks, and crypto and place trades as if you were trading live. Set up your timeframes the way you trade, use automatic position sizing, drag your stop and target directly on the chart, and every trade gets logged automatically with your entry, exit, position size, and P&L. TradeZella is also introducing automated no-code backtesting, where you define your strategy rules in plain English and the engine runs them across years of historical data, showing every individual trade executed with the results without you needing to do anything.