Automated Backtesting: Write Rules in Plain English, Get Results in Minutes
Automated Backtesting: Write Rules in Plain English, Get Results in Minutes
Automated backtesting lets you write trading rules in plain English, run them across years of historical data, and see every individual trade. This guide explains how automated backtesting works, what to look for in a platform, and how TradeZella is making strategy testing accessible to every trader.
class SampleComponent extends React.Component {
  // using the experimental public class field syntax below. We can also attach
  // the contextType to the current class
  static contextType = ColorContext;
  render() {
    return <Button color={this.color} />
  }
}
Last Updated: July 06, 2026
Automated backtesting is a method of testing trading strategies by writing rules in plain English and running them across years of historical market data. Unlike manual backtesting, which requires scrolling through charts bar by bar, automated backtesting executes your strategy rules against historical price data and generates results in minutes, with every individual trade showing full entry, exit, and performance metrics. TradeZella's automated backtesting lets you define a strategy without writing code, test it on stocks, forex, futures, and crypto, and use Zella AI to analyze the results for patterns human review would miss.
Most traders know they should backtest. Very few actually do it. The barrier is never motivation. It is time.
Manual backtesting takes 40 to 60 hours to generate 100 trades on a single instrument. That is two full work weeks of scrolling through charts, marking entries, logging exits, and calculating metrics by hand. Writing a coded backtest in Pine Script or Python takes weeks of learning syntax before you even test a strategy. Most retail traders give up before they finish either path.
Automated backtesting eliminates both barriers. You write your rules the same way you would explain your strategy to another trader at a desk. The engine runs those rules across years of historical data. Every individual trade appears with full entry, exit, and performance details. The whole process takes minutes, not weeks.
This is exactly what TradeZella's automated backtesting does. This guide explains everything: how automated backtesting works, what makes plain English rules different from coded scripts, how pre-built templates accelerate testing, and how Zella AI turns raw results into actionable insights. Whether you are building a trading system from scratch or validating a strategy you have traded for years, automated backtesting changes the math on what is possible.
TL;DR
TradeZella's automated backtesting that lets you write trading rules in plain English and test them across years of data in minutes. No coding. Every individual trade is visible. Zella AI analyzes the results. Pre-built templates for ICT, ORB, trend following, and mean reversion get you started immediately.
What Is Automated Backtesting?
Automated backtesting is the process of defining trading rules and having software execute those rules against historical price data to generate a complete set of simulated trades. The trader defines entry conditions, exit conditions, and risk parameters. The software handles everything else: scanning years of data, identifying every occurrence where the conditions are met, executing the simulated trade, and recording the result.
This is where TradeZella's automated backtesting stands out. You write your rules in plain English instead of code, and TradeZella runs them across more than 11 years of real historical data on stocks, forex, futures, and crypto, down to seconds-level timeframes. Every trade in the log opens with the exact setup drawn on the chart, the Fair Value Gap, the liquidity sweep, or the breaker block and its retest, so you can see why each trade was taken, not just the outcome. Zella AI then reviews the full session and flags what to fix, such as a weak time of day or a losing day of the week.
How Automated Backtesting Differs From Other Testing Methods
Traders have several ways to test strategies. Automated backtesting is one of them, and understanding where it fits prevents confusion.
Manual replay backtesting uses a bar-by-bar replay tool. You scroll forward one candle at a time, decide when to enter, place your order, and manage the trade in simulated real time. This is excellent for practicing execution, but generating 100 trades takes 20 to 40 hours. The sample size is limited by your patience.
Coded backtesting uses programming languages like Pine Script (TradingView), Python (QuantConnect, Backtrader), or MQL5 (MetaTrader). You write conditional logic in code, run it against data, and get results. The learning curve is steep: most traders spend weeks learning syntax before testing their first strategy, and debugging errors can take as long as writing the original script.
Paper trading tests a strategy in real time with no real money. This is the slowest method. Generating 100 trades at 2 to 3 trades per day takes 1 to 2 months. There is no way to compress time.
Automated backtesting sits between coded backtesting and manual replay. You get the speed and sample size of coded testing without the programming requirement. You describe your strategy in plain English. The platform translates your description into execution logic, runs it against historical data, and returns every trade. The speed difference is staggering: what takes 40 hours manually produces results in minutes with automation.
The key innovation is the plain English input. Instead of learning a programming language, you describe your strategy the way you would explain it to another trader sitting next to you. For a deeper look at the full spectrum of backtesting trading strategies, that guide covers the conceptual foundations.
How Does Plain English Backtesting Work?
Plain English backtesting works by translating human-readable strategy descriptions into machine-executable logic. You type your strategy the way you think about it. The platform translates your conditions into executable rules and runs the backtest automatically.
Here is how the automated backtesting works inside TradeZella:
Step 1: Define Your Entry Conditions
You describe when to enter a trade. Examples of what you can write:
"Buy when the 9 EMA crosses above the 21 EMA and RSI is below 30"
"Enter long when price breaks above the opening range high within the first 30 minutes"
"Short when price sweeps a prior swing high and creates a Fair Value Gap on the 5-minute chart"
These are not simplified examples for marketing. This is the actual input format. You type conditions the way you think about them, and the engine processes them.
Step 2: Define Your Exit Conditions
You describe when to exit. Options include:
"Stop loss at 1.5 ATR below entry, target at 2:1 risk-reward"
"Trail stop at the low of the previous candle after reaching 1R profit"
"Exit at the session close if the trade has not hit either target or stop"
Fixed targets, trailing stops, time-based exits, and conditional exits all work. You can combine them. For example: "Target at 3R, trailing stop at 1R after reaching 2R, hard exit at 3:45 PM if still open."
Step 3: Select Your Instrument and Date Range
Choose what to test and how far back. TradeZella offers 11+ years of historical data across futures, stocks, and forex. You select one instrument per backtest, so you can test your strategy on ES, NQ, CL, GC, MES, MNQ, and more. Run separate tests on different instruments to see where your strategy works and where it does not.
Step 4: Run the Backtest
Click run. The engine scans every bar of data in the selected range, evaluates your entry conditions on each bar, executes simulated trades when conditions are met, and records every outcome. Results appear in minutes, depending on the date range and complexity of your rules.
TradeZella Automated Backtesting
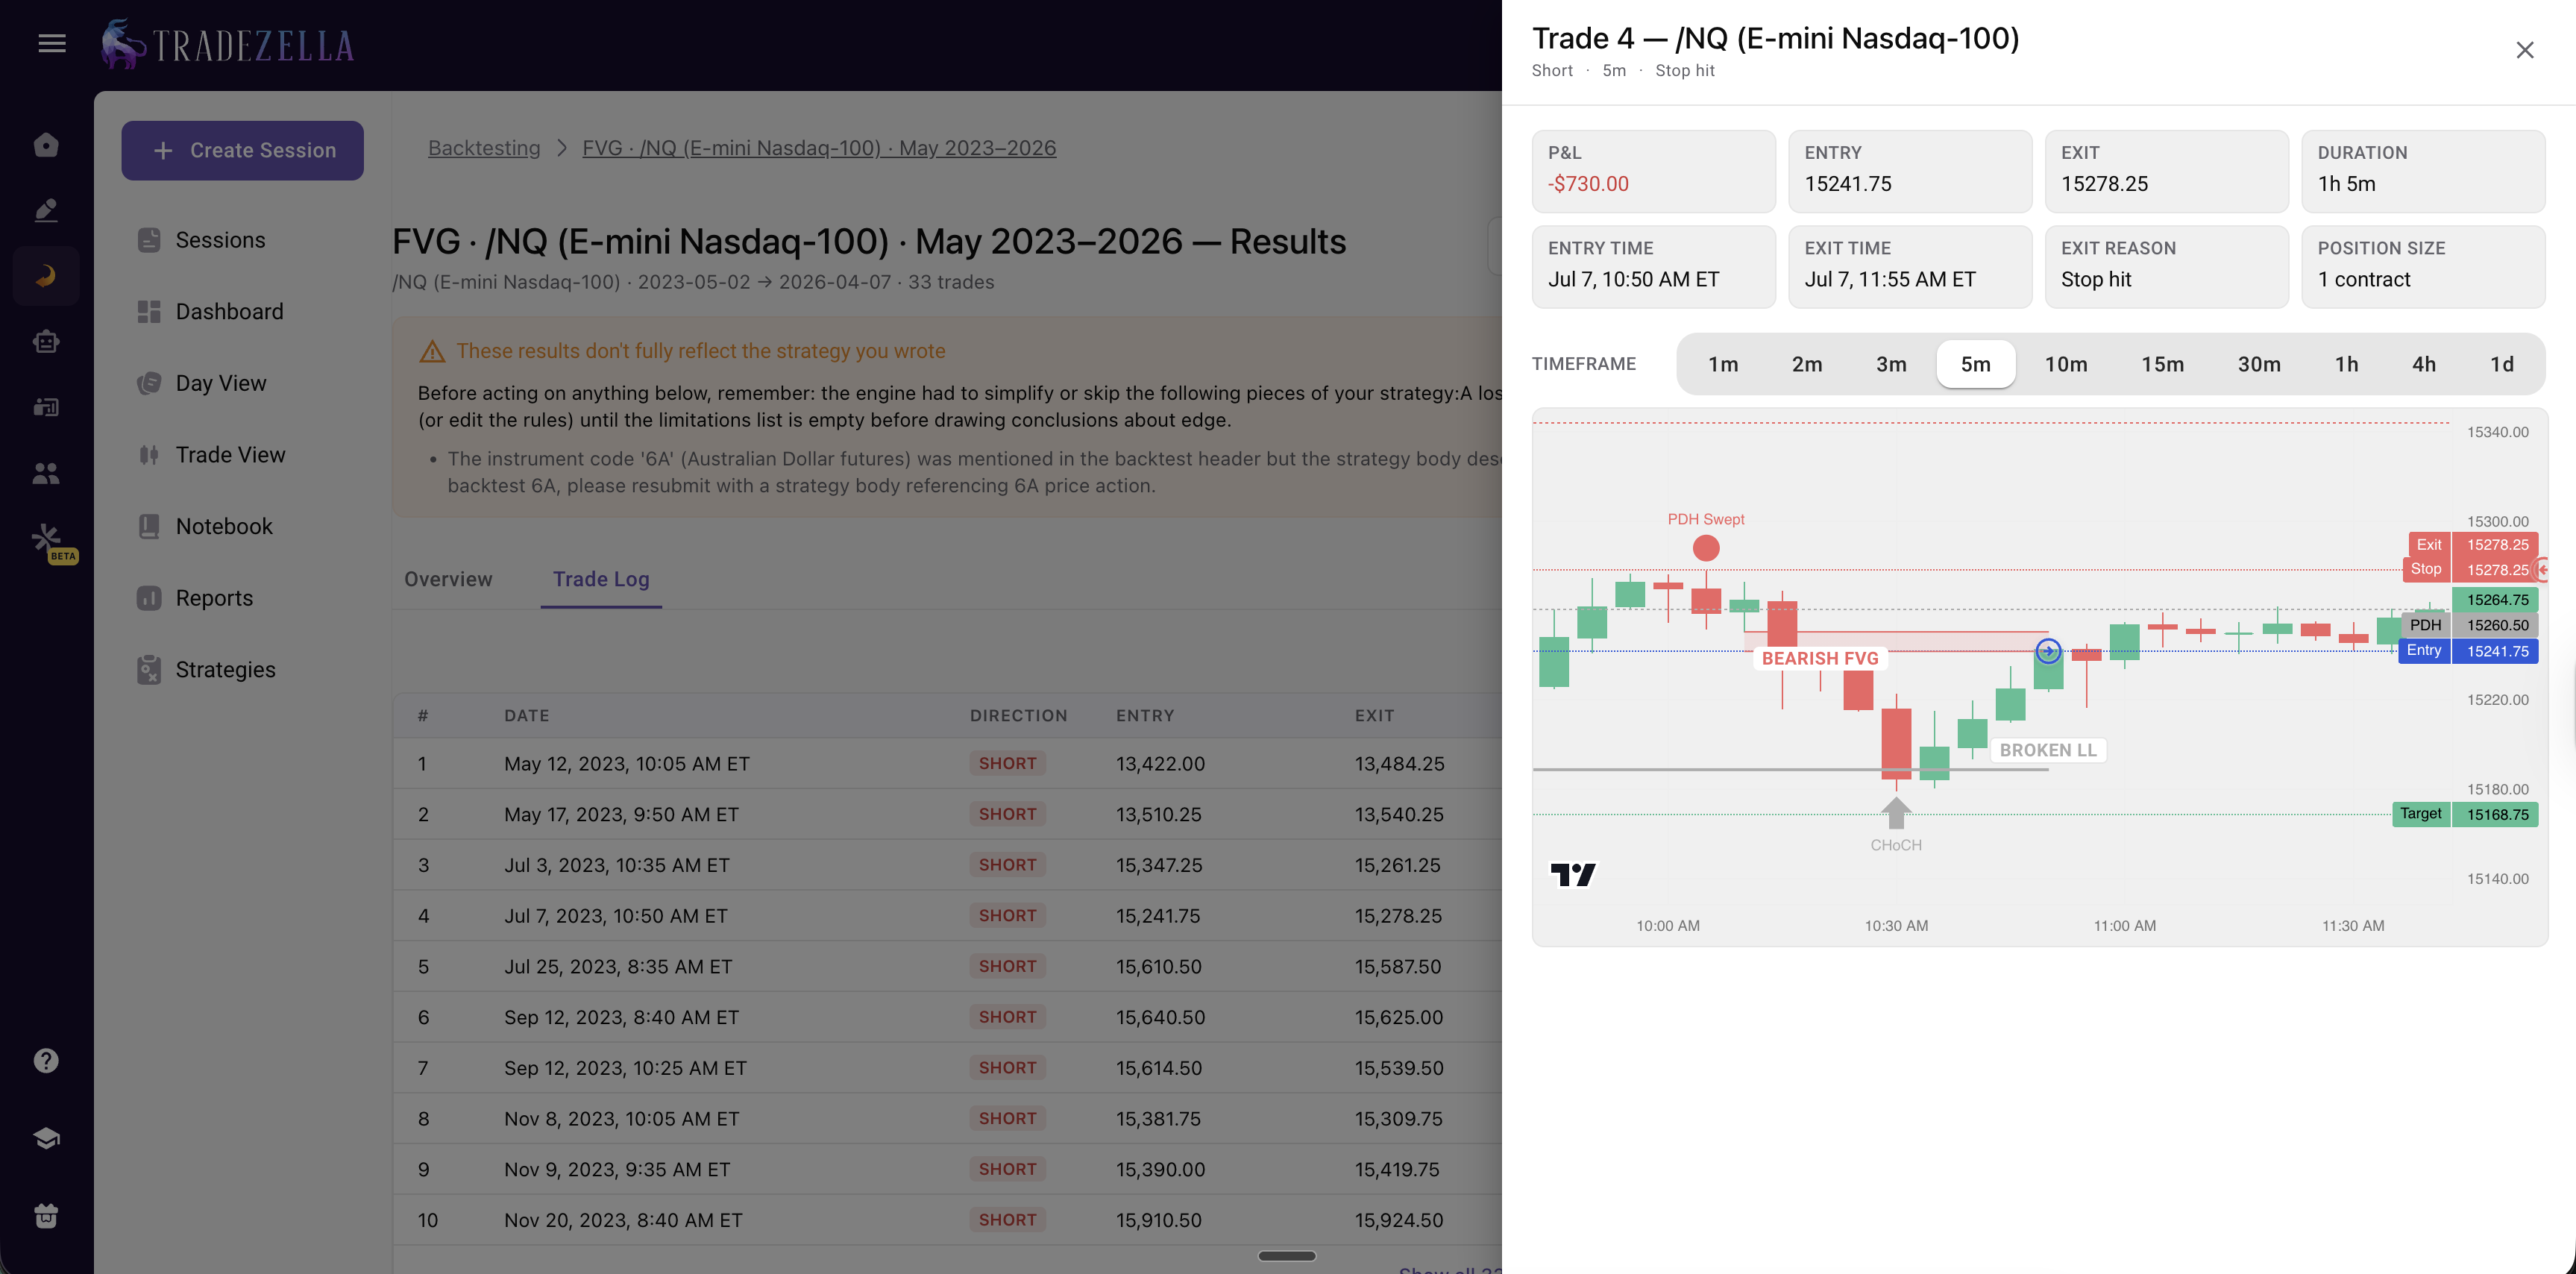
Step 5: Review Every Individual Trade
This is where automated backtesting separates from coded platforms that only show summary statistics. Every single trade is visible: entry price, exit price, entry time, exit time, trade duration, dollar profit or loss, and R-multiple result. You can click into any trade and see the chart at the moment of entry and exit.
This matters because summary statistics hide problems. A strategy with a 1.5 profit factor might generate that number from 90 percent of trades being small winners and 10 percent being catastrophic losers. The individual trade log reveals these patterns. The summary alone does not.
TradeZella Automated Backtesting Per Trade Analysis
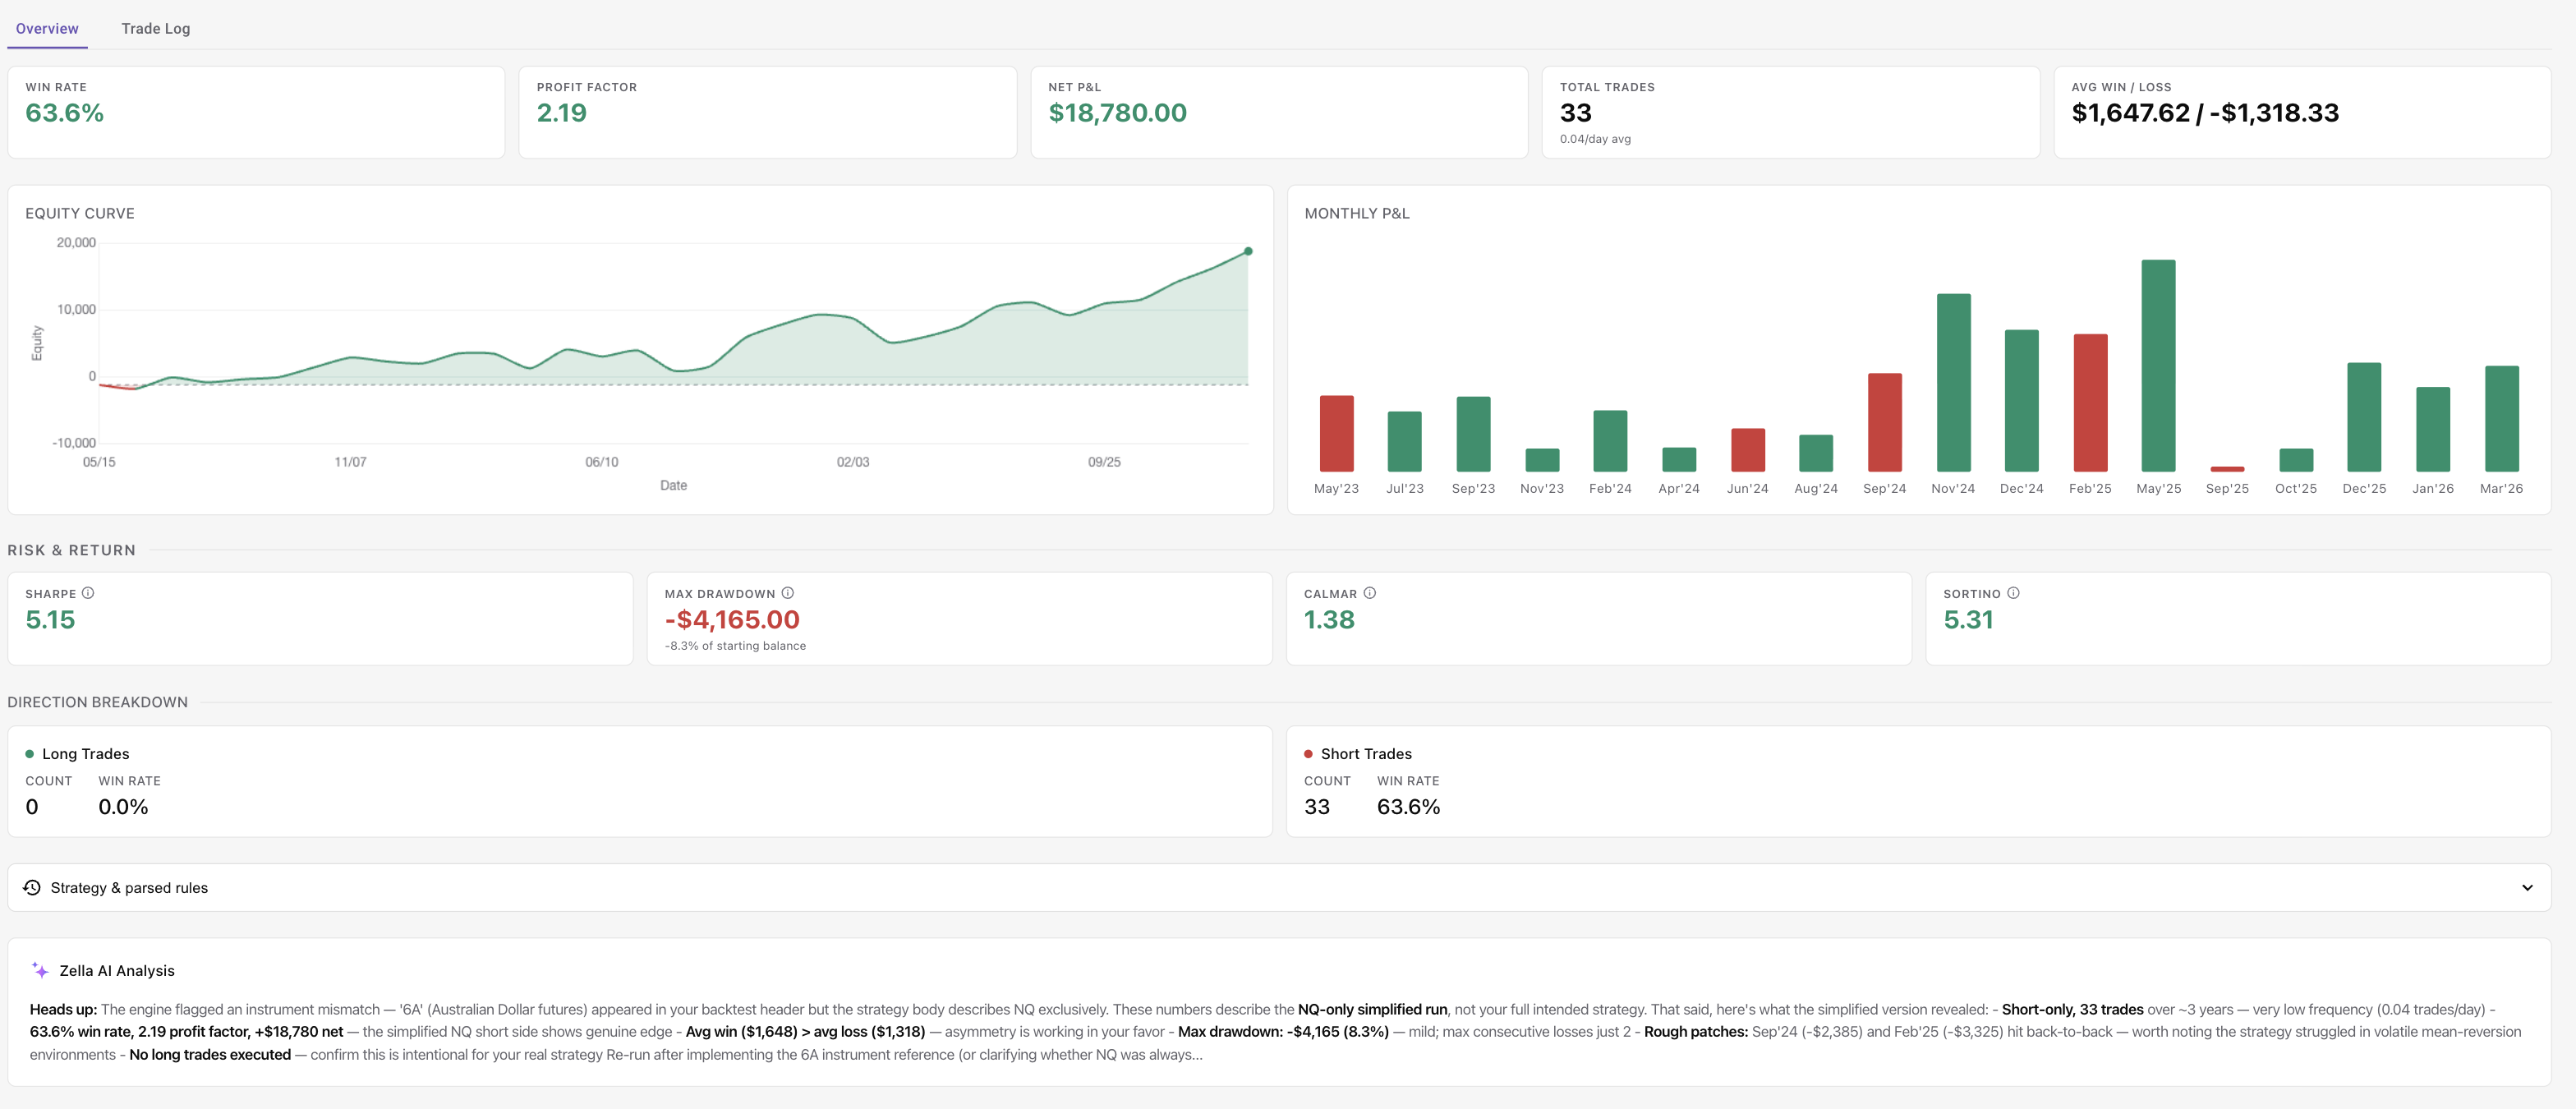
Step 6: Analyze Aggregate Metrics
After reviewing individual trades, check the aggregate performance:
Win rate: What percentage of trades were profitable
Profit factor: Gross profit divided by gross loss (above 1.3 is a reasonable benchmark for live viability)
Expectancy: Average R-multiple per trade (positive means the strategy makes money over time)
Maximum drawdown: The largest peak-to-trough decline (measured in R-multiples and dollars)
Average hold time: How long trades stay open
Consecutive losses: The longest losing streak in the datase
TradeZella Automated Backtesting Stats
How Does Zella AI Analyze Backtesting Results?
After an automated backtest completes, Zella AI reviews the full dataset of individual trades and identifies patterns, strengths, and areas for improvement that summary statistics alone cannot reveal. Zella AI is TradeZella's built-in AI trading partner. It does not just present numbers. It interprets them and tells you what to do about them.
Here is what Zella AI looks for in a completed backtest:
Time-of-Day Patterns
Your strategy might perform 2.3 times better during the first 90 minutes of the session than during the afternoon. Zella AI surfaces this automatically. A trader looking at a 1.5 profit factor might think the strategy is uniformly profitable. Zella AI shows that the morning session produces a 2.1 profit factor while the afternoon session produces a 0.8. The fix is obvious: stop trading this strategy after 11:00 AM. The aggregate number hides the real edge.
Day-of-Week Weakness
Zella AI might flag that your win rate drops to 31 percent on Fridays while averaging 52 percent Monday through Thursday. On a $50,000 account with $500 risk per trade, trading Fridays with this strategy costs approximately $1,900 per year in losses that a Monday-through-Thursday filter would eliminate entirely.
Pattern and Weakness Detection
Zella AI analyzes the results and identifies patterns, strengths, and areas for improvement. It connects the raw numbers to actionable changes, highlighting where specific conditions produced better or worse results so you know what to adjust in your next iteration.
Instrument-Specific Insights
When you test the same strategy on different instruments separately, Zella AI analyzes each result set individually. You might discover your strategy is profitable on ES (PF 1.67) and NQ (PF 1.54) but negative on YM (PF 0.83). That insight saves you from trading a losing strategy on YM while focusing on ES and NQ where the edge exists.
Risk Assessment
Zella AI flags concentration risk and drawdown patterns. "Maximum drawdown was 12R, occurring over 3 consecutive weeks in March 2024. This coincided with a volatility contraction where your breakout strategy generated false signals at 2.4 times the normal rate." Knowing when your strategy breaks, not just that it broke, lets you add a volatility filter or reduce size during similar conditions in the future.
This is why automated backtesting with AI analysis is fundamentally different from a spreadsheet of numbers. The AI connects the data to actionable changes. For a deeper look at how AI trading agents work across your entire trading workflow, that guide covers the full scope. And to understand how TradeZella functions as a complete AI trading tool, that article walks through every component. Zella AI brings the same analytical depth to your trade review process on live trades after you graduate from backtesting to live trading.
What Can You Test With Automated Backtesting?
Automated backtesting supports any strategy that can be defined with objective rules. The scope is broader than most traders expect because the plain English input handles complex conditions that would require dozens of lines of code in a scripted backtest.
Entry Strategies
Breakouts: Opening range breaks, prior-day high/low breaks, consolidation range breaks
Pullbacks: Retracements to a moving average, pullbacks to VWAP, pullbacks into a Fair Value Gap
Mean reversion: RSI extremes, Bollinger Band touches, standard deviation moves from VWAP
Momentum: EMA crossovers, MACD signal crosses, price above/below VWAP with volume confirmation
Exit Strategies
Fixed R-multiples: Target at 2R, 3R, or any custom multiple. For context on how risk-reward ratios affect profitability at different win rates, that guide has the math.
Trailing stops: Trail at the low of the previous candle, trail at a fixed ATR distance, trail at a percentage from the high
Time-based exits: Close at 3:45 PM if still open, exit after 30 minutes if the trade has not reached 1R
Conditional exits: Exit if RSI reaches 70, exit if price reclaims VWAP against your position
Filter Conditions
Filters are where automated backtesting becomes powerful. The setup includes two key filter types:
Trading days: Select which days of the week to include. Exclude Mondays. Only trade Tuesday through Thursday. The day-of-week filter lets you isolate your best trading days.
Trading sessions: Select which sessions to trade. New York, London, or other sessions depending on the instrument. Only trade the first 2 hours. Exclude the last 30 minutes.
You can also build additional filter logic into your plain English strategy rules. For example, you can write "only take long entries when price is above the 50 EMA" or "only trade when ATR is above the 20-day average" as part of your strategy description. This gives you the flexibility to layer conditions while keeping the filter controls focused on days and sessions.
Position Sizing Rules
Test different position sizing approaches and see how they affect both returns and drawdown:
Fixed contracts: Trade a set number of contracts per trade regardless of account size
Risk $: $500 risk per trade, a fixed dollar amount per trade
Risk % of running balance: Risk a percentage of your current balance per trade, which compounds as the account grows
Testing Across Different Instruments
Test your strategy on ES, NQ, CL, GC, MES, MNQ, stocks, forex pairs, and more. Run separate backtests on each instrument to see whether your edge is instrument-specific or broadly applicable. A strategy that works on ES and NQ but fails on CL suggests the edge depends on index behavior, not a universal market principle.
Scenario Testing
Scenario testing is where automated backtesting changes how you think about strategy development. Instead of testing one configuration and declaring victory, you test variations:
What if you only traded the first 2 hours? Run it. Compare.
What if you excluded Mondays and Fridays? Run it. Compare.
What if you used a 3R target instead of 2R? Run it. Compare.
What if you added a volume filter? Run it. Compare.
Each scenario takes minutes. In a single afternoon, you can test 10 to 15 variations of the same strategy and identify the configuration with the highest expectancy and the lowest drawdown. This is how you find your trading edge, not by guessing, but by running the numbers.
Once you have the results, run them through the Monte Carlo Simulator to stress-test the strategy across 1,000 randomized sequences and see the probability distribution of outcomes.
Test different stop loss strategies against the same entry signal. A structure-based stop might outperform an ATR-based stop on the same strategy. Automated backtesting tells you in minutes what would take months of live trading to discover.
How Is Automated Backtesting Different From Manual Replay?
TradeZella offers both automated backtesting and manual bar-replay backtesting. They serve different purposes, and the most effective workflow uses both.
Automated backtesting answers the question: "Is this strategy statistically profitable across a large sample?" The engine generates results quickly, eliminates forward bias (you cannot cheat when the engine executes the rules), and produces precise aggregate metrics.
Manual replay backtesting answers a different question: "Can I actually execute this strategy in real time?" You scroll forward bar by bar, make decisions under simulated pressure, and practice the mechanical execution. This builds pattern recognition and discipline, but the sample size is limited. For a full walkthrough of how to backtest a trading strategy manually, that step-by-step guide uses real EUR/USD trades.
The workflow that works: automated first, manual second.
Automated: Prove the strategy is statistically profitable across a large sample of trades
Manual replay: Practice executing it in real time to build muscle memory
Forward test (live, reduced size): Confirm you can execute it with real money
Full live trading: Scale to your normal position size
Dimension
Automated Backtesting
Manual Replay
Speed
Results appear in minutes
20-40 hours for 100 trades
Purpose
Statistical validation
Execution practice
Sample size
Depends on strategy rules and date range
50-100 (patience-limited)
Forward bias risk
None (engine executes rules)
Low (bar-by-bar hides future)
Execution realism
Rules-based (no human error)
High (simulates live decisions)
Best for
Proving strategy profitability
Practicing strategy execution
Replay speed
N/A (instant execution)
0.5x to 10x
For a detailed comparison of the two approaches, the manual vs automated backtesting guide breaks down every tradeoff. And for a comprehensive look at trade replay software and how it fits into your review process, that guide covers TradeZella's 3 replay modes (Trade Replay, Day Replay, Scenario Replay).
How Is This Different From Coding a Backtest?
Coded backtesting uses programming languages to define strategy logic. Pine Script (TradingView), Python with libraries like Backtrader or Zipline, MQL5 (MetaTrader), and C# (NinjaTrader) are the most common. Automated backtesting with plain English rules achieves a similar result without the programming requirement.
The Learning Curve Problem
Learning Pine Script to the point of writing a reliable backtest takes 2 to 4 weeks for someone with no coding background. Python takes longer. And "writing a backtest" is the easy part. Debugging one is harder. A single misplaced condition can silently produce inaccurate results. You might backtest for a month, go live, and discover the script had a look-ahead bias the entire time.
Plain English eliminates this entirely. There are no "if statements." No syntax errors. No debugging sessions. You describe the strategy. The platform handles the translation.
What Coded Backtesting Still Does Better
Honesty matters here. Coded backtests offer unlimited customization. If you need a strategy that references 3 different timeframes, calculates a custom oscillator from raw tick data, and applies a dynamic position sizing algorithm based on a volatility model you invented, coded backtesting is the right tool.
But that describes maybe 10 percent of retail traders. The other 90 percent use strategies built on standard indicators, price action concepts, and common entry/exit logic. Plain English automated backtesting covers that 90 percent.
Why It Matters for Most Traders
The trader who backtests an imperfect strategy today beats the trader who plans to learn Python next quarter. Speed of iteration matters more than theoretical flexibility. With automated backtesting, you test 10 variations in an afternoon. With coded backtesting, you might test 2 in a week, and spend the other 3 days fixing bugs.
For traders who have been validating strategies with journal data instead of code, the backtesting without code guide covers the holdout split and walk-forward methods that complement automated backtesting with live data validation.
What Should You Look for in an Automated Backtesting Platform?
Not all backtesting platforms offer the same depth. Some generate summary statistics with no way to inspect individual trades. Others require code. Others have shallow data. Here are the eight features that separate a useful automated backtesting platform from a toy.
1. Plain English Rules (No Coding Required)
The entire point is accessibility. If the platform requires you to write scripts, it is not automated backtesting in the way that benefits most retail traders. You should be able to describe your strategy in sentences and have the platform execute it.
2. Individual Trade Visibility
Summary statistics are not enough. You need to see every trade: entry price, exit price, duration, R-multiple result, and the chart at the moment of execution. This is how you catch strategies that look good on paper but rely on trades that would be impossible to execute in real time (gaps, illiquid periods, extreme slippage scenarios).
3. Historical Data Depth
A 6-month backtest is not statistically meaningful. You need multiple years to capture different market conditions: trending, ranging, volatile, quiet, bull, and bear. TradeZella offers 11+ years of data across futures, stocks, and forex.
4. Multiple Instruments
Testing on a single instrument proves the strategy works on that instrument in that time period. Testing the same rules on several different instruments proves the logic is robust. A good platform lets you test across futures, stocks, and forex so you can compare results.
5. AI Analysis
Raw numbers require interpretation. AI analysis takes the output and identifies patterns you would miss in a spreadsheet: time-of-day effects, day-of-week weakness, performance strengths, areas for improvement, and more.
6. Integration With Journaling
The ultimate test of a backtest is whether the strategy performs similarly when traded live. A platform that integrates backtesting with journaling means every individual trade is visible with full details, and the same Strategies you define for backtesting carry into your live journal. TradeZella does this natively, so your backtest data and live data live in the same system.
7. Pre-Built Templates
Templates accelerate testing. Instead of defining every strategy from scratch, you load a template that covers 80 percent of the logic and customize the remaining 20 percent. Templates for popular frameworks (ICT, ORB, trend following, mean reversion) save hours of setup time.
8. Speed
Backtesting value comes from iteration. If each test takes 30 minutes, you will run 3 to 4 tests per session. If results appear in minutes, you will run far more. More iterations mean more discovery. The platform should return results quickly, not make you wait hours.
Why TradeZella
TradeZella is the only platform that combines automated backtesting, manual replay (3 modes), AI analysis (Zella AI), journaling (500+ broker import, Strategies, Tags, Notebook), and live performance analytics in a single platform. Other platforms do one or two of these things. None combine all of them.
For a full comparison of backtesting platforms, the best backtesting software guide reviews 10 platforms side by side. For a head-to-head comparison with the most-searched competitor, the FX Replay vs TradeZella breakdown covers every difference.
How to Run Your First Automated Backtest
Running your first automated backtest in TradeZella takes 10 to 15 minutes from login to results. Here is the step-by-step process.
Step 1: Choose Your Instrument
Start with whatever you trade live. If you trade ES futures, backtest ES. If you trade SPY, backtest SPY. Testing your actual instrument first means the results are immediately actionable. You can expand to other instruments after you validate the core strategy.
Step 2: Pick a Template or Write Your Own Rules
If you trade a common strategy (EMA crossovers, ORB, ICT concepts), start with a template. Load it, review the default conditions, and adjust anything that does not match your specific approach. If your strategy is unique, write your rules from scratch in plain English.
For example: "Enter long when price breaks above the prior day's high during the first 60 minutes of RTH, with a stop at the prior day's high minus 2 points, and a target at 2R. Only take the trade if the 21 EMA is sloping upward on the 15-minute chart."
Step 3: Set the Date Range
Use at least 1 year of data. Two years or more is better because it captures different market regimes (trending vs. ranging, low vs. high volatility). If the strategy only works in trending markets, a 2-year sample that includes a range-bound period will reveal that.
Step 4: Run the Test
Click run. Wait for the results. Results appear in minutes, depending on the complexity of your rules and the date range selected.
Step 5: Review the Trade List
Before looking at any summary statistic, scan the individual trades. Check 10 to 15 trades manually. Do the entries look realistic? Are the exits where you would expect them? Are there any trades that occurred during overnight sessions, pre-market, or other periods you would not actually trade? If you find unrealistic trades, adjust your rules and re-run.
Step 6: Check the Metrics
Look at the core numbers. For a strategy worth forward-testing, the benchmarks are:
Profit factor: Above 1.3 (above 1.5 is strong)
Expectancy: Positive R-multiple (even +0.15R is viable at high frequency)
Maximum drawdown: Below 15R (ideally below 10R)
Win rate + average win/loss: The combination matters more than either number alone. A 35 percent win rate with 3:1 average win/loss is strong. A 70 percent win rate with 0.5:1 average win/loss is not.
If the strategy fails these benchmarks, it either needs parameter adjustments or it does not have an edge. Automated backtesting lets you find out fast instead of discovering it after 3 months of live losses.
Step 7: Ask Zella AI to Analyze
After reviewing the numbers yourself, let Zella AI analyze the full dataset. Zella AI analyzes the results and identifies patterns, strengths, and areas for improvement, including time-of-day effects and day-of-week weakness that summary statistics hide. The AI's analysis often reveals the one filter that turns a marginal strategy into a strong one.
Step 8: Iterate
Change one variable at a time. If Zella AI suggests excluding Friday trades, run the test with a Monday-through-Thursday filter and compare the results. If the profit factor improves from 1.3 to 1.7, the filter is validated. If it barely changes, the pattern was noise.
The rule of iteration: change one thing, re-run, compare. Changing multiple variables at once makes it impossible to know which change caused the improvement. Treat each iteration like a controlled experiment.
After validating, move to manual replay to practice execution. The backtest with TradeZella guide covers the manual replay interface in detail. Then track your live results on the same trading dashboard to see every individual trade and review how your live performance develops.
Key Takeaways
Automated backtesting lets you test strategies in minutes, not weeks. Write rules in plain English, run them across 11+ years of data, and see every individual trade with full metrics.
Plain English rules remove the coding barrier. You describe your strategy the way you would explain it to another trader. No Pine Script, no Python, no debugging.
Pre-built templates accelerate testing. ICT concepts, ORB strategies, trend following, and mean reversion templates give you a starting point. Customize parameters and run.
Zella AI turns numbers into insights. After a backtest runs, Zella AI analyzes the results and identifies patterns, strengths, and areas for improvement that summary statistics hide.
Every individual trade is visible. Inspect entries, exits, and outcomes one by one. Summary statistics hide problems that trade-level review reveals.
Automated and manual backtesting serve different purposes. Use automated to prove statistical profitability. Use manual replay to practice execution. The workflow is automated first, manual second, forward test third, live fourth.
Iteration is the edge. Testing 10 to 15 variations in a single afternoon reveals the specific configuration with the highest expectancy and lowest drawdown. Combine this with strong risk management and the strategy graduates from theory to live trading with evidence behind it.
Frequently Asked Questions
What is automated backtesting?
Automated backtesting is a method of testing trading strategies by writing rules and having software execute those rules against historical market data. Instead of scrolling through charts bar by bar and manually marking trades, you define your entry conditions, exit conditions, and risk parameters. The software scans years of historical data, identifies every occurrence where your conditions are met, simulates the trade, and records the result. The output is a complete trade log with every individual entry, exit, duration, and profit or loss, along with aggregate metrics like win rate, profit factor, expectancy, and maximum drawdown.
What is the best automated backtesting tool to use in 2026?
TradeZella is the best automated backtesting tool in 2026 for traders who want plain-English, no-code testing. You describe your strategy in ordinary sentences, TradeZella runs it across more than 11 years of real historical data on stocks, forex, futures, and crypto in minutes, and every individual trade is visible with the exact setup drawn on the chart. Zella AI then reviews the results and flags what to fix, such as a weak time of day or a losing day of the week, and every backtest feeds the same journal and analytics as your live trades. For traders who prefer to code, NinjaTrader, MetaTrader 5, and QuantConnect offer powerful automated backtesting but require scripting in NinjaScript, MQL5, or Python. If you want automated backtesting without writing code, with every trade visible and AI analysis built in, TradeZella is the strongest choice.
Do I need to know how to code to use automated backtesting?
No. TradeZella's automated backtesting uses plain English rules. You describe your strategy the way you would explain it to another trader. For example: "Enter long when the 9 EMA crosses above the 21 EMA and RSI is below 30, with a stop at 1.5 ATR below entry and a target of 2R." The platform translates this into executable logic and runs it against historical data. There is no Pine Script, no Python, no MQL, and no debugging. Pre-built templates for ICT concepts, Opening Range Breakout, trend following, and mean reversion strategies are also available as starting points.
How much historical data does TradeZella have for backtesting?
TradeZella offers 11+ years of historical data across futures, stocks, and forex. This depth is critical for statistical validity because it captures multiple market regimes: trending, ranging, volatile, quiet, bull, and bear conditions. A strategy tested across 2 to 3 years of data that includes different regimes provides far more reliable results than a strategy tested across 6 months of a single market condition. The minimum recommended date range for a meaningful backtest is 1 year, with 2 years or more being the standard for confident validation.
What is the difference between automated backtesting and algorithmic trading?
Automated backtesting tests a strategy against historical data to determine whether it would have been profitable. No real money is involved, and no live orders are placed. Algorithmic trading uses code to execute live trades automatically based on predefined rules, placing real orders with real capital in real time. Automated backtesting is the validation step that should happen before algorithmic trading. You prove the strategy works in historical data, then practice execution, then trade live. TradeZella's automated backtesting is a testing tool, not a trade execution tool. It does not place orders or connect to a broker for live trading.
Can I compare automated backtest results to my live trading?
Yes. This is one of TradeZella's key advantages as an integrated platform. When you define a strategy for automated backtesting, that same Strategy carries into your live trading journal. As you trade the strategy live, TradeZella tracks your real-world results using the same metrics (win rate, profit factor, expectancy, R-multiples, drawdown). Every individual trade is visible with full details in both your backtest data and your live journal, so you can review how the strategy performs across both datasets. If the live results are within fifteen to twenty percent of the backtest results, the strategy is performing as expected. If the gap is larger, it signals either an execution problem (you are not following your own rules) or a market regime change that the backtest period did not capture.