Built For
Instruments: Forex/Futures/Crypto
Trading Style: Swing Trading
Strategy Overview
This Strategy is built around a simple, top-down price action framework designed to help you find high-probability trades by following the trend and entering at the most optimal time, during a pullback into a key area of interest.
The core idea is this: price moves in swings, and when a break of structure (BOS) occurs on the higher timeframe (HTF), the market often pulls back into the zone that caused that move, known as a Point of Interest (POI). That’s where this strategy helps you step in and catch the next leg of the trend.
We start by identifying a clean market structure break on the higher timeframe, such as the daily or weekly chart. From there, we mark out the POI that led to the break, typically an Order Block (OB) or Breaker Block. This POI becomes the zone where we expect the next higher low (in an uptrend) or lower high (in a downtrend) to form.
Once price pulls into the POI, we drop to the lower timeframe (like H1 or M15) and wait for a confirmation entry, often using a breaker setup — a failed move that sweeps liquidity and then reclaims structure. This entry method gives us clear risk and validation levels, with stops placed below or above the liquidity sweep.
The goal is simple:
- In an uptrend, buy the higher low that forms inside the Point of Interest (POI).
- In a downtrend, sell the lower high within the Point of Interest (POI).
This approach keeps you trading in the direction of the higher timeframe, while entering at a discount (for longs) or premium (for shorts) — where smart money is most likely active.
It’s designed to work across all markets (crypto, forex, futures) and timeframes using a top-down approach with two or more timeframes.
By combining structure, liquidity, and timing into one simple process, this framework removes the noise and keeps you focused on the highest probability part of the move: the pullback into the POI where the next expansion is likely to begin.
Strategy Criteria
This setup is only valid when all the following conditions are met:
Timeframes
Use two timeframes:
- High Timeframe (HTF) – for trend, bias, and range (Weekly, Daily, H12, H4)
- Low Timeframe (LTF) – for execution and entry setup (H1, M15, M5)
Examples:
- HTF: Daily → LTF: H1
- HTF: H4 → LTF: M15
Top-Down Analysis: Define the Trend
- Identify the high time frame (HTF) trend (e.g., weekly/daily).
- Use the HTF swing structure to confirm if the price is in an uptrend or a downtrend.
- Must see a clear market structure break (MSB) to define the new trading range.
Mark the HTF Range
- From the last significant swing low to swing high (in an uptrend) or swing high to swing low (in a downtrend).
- Mark the 50% line (midpoint) to distinguish between premium and discount.
- In an uptrend, we want to buy at a discount (lower half of the range).
- In a downtrend, we want to sell in the premium (upper half of the range).
Identify the Point of Interest (POI)
- Use the HTF to mark:
- Order Block (OB).
- It can also be a Breaker Block or Fair Value Gap.
- This is where you’ll look for trades when the price pulls back.
Look for Entry on Lower Timeframe (LTF)
- Drop to your execution timeframe (e.g., H1 or M15).
- Inside the POI, wait for:
- Engineered liquidity (a swing low or high).
- A stop run (sweep of that liquidity).
- A market structure break in the opposite direction (a breaker setup).
Trade Execution
- Enter on the breaker block after the MSB on LTF.
Stop-Loss:
- Below the low that got swept (for longs) or above the high (for shorts).
Target:
- The next HTF external liquidity is the previous swing high (for longs) or swing low (for shorts).
Risk/Reward
- Must be at least 2:1 RR to qualify.
- Only take setups that meet or exceed this risk-to-reward requirement.
- Adjust position size dynamically based on confidence and confluence.

Pros and Cons of the Strategy
This model is designed to deliver high-quality, repeatable setups — but like any trading method, there are key things to understand before using it.
Note: The cons listed here aren’t disadvantages. They are things to be aware of — important characteristics that require patience, discipline, and proper management to make the model work effectively.
Pros
- Simple & Clear: Easy to understand.
- Mechanical Framework: Step-by-step process using MSB, range, POI, and lower timeframe confirmation.
- All-in-One System: Combines market structure, liquidity, order blocks, and bias into one flow.
- Works on Any Market/Timeframe: Used for crypto, forex, futures, and commodities. It is scalable across timeframes.
- Clean Charts: Visually tidy and easy to mark up.
Cons (Things to Be Aware Of and Manage)
- Not Fully Mechanical: Entries need some discretion, especially around breakers and confirmation.
- Requires Chart Time: Needs backtesting and live practice — can’t rely on hindsight examples alone.
Needs Adaptation: Traders must eventually personalize it for their style, assets, and timeframe.
Trade Breakdown
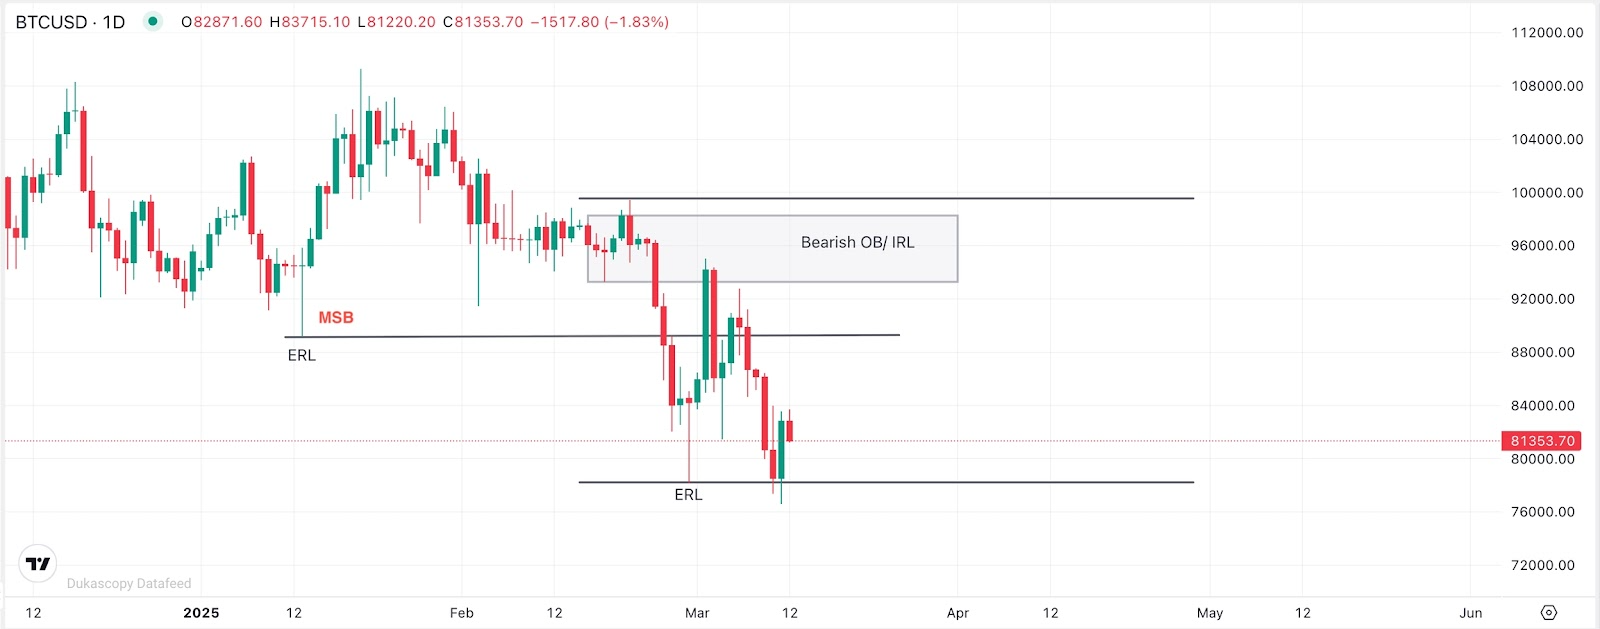
Trade Example 1 Bitcoin Short Trade ( 1D HTF + 30m LTF)
High Time Frame (HTF) – 1-Day Chart
- Bias: Bearish
- Market Structure Break (MSB): Price broke below a key swing low, confirming a bearish structure.
- Range: From swing high to the new swing low after the MSB.
- POI: A bearish Order Block — the last up candle before the move that broke structure.
- Price retraced into this POI, which was in the premium area of the range.

Lower Time Frame (LTF) – 30-Minute Chart
Inside the 1D OB, on the 30m chart:
- Price ran a swing high, grabbing liquidity (engineered liquidity sweep).
- Entry was taken on the retest.
- Stop: Above the high that was swept.
- Target: The next external liquidity level, which was a lower low from the HTF.

Results
- The short played out perfectly.
- Strong bearish displacement confirmed the move — a large fair value gap formed, showing institutional order flow.
- Price dropped aggressively from the entry, fully reaching the target.
Trade Example 2 Solana Long Trade (HTF + LTF confirmation)
High Time Frame (HTF) – Weekly Chart
- Bias: Bullish
- Market Structure Break (MSB): Price broke above a previous swing high, confirming a bullish leg.
- Range: From the most recent swing low to the new swing high.
- Discount Zone: Bottom 50% of the range.
- POI: A bullish Order Block — the last down candle.
- Price retraced into this OB, landing in the discount zone.

Lower Time Frame (LTF) – H12
Inside the weekly OB:
- Price came back into the OB and started building up liquidity — multiple swing lows formed inside the zone.
- One more low formed, and then it got swept — that was the liquidity grab.
- Entry was taken on the retest.
- Stop: Below the low that was swept.
- Target: The next external liquidity, which was the swing high on Solana.Result:

Results
- A strong bullish move followed the entry.
- A large fair value gap formed after the entry, showing strong momentum and confirming that the move was likely institutionally supported.
- Price continued to rally and eventually traded all the way back to its all-time high — that was the target.
How to Backtest This Structure + OTE Strategy
The fastest way to test this Structure + OTE strategy is with TradeZella's automated no-code backtesting. Define your rules in plain English, hit run, and TradeZella runs them across 11+ years of historical data in seconds, then shows you every individual trade along with your win rate, profit factor, and expectancy instantly, without you stepping through a single chart. It is the quickest way to see whether the setup holds up before you risk a dollar.
You can also test it manually by replaying the market bar by bar. Load 11+ years of historical data, set up your higher timeframe and lower timeframe charts the way you trade live, and replay price bar by bar. Confirm the higher timeframe trend with a market structure break, mark your range and the 50% line to separate premium from discount, then mark the Point of Interest, an Order Block or Breaker, that caused the move. When price pulls back into the POI, drop to the lower timeframe and wait for a liquidity sweep and a market structure break in your direction. Enter on the breaker, place your stop beyond the swept low or high, and target the next higher timeframe liquidity for at least a 2:1 setup, using automatic position sizing with your stop and target on the chart. Every backtested trade gets logged automatically with your entry, exit, position size, and P&L. Add notes on what you saw, tag mistakes, and review the same way you would a live trade. After 30 to 50 trades, you can see your win rate, profit factor, and expectancy on this specific setup. Manual replay is the best way to build screen time and a real feel for the setup.
When you start trading live, import your live trades into TradeZella, the AI trading journal that does the journaling for you. Your backtest results and live results live in the same platform, so you always know how the strategy performs in testing vs how it performs with real money, without switching between tools or maintaining separate spreadsheets.
Start Backtesting This Strategy Using TradeZella
Frequently Asked Questions
What is the Structure + OTE strategy?
The Structure + OTE strategy is a top-down swing trading framework that combines higher timeframe structure with optimal pullback entries. The core idea is that when a break of structure occurs on the higher timeframe, price often pulls back into the zone that caused the move, called a Point of Interest, before the next leg. You buy the higher low inside the POI in an uptrend and sell the lower high in a downtrend, keeping you trading with the trend while entering at a discount or premium where smart money is most active.
What is a Point of Interest (POI)?
A Point of Interest is the higher timeframe zone that caused the break of structure, typically an Order Block, but it can also be a Breaker Block or a Fair Value Gap. It is the area where you expect the next higher low to form in an uptrend or the next lower high in a downtrend. Once price pulls back into the POI, it becomes the zone where you look for a lower timeframe entry rather than chasing price in the middle of the range.
What are premium and discount in this strategy?
After a market structure break, you mark the range from the last significant swing low to swing high and draw the 50% midpoint. The lower half is discount and the upper half is premium. In an uptrend you want to buy in the discount, the lower half of the range, and in a downtrend you want to sell in the premium, the upper half. Combining the premium and discount idea with a Point of Interest keeps entries on the high-probability side of the move.
How do you confirm an entry on the lower timeframe?
Once price reaches the POI, you drop to your execution timeframe, like H1 or M15, and wait for a breaker setup. That means engineered liquidity in the form of a swing low or high, a stop run that sweeps that liquidity, and then a market structure break in the opposite direction. You enter on the breaker after the structure break, with the stop placed below the low that was swept for longs or above the high for shorts, which gives clear, defined risk.
What instruments and timeframes does this strategy use?
The framework works across crypto, forex, and futures and is scalable across timeframes, using a top-down approach with two or more timeframes. You use a higher timeframe such as the Weekly, Daily, H12, or H4 for trend, bias, and range, and a lower timeframe such as H1, M15, or M5 for execution. Common pairings are a Daily higher timeframe with an H1 execution chart, or an H4 higher timeframe with an M15 execution chart. Every setup must meet at least a 2:1 reward-to-risk to qualify.
Can I backtest the Structure + OTE strategy?
Yes. You can test this strategy using TradeZella's backtesting with 11+ years of historical data. Confirm the higher timeframe trend with a market structure break, mark the range and POI, then replay price into the zone and wait for the lower timeframe liquidity sweep and breaker before entering. Every trade logs automatically with entry, exit, position size, and P&L. Add notes, tag mistakes, and review the same way you would a live trade. After 30 to 50 trades you can see your win rate, profit factor, and expectancy on this specific setup before risking real money.
What is TradeZella backtesting?
TradeZella backtesting lets you test a trading strategy against 11+ years of historical market data across forex, futures, stocks, and crypto, down to seconds-level timeframes. You can do it two ways. Replay the market bar by bar and place trades as if you were trading live, with your own timeframes, automatic position sizing, and stops and targets you drag right on the chart, and every trade logs automatically with entry, exit, size, and P&L. Or use automated no-code backtesting: define your strategy rules in plain English and the engine runs them across years of data in seconds, returning every individual trade it took with the exact setup drawn on the chart, so you see why each trade fired instead of just an equity curve. Zella AI then analyzes the results and flags what to fix.