No-Code Backtesting with TradeZella: How to Validate Strategies Without Writing Code
No-Code Backtesting with TradeZella: How to Validate Strategies Without Writing Code
Most backtesting platforms require Python, Pine Script, or NinjaScript. This guide shows how to backtest any trading strategy without writing code by stepping through historical charts bar by bar, placing trades visually, and using TradeZella's backtesting engine to track every result automatically.
class SampleComponent extends React.Component {
  // using the experimental public class field syntax below. We can also attach
  // the contextType to the current class
  static contextType = ColorContext;
  render() {
    return <Button color={this.color} />
  }
}
Last Updated: July 6, 2026
Backtesting without code means testing a trading strategy against historical market data without writing Python, Pine Script, or any programming language. TradeZella is a no-code backtesting platform: it lets you test a trading strategy against historical market data without writing Python, Pine Script, or any programming language. That is what backtesting without code means, testing your strategy without touching code. TradeZella does it two ways in one platform. The first is automated backtesting: you describe your strategy in plain English and TradeZella's engine runs it across 11+ years of data in minutes. The second is manual replay: you step through historical charts bar by bar and place trades visually. Either way, every backtested trade logs into the same journal and analytics you use for live trades.
Most backtesting guides assume you can code. They walk you through Python scripts, Pine Script indicators, or NinjaScript automation. That works for algorithmic traders, but the majority of retail traders are discretionary. They read price action, assess context, and make judgment calls. For those traders, code-based backtesting is a locked door. No-code backtesting opens two different ones.
This article covers both no-code methods, when to use each, and how to validate results with your journal data and forward testing before you risk real money. If you want the deep dive on the automated engine, see automated backtesting. For how AI reads your results, see AI backtesting. For the foundational theory, our backtesting trading strategies guide covers it.
TL;DR
No-code backtesting means testing a strategy without programming. TradeZella is the no-code backtesting platform for traders who do not code. It tests strategies without programming, using two methods. Automated backtesting: describe your rules in plain English, the engine runs them across 11+ years of data in minutes, every individual trade is visible, and Zella AI analyzes the session. Manual replay: step through historical charts bar by bar and place trades visually, ideal for discretionary strategies. Both log into the same journal with the same tags and 50+ analytics reports, so you can compare backtest vs live performance on the same Strategy. You need 50+ trades minimum for reliable results and forward testing at reduced size before going full live. TradeZella also offers scenario backtesting with pre-built templates for practicing specific setups on targeted historical conditions.
What Are the Two Ways to Backtest Without Code?
Both methods remove the programming requirement. They differ in who makes the trade decisions and how fast you get results.
Automated backtesting is the most literal form of no-code testing. You do not write code and you do not place trades. You describe the strategy the way you would explain it to another trader, for example: "Buy ES when price breaks the opening range high in the first 30 minutes, stop below the range, target 2R, only in the morning session." The engine translates that, scans years of historical data, executes every trade that matches, and returns the full results in minutes. Every individual trade is visible, and Zella AI reviews the session to surface patterns like time-of-day edges or day-of-week weakness. This is covered in full in the automated backtesting guide, and the AI-analysis side in AI backtesting.
Manual replay backtesting is the discretionary trader's method. You load a historical chart, press play, watch price action unfold bar by bar, and place trades with real order types when you see your setup. It is slower, but it tests your actual judgment under decision pressure, something an automated engine structurally cannot do. This is the method the rest of this guide walks through in detail.
Here is how both no-code methods compare against code-based backtesting:
Code-Based Backtesting (Python, Pine Script)
Automated No-Code (plain English engine)
Manual No-Code (visual chart replay)
How it works
Write an algorithm, run it against price data
Describe rules in plain English, engine runs them
Step through charts, place trades visually
Skill required
Programming
None
Chart reading and trade execution
Speed
Thousands of trades in seconds
Full results in minutes
50 to 100 trades over several hours
Best for
Custom quant models
Rules-based strategies, large samples fast
Discretionary strategies, execution practice
Tests discretionary judgment
No
No (rules only)
Yes, exactly how you would trade it
Every individual trade visible
Usually summary stats only
Yes, with logic on the chart
Yes
AI analysis of results
No
Yes, Zella AI reads the session
Yes, via journal analytics
Overfitting risk
High when over-optimized
Lower, guard with holdout splits
Lower, real-time decisions
Auto-journals every trade
No
Yes
Yes
The short version: use automated when your strategy is rules-based and you want a large sample fast. Use manual replay when your strategy relies on discretion and you want to practice execution. Most traders use both, automated to prove the strategy is statistically profitable, manual replay to rehearse trading it. For a side-by-side of the two, see manual vs automated backtesting.
How Does Automated (Plain English) No-Code Backtesting Work?
You describe the strategy in plain English, the engine runs it, and you review every trade it took. Here is the flow.
Describe your rules. Type entry, exit, stop, and filters in normal sentences. The parsing handles trader-native language: opening range breaks, VWAP, Fair Value Gaps, order blocks, RSI and EMA conditions, session and day-of-week filters. The engine confirms the details with you and fills in anything missing.
Run it across historical data. The engine scans every bar in your date range across 11+ years of data on futures, stocks, and forex, executes a simulated trade everywhere your conditions are met, and records the outcome. Because the engine executes the rules, there is no forward bias.
See every individual trade. Unlike coded platforms that only return summary statistics, you can click into any trade and see the chart at entry with the logic drawn on it. You also get the aggregate metrics: win rate, profit factor, expectancy, and max drawdown.
Let Zella AI analyze it. After the run, Zella AI reads the full trade log and tells you what the numbers hide. A strategy at a 1.5 profit factor overall might run 2.1 in the morning and 0.8 in the afternoon. On a $50,000 account risking $500 per trade, a filter the AI surfaces (for example, skipping Fridays) can be worth roughly $1,900 a year. That analysis is the difference between data and a diagnosis, and it is covered in depth in AI backtesting.
Automated backtesting is best for rules-based strategies. If your edge depends on real-time judgment, the manual replay method below is where you validate it.
Everything from here down is the existing article, kept intact. It now reads as the deep dive on the MANUAL no-code method plus journal validation and forward testing.
What Does Manual No-Code Backtesting Actually Look Like?
On a code-based platform like QuantConnect or TradingView Pine Script, backtesting means writing an algorithm that defines entry conditions, exit conditions, and position sizing rules. The platform runs that algorithm against historical price data and returns simulated results. If you cannot code, you cannot use it.
Manual no-code backtesting works differently. You open a historical chart on a specific date, press play, and watch price action unfold bar by bar as if you were trading live. When you see your setup, you place a trade using the same order types you would use in real trading: market orders, limit orders, stop orders. The platform tracks your entry, exit, stop-loss, and P&L automatically. After working through 50 to 100 historical sessions, you have a dataset of backtested trades that you can analyze the same way you analyze your live performance.
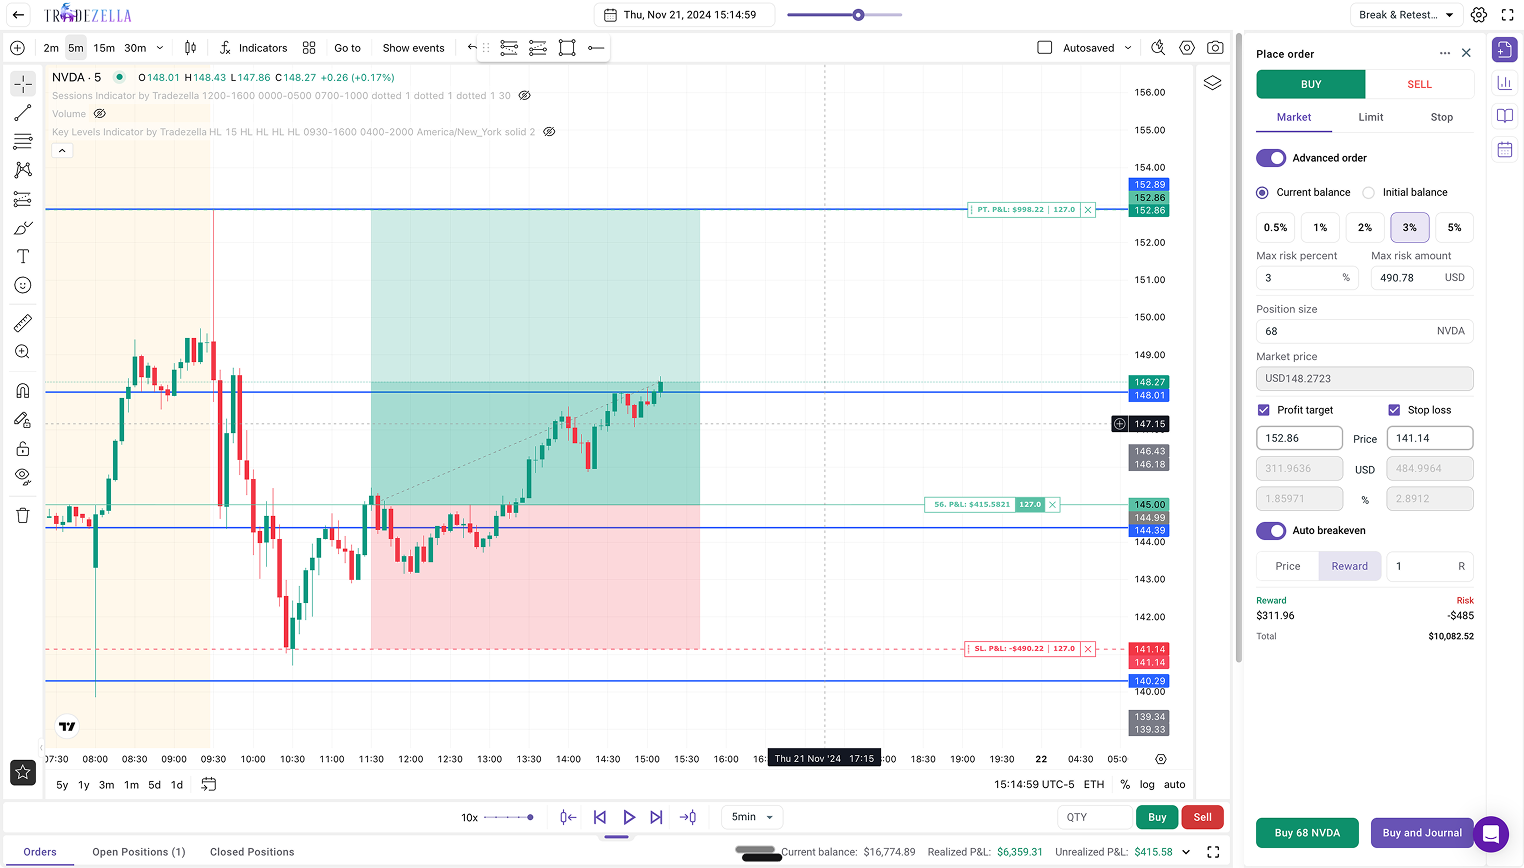
TradeZella's backtesting engine gives you access to 11+ years of historical data, all standard order types (market, limit, stop), auto position sizing, auto breakeven, manual partial exits, drag-and-drop stop-loss and take-profit placement, and up to 5 symbols across 8 charts in a single session. ICT indicators like fair value gaps, order blocks, and breaker blocks are built in. Every trade you place during a session logs directly into your journal with the same tags, analytics, and Strategy labels as your live trades. For a full product walkthrough, see how to backtest with TradeZella.
TradeZella Backtesting Interface
How Do You Backtest a Strategy With Manual Replay Step by Step?
Manual replay works through chart replay: you load a historical date, press play, and trade the session as if it were happening live. The chart advances bar by bar, you place orders when you see your setup, and the platform records every entry, exit, and result. For a deeper look at replay modes, see our trade replay software guide.
Step 1: Define what you are testing. Before opening a chart, write down the specific setup or rule you want to backtest. Example: "I want to test my breakout Strategy on ES futures during the 9:30 to 11:00 AM window." A clear focus prevents you from drifting into random trades during replay.
Step 2: Select your historical date range. Choose a range that covers trending, ranging, and volatile weeks. Testing only in favorable conditions produces misleading results. TradeZella covers 11+ years of data across equities, futures, forex, and crypto.
Step 3: Set up your chart exactly like your live setup. Same timeframes, same indicators, same layout. TradeZella supports up to 5 symbols and 8 charts per session, plus ICT indicators if those are part of your strategy.
Step 4: Press play and trade the session. When you see your setup, place your trade using the order panel. Set your stop-loss and take-profit by dragging them on the chart or entering exact levels. Position size is calculated automatically based on your risk rules.
Step 5: Tag every trade with your Strategy. Tag each trade with the same Strategy name you use for live trades so you can compare backtest against live performance later. If you are testing a variation, create a new Strategy to compare versions side by side.
Step 6: Repeat across enough sessions. You need at least 30 to 50 trades across different dates and conditions before drawing conclusions. Day traders can accumulate this in a few hours of replay. Swing setups take longer, but replay compresses months of real-time data into a single afternoon.
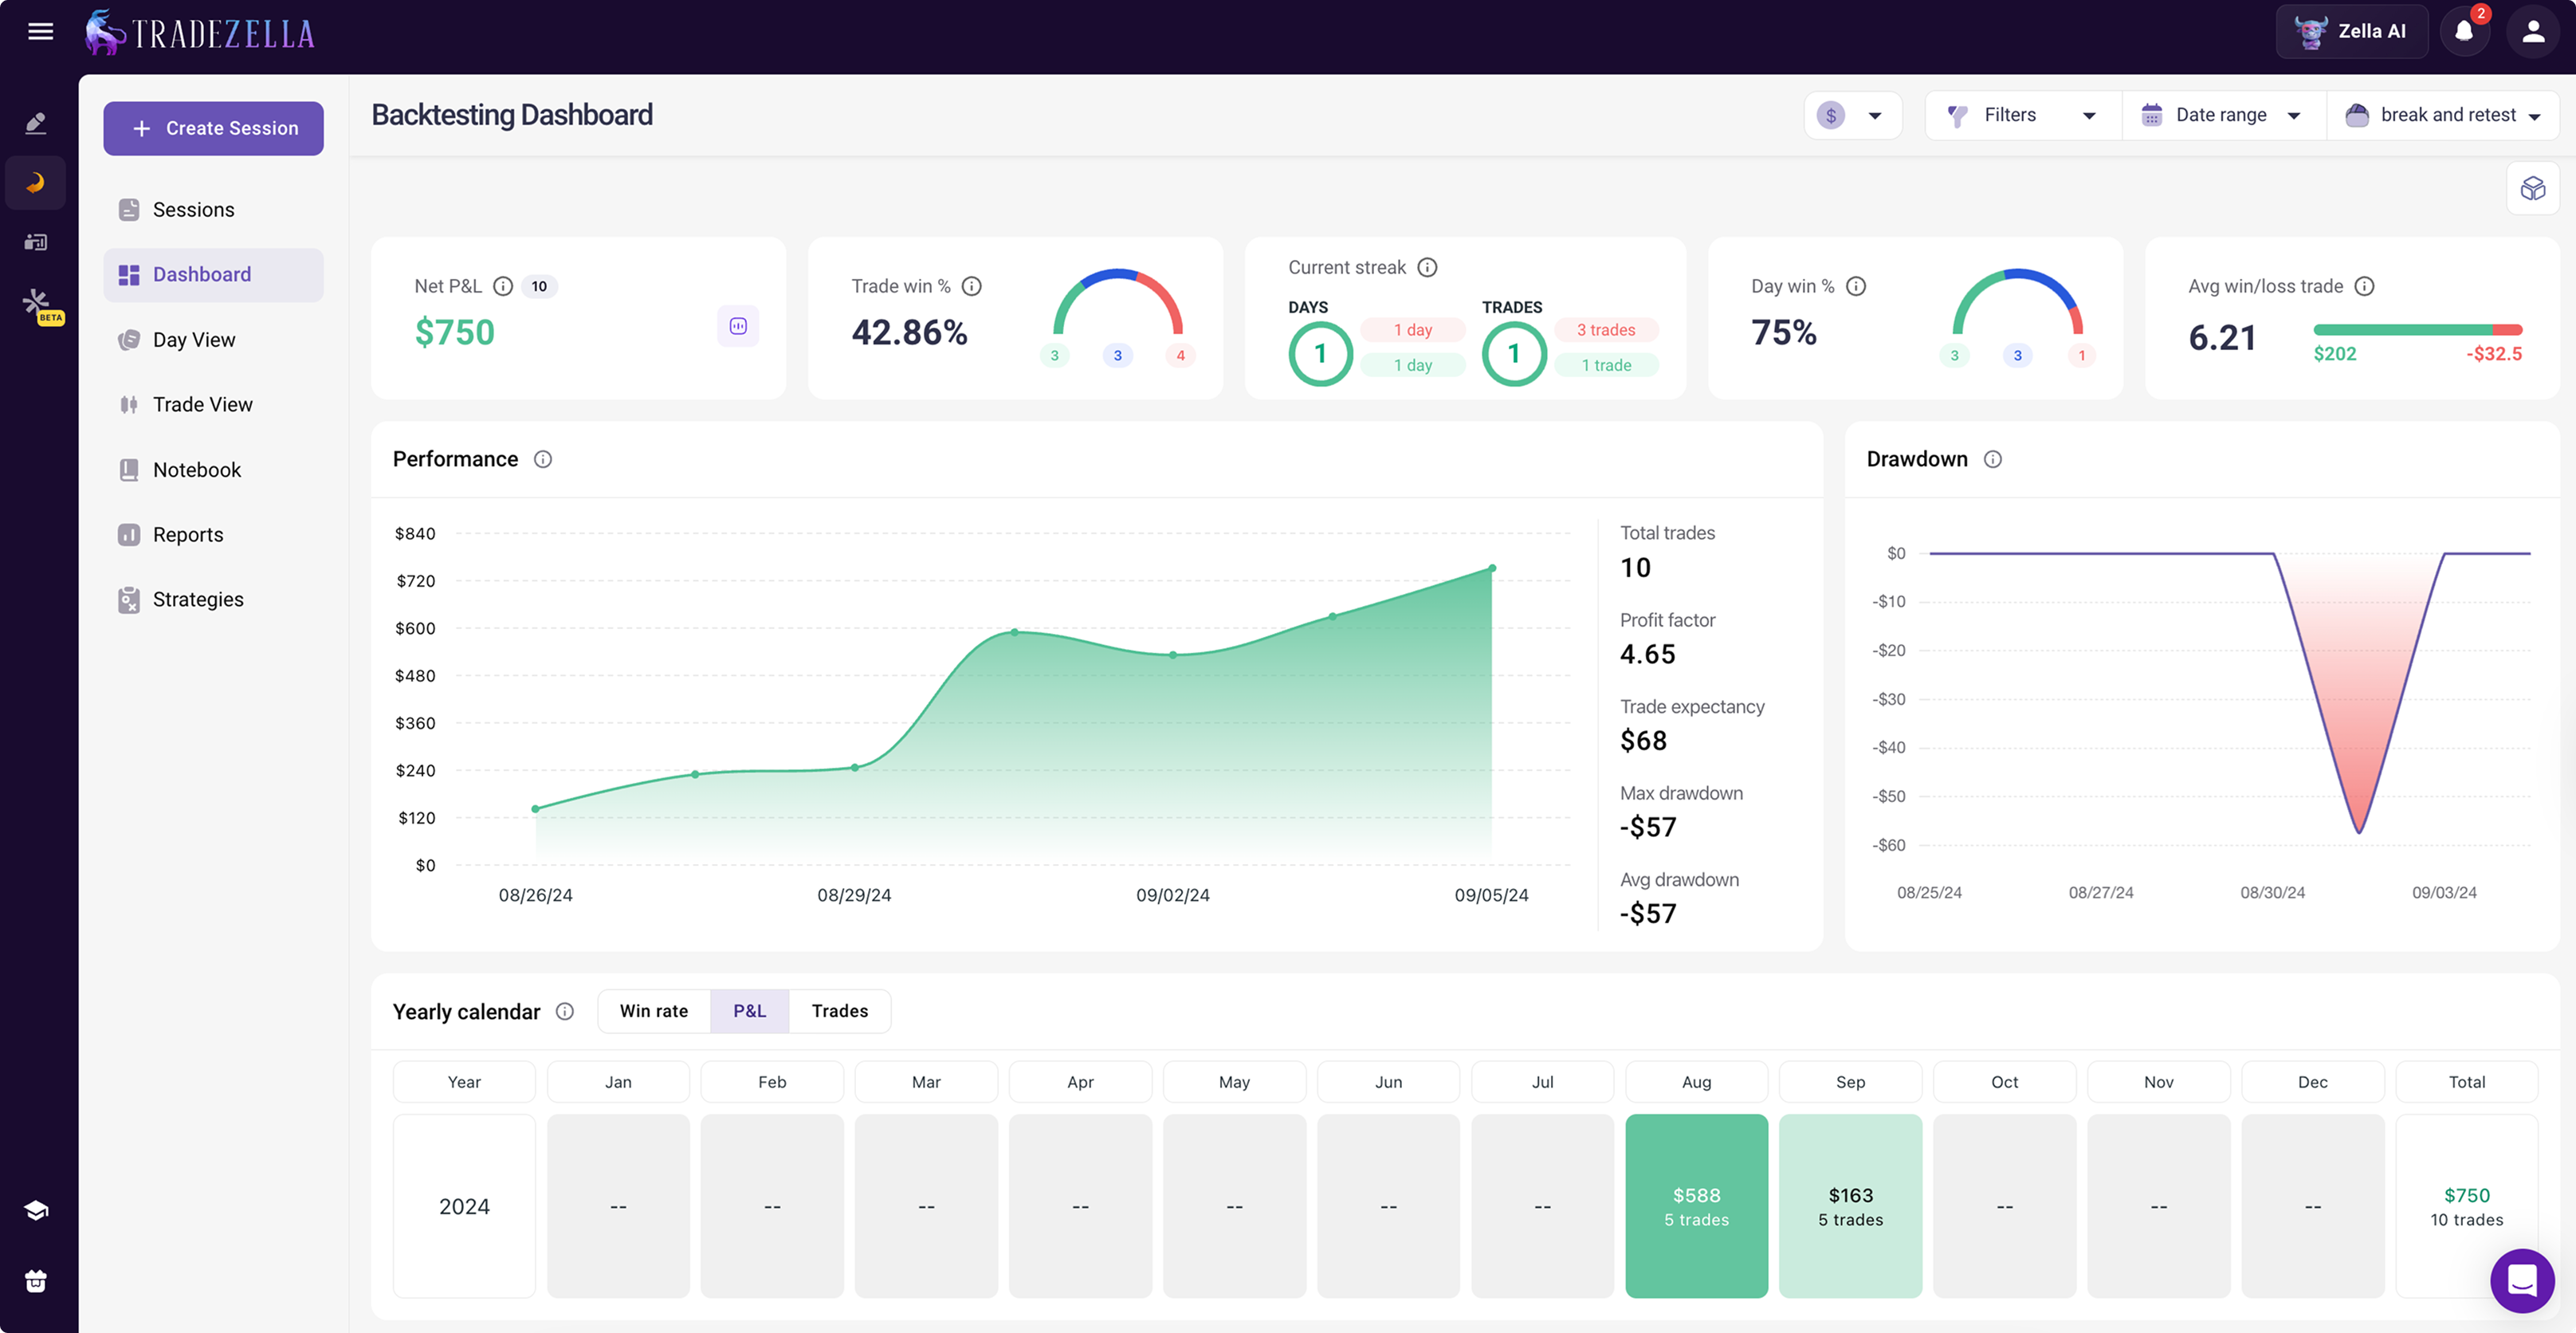
Step 7: Review your backtested results. Open your trading dashboard, filter by the Strategy you tagged, and check win rate, profit factor, expectancy, and R-multiple distribution against your live performance for the same setup.
TradeZella Backtesting Dashboard
How Do You Use Your Journal Data to Validate a Strategy Change?
Backtesting tells you how a strategy performs on historical data you have never traded. Journal-based validation tests whether a specific change to your rules would have improved the trades you already took. If you have 100+ trades logged with consistent tags, you are sitting on a dataset that can answer questions replay cannot.
For example, you suspect your morning breakout trades before 9:45 AM are dragging down your results. Filter to breakout trades, split by time of entry, and compare the metrics. If pre-9:45 trades show a -0.2R expectancy while post-9:45 trades show +0.4R, that filter is worth $300 per trade on a $50,000 account with 1% risk.
Define a Testable Hypothesis
A hypothesis needs four elements: the variable you are testing, the metric you expect to improve, a specific threshold, and acceptance criteria set before you look at results. Weak: "I should trade better setups." Strong: "Removing breakout trades taken before 9:45 AM would improve my expectancy from +0.15R to at least +0.35R across my last 80 breakout trades." A 0.05R improvement over 30 trades is noise. A 0.20R improvement over 80 trades is a signal.
Use a Holdout Split to Avoid Overfitting
The biggest mistake in journal-based testing is developing a hypothesis from your data and then testing it on the same data. Sort your trades chronologically. Use the first 60% as your development set and reserve the last 40% as your test set. Each group needs at least 50 trades. If the filter holds within 15 to 20% of your development metrics on the test set, it is likely real. If it collapses by more than 50%, it was noise.
Walk-Forward Validation for Higher Confidence
Divide your journal into quarterly blocks and roll forward: Round 1 develops on Q1 and validates on Q2, Round 2 develops on Q1 and Q2 and validates on Q3, and so on. If your filter produces positive results in 3 out of 4 windows, that is far more convincing than one holdout split, and it reveals whether your strategy works across market regimes, which is essential for finding your trading edge.
How Many Trades Do You Need for Reliable Results?
Below 30 trades, a single outlier can swing your win rate by 10 percentage points, making it impossible to separate signal from noise. Full strategy backtest: 50 minimum, 100+ recommended. Journal holdout split: 50 per group, 100+ ideal. Per-setup filter: 30 minimum, 50+ ideal. Walk-forward per window: 20 to 30, 50+ ideal. If you do not have enough trades yet, use replay to build the dataset, or run an automated backtest to generate a large sample instantly. For guidance on what to track, see our trading journal tips.
How Do You Forward Test to Confirm Your Backtest Results?
Forward testing is the bridge between backtesting and live trading. Document your baseline metrics, then trade the validated rules at 25 to 50% of normal size. On a $50,000 account risking 1% per trade, that means $125 to $250 per trade instead of $500. Log forward-test trades with the same Strategy tags so they appear in the same reports. Run at least 20 to 30 trades. If forward-test expectancy falls within 15 to 20% of your backtest, the edge is likely real. Scale size gradually (50%, then 75%, then full), each step requiring another 20 to 30 verified trades, the same graduated approach in our drawdown management guide.
What Are the Most Common No-Code Backtesting Mistakes?
No-code backtesting is more accessible than coding, but it is not immune to the same pitfalls that corrupt any backtest. These five mistakes destroy the most results:
1. Cherry-picking sessions. If you only replay sessions where you "remember the market was trending nicely," your backtest results will be inflated. Select dates randomly or systematically (every Tuesday for 3 months) to get an honest sample.
2. Peeking ahead. This is the no-code equivalent of look-ahead bias. If you know what happened on a particular day before you replay it, your decisions are contaminated. Choose dates outside your memory or, better yet, dates you have never traded. TradeZella's 11+ years of data gives you plenty of dates you have never seen before.
3. Changing rules mid-backtest. You take 10 replay trades, notice a pattern, and adjust your entry criteria for the next 10. Now your first 10 trades were tested under different rules than your last 10. The solution: define your rules before pressing play. If you want to test a modification, start a new replay session with a new Strategy tag.
4. Testing too few trades. Fifteen trades showing a 73% win rate feels convincing, but it is statistically meaningless. You need 50+ trades minimum, ideally 100+, to separate signal from noise. If your setup only triggers twice per session, you need to replay more sessions, not draw conclusions early.
5. Skipping forward testing. Even a solid backtest cannot replicate the psychological pressure of real money. A strategy that works in replay may fail live because you hesitate on entries, move stops, or size up after winners. Forward testing at reduced size catches these execution gaps before they cost you at full size.
Which No-Code Backtesting Approach Should You Use?
Start with automated backtesting when your strategy is rules-based and you want to prove statistical profitability across a large sample fast. Describe it in plain English, run it, and let Zella AI analyze the results.
Use manual replay when your strategy is discretionary or you want to practice execution under decision pressure. Step through historical charts and place trades with real order types.
Add journal validation when you already have 100+ live trades logged with consistent tags and want to test a specific filter, like "would removing Friday afternoon trades improve my profit factor?"
Finish with forward testing when your backtest shows a promising edge and you need to confirm it holds with real money at reduced size before committing full size.
TradeZella handles the full workflow in a single platform. Automated backtests, manual replay trades, live trades, and forward-test trades all live in the same journal, use the same Strategy tags, and appear in the same analytics dashboard. You never export data or switch tools.
Key Takeaways
No-code backtesting has two methods, and both skip the code. Automated (describe rules in plain English, engine runs them) and manual replay (step through charts bar by bar). Automated is fastest for rules-based strategies; manual replay is best for discretionary judgment.
You do not need to code either way. TradeZella gives you 11+ years of data, all order types, auto position sizing, and auto-journaling for every backtested trade.
Automated backtesting adds AI analysis. Zella AI reads the full trade log and surfaces time-of-day, day-of-week, and condition-based patterns a summary statistic hides.
Journal validation and forward testing complete the loop. Backtesting develops the strategy, journal validation tests filters on trades you already took, forward testing confirms the edge holds with real money.
Sample size matters. 50+ for a backtest, 50 per group for journal splits, 20 to 30 for forward testing.
TradeZella handles the full workflow. Automated, manual, live, and forward-test trades all live in the same journal and analytics.
Frequently Asked Questions
Is automated backtesting also no-code backtesting?
Yes. Automated backtesting is a form of no-code backtesting, and arguably the most complete one, because you do not write code and you do not place trades manually. You describe your strategy in plain English and the engine runs it across historical data. The other no-code method is manual replay, where you step through charts bar by bar and place trades visually. TradeZella offers both, so "backtesting without code" covers automated testing for rules-based strategies and manual replay for discretionary ones.
What is the difference between automated and manual no-code backtesting?
Automated backtesting runs your rules for you. You describe the strategy in plain English, the engine executes every matching trade across years of data in minutes, and Zella AI analyzes the results. Manual replay puts you in the driver's seat: you watch price action bar by bar and place trades yourself, which tests your real judgment and execution. Automated is faster and better for rules-based strategies. Manual replay is better for discretionary strategies and for practicing execution.
Can I backtest without knowing how to code?
Yes. You can either describe your strategy in plain English and let the automated engine run it, or step through historical charts bar by bar and place trades visually. TradeZella provides 11+ years of historical data, all standard order types, and automatic result tracking for both methods. You do not need to write a single line of code, and every backtested trade logs directly into your journal for analysis.
How many trades do I need for a reliable no-code backtest?
You need a minimum of 50 trades, with 100 or more ideal for confident conclusions. For journal-based validation with holdout splits, each group should have at least 50 trades. Per-setup filter tests need at least 30 trades to be directionally useful. Below these minimums, random variation makes it impossible to distinguish real patterns from noise.
Can I backtest a discretionary strategy?
Yes, and this is where manual replay has its biggest advantage. Run two parallel sessions: one following only your objective entry criteria, and one applying your full discretionary judgment. Compare the two Strategy results in your analytics dashboard to see whether your judgment adds or subtracts value.
What is the difference between backtesting and forward testing?
Backtesting uses historical data with no real money at risk and minimal psychological pressure. Forward testing applies your strategy to new, unseen live market data with real capital, usually at reduced size. Forward testing reveals execution challenges and emotional pressures that backtesting cannot replicate. Both are necessary: backtesting develops the strategy, forward testing confirms it works live.
Can I use my existing journal data for backtesting?
Yes, if your journal consistently records entries, exits, setup tags, timestamps, position sizes, and stop-loss levels across at least 100 trades. Journal-based validation is best for testing filters and refinements on strategies you already trade, for example whether removing trades taken during certain hours would improve your profit factor. It complements backtesting, which is better for testing entirely new strategies.
Do I need backtesting software or can I use a spreadsheet?
A spreadsheet can handle basic journal filtering, but it cannot do backtesting at all. Once you need to describe a strategy for the engine to run, step through historical charts, or compare results across Strategies, you need dedicated software. TradeZella handles automated backtesting, manual replay, journal validation, and forward-test comparison in a single platform.
What is the best no-code backtesting software?
The best no-code backtesting software lets you test a strategy without writing Python, Pine Script, or any programming language. Several tools qualify: TrendSpider and NinjaTrader's Strategy Builder let you build conditions from dropdown menus, Forex Tester and other replay tools let you step through charts by hand, and Composer.trade uses plain English for automated ETF and stock portfolio strategies. For most traders who want to describe a strategy in plain English, run it across years of data in seconds, see every trade with the setup drawn on the chart, and have the results feed a full journal and AI analysis, TradeZella is the best no-code backtesting software.