How to Find Your Trading Edge (A Data-Driven Approach)
How to Find Your Trading Edge (A Data-Driven Approach)
Most traders search for an edge in indicators and strategy videos. The real edge is already sitting in your trade data. This guide walks through a 5-step process to extract your most profitable setup, time window, and market conditions from your journal, with a running example showing how one trader turned a 50% win rate into a focused edge with 67% accuracy and 2.3R expectancy.
class SampleComponent extends React.Component {
  // using the experimental public class field syntax below. We can also attach
  // the contextType to the current class
  static contextType = ColorContext;
  render() {
    return <Button color={this.color} />
  }
}
Last Updated: April 22nd, 2026
A trading edge is a repeatable statistical advantage that produces positive expected value over a large sample of trades. It is the specific combination of a setup type, time window, and market conditions where your win rate and average reward-to-risk ratio consistently produce more profit than loss. An edge is not a single winning trade, a strategy you copied from someone else, or a gut feeling. It is a pattern that appears in your data when you filter your trades by the right dimensions. The only way to find it is to journal your trades with enough detail and then run the analysis.
Most traders spend years searching for an edge by cycling through indicators, strategy videos, and trading rooms. The reality: if you have been trading for more than a few months, your edge probably already exists somewhere in your data. You just have not extracted it yet.
This article walks through a 5-step process for discovering your edge using your own trade history. We follow a running example of a trader named Marcus who found that his breakout trades before 10:30 AM had a 2.3R expectancy and a 67% win rate, while his afternoon reversal trades were losing money at -0.4R. His overall numbers looked mediocre. His filtered numbers revealed a clear edge.
Step
Action
TradeZella Report
Min. Sample
Output
1. Log
Journal 50+ trades with setup name, time, R-multiple, and custom tags
Trade Log + Strategies
50 trades total
Raw data ready for filtering
2. Filter by Setup
Compare win rate, avg R, profit factor, and P&L per Strategy
Strategy Report
15+ per setup
Best setup identified, worst setup flagged
3. Filter by Time
Break down your best setup by hour to find the "golden window"
Day & Time Report
15+ per time slot
Best time window for your best setup
4. Filter by Conditions
Tag trades by market condition, then filter best setup + time by tags
Tags Report
15+ per tag
Best conditions for your best setup + time
5. Edge Statement
Write one sentence: setup + time + conditions + metrics + sample size
Notebook
All filters combined
Your confirmed trading edge, documented
What Is a Trading Edge (And What It Is Not)?
In mathematical terms, your edge exists when your average winner multiplied by your win rate exceeds your average loser multiplied by your loss rate. This is the same formula behind trading expectancy. A positive expectancy means you have an edge. A negative one means you do not.
What an edge is not:
Not a single winning trade. One great trade proves nothing statistically. You need at least 30 trades on a specific setup before the numbers start becoming meaningful, and 50 or more before you should trust them.
Not someone else's strategy. Until you have traded a setup yourself and measured the results over enough trades, it is that person's edge, not yours. Your execution, timing, and risk tolerance shape the outcome.
Not a feeling. "I am good at reading price action" is not an edge. "My VWAP bounce entries between 9:45 and 10:30 AM produce a 1.8 profit factor over 87 trades" is an edge. The difference is data.
Why Do Most Traders Never Find Their Edge?
Two reasons dominate.
No data. If you are not journaling your trades with full details (setup type, entry reason, time of day, market conditions, emotional state), you have no raw material to analyze. You cannot discover an edge you did not record. This is why journaling from Day 1 matters, even during paper trading. Our trading tutorial for beginners covers how to set this up in your first week.
Aggregate analysis. Most traders who do journal still evaluate their trading in aggregate. They look at overall win rate and overall P&L. But aggregate numbers hide the signal inside the noise. You might have a 50% overall win rate that is composed of a 72% win rate on one setup and a 31% win rate on another. The profitable setup is subsidizing the losing one, and you cannot see it without filtering.
A third, subtler reason: lack of trading discipline. If you are not following your own rules consistently, your data becomes contaminated. Trades taken off-plan pollute the sample. Before searching for your edge, make sure your Rule Adherence Score is above 75%. Otherwise, you are analyzing noise, not signal.
How Do You Find Your Trading Edge? The 5-Step Process
Step 1: Journal 50+ Trades with Full Setup Details
Every trade you log needs these fields: the setup name, entry time, exit time, entry price, exit price, stop loss level, target level, position size, actual R-multiple, and any custom tags you want to track (market conditions, emotional state, session type).
The setup name is the most critical field. Without it, you cannot filter by strategy. If you do not name your setups, every trade looks the same in your data.
In TradeZella, you create a Strategy for each setup. A Strategy is a named template with your entry criteria, exit rules, and stop loss rules defined. Every trade you log gets assigned to a Strategy, which makes filtering automatic.
TradeZella Strategy
What to do: Create a Strategy for each setup you trade regularly. If you are unsure how to define setups, start with 2 to 3 that describe your most common entries (e.g., "Breakout," "VWAP Bounce," "Pullback to Moving Average"). Use the Position Size Calculator and free trading calculators to standardize your risk per trade so R-multiples are consistent. After 50 or more trades, you will have enough data per setup to start finding patterns.
Step 2: Filter Your Analytics by Setup Type
This is where aggregate numbers become actionable. Pull up your analytics and filter by Strategy. For each setup, examine four metrics: win rate, average R-multiple, profit factor and total P&L. If you need a refresher on how these metrics work together, our guide on how to analyze trading performance covers all five core metrics in depth.
Here is what Marcus found when he compared his three setups over 73 trades:
Marcus's aggregate win rate was 50%. Not bad. Not great. But when filtered, the picture changed completely. His breakout trades were carrying the account. His afternoon reversals were draining it. Without the filter, he would never have known.
TradeZella Strategy Reports
What to do: Open your Strategy comparison report. Rank setups by profit factor. Any setup with a profit factor below 1.0 over 15 or more trades is a candidate for elimination. Any setup above 1.5 over 20 or more trades deserves deeper analysis in the next steps.
Step 3: Filter by Time of Day
Your best setup might perform differently depending on when you trade it. This is one of the most overlooked dimensions in trading performance.
When Marcus filtered his profitable breakout trades by time window:
His edge was not just "breakouts." It was "breakouts before 10:30 AM." The same setup in the afternoon was a losing proposition. This is a common pattern: the first 60 minutes of the session carry the most volume and momentum, which is exactly what breakout trades need.
In TradeZella, the Day & Time report gives you an hourly breakdown of your P&L, win rate, and trade count. You can filter this report by Strategy to see exactly how each setup performs at different times.
What to do: Filter your best-performing Strategy by time of day. Look for "golden hours" where both win rate and average R-multiple are above your overall average. If you find a time window where profit factor exceeds 2.0 over 15 or more trades, that is a strong signal.
Step 4: Filter by Market Conditions
The final filter layer: what was the market doing when your best trades happened?
Create custom tags for the conditions you want to track. Start with 3 to 5: "Trending Day," "Range-Bound," "High Volume," "Gap Up," "Gap Down." Apply them to every trade for at least 30 trading sessions. Then filter your best setup and time window by these condition tags.
Marcus found his morning breakouts worked best on gap days, when the market opened at least 0.3% above or below the previous close. On range-bound days, even his best setup and time window underperformed.
In TradeZella, the Tags report lets you compare performance across any custom tags you define. You can use the same tagging system you use to track trading habits for market conditions.
TradeZella Tag Report
What to do: Create 3 to 5 market condition tags. Apply them consistently for 30 or more sessions. Then filter your best setup + best time window by condition tags. The combination of all three filters (setup + time + conditions) is your edge.
Step 5: Write Your Edge Statement
After Steps 1 through 4, condense everything into a single sentence. This is your Edge Statement, and it becomes the foundation of your trading plan.
Marcus's Edge Statement: "I have a positive expectancy trading breakout setups on stocks that gap 0.3% or more at open, entering between 9:30 and 10:30 AM, with a 2.3R average and 67% win rate over 18 qualifying trades."
Your Edge Statement should include: the specific setup name, the time window, the market conditions (if applicable), and the key performance metrics (win rate, average R, profit factor, or expectancy). It should also include the sample size so you know how confident to be in the numbers.
What to do: Write your Edge Statement. Pin it in your TradeZella Notebook so it is visible before every session. If you cannot write a specific sentence with numbers, you either need more data (go back to Step 1) or your data does not show a clear edge yet (keep trading and logging).
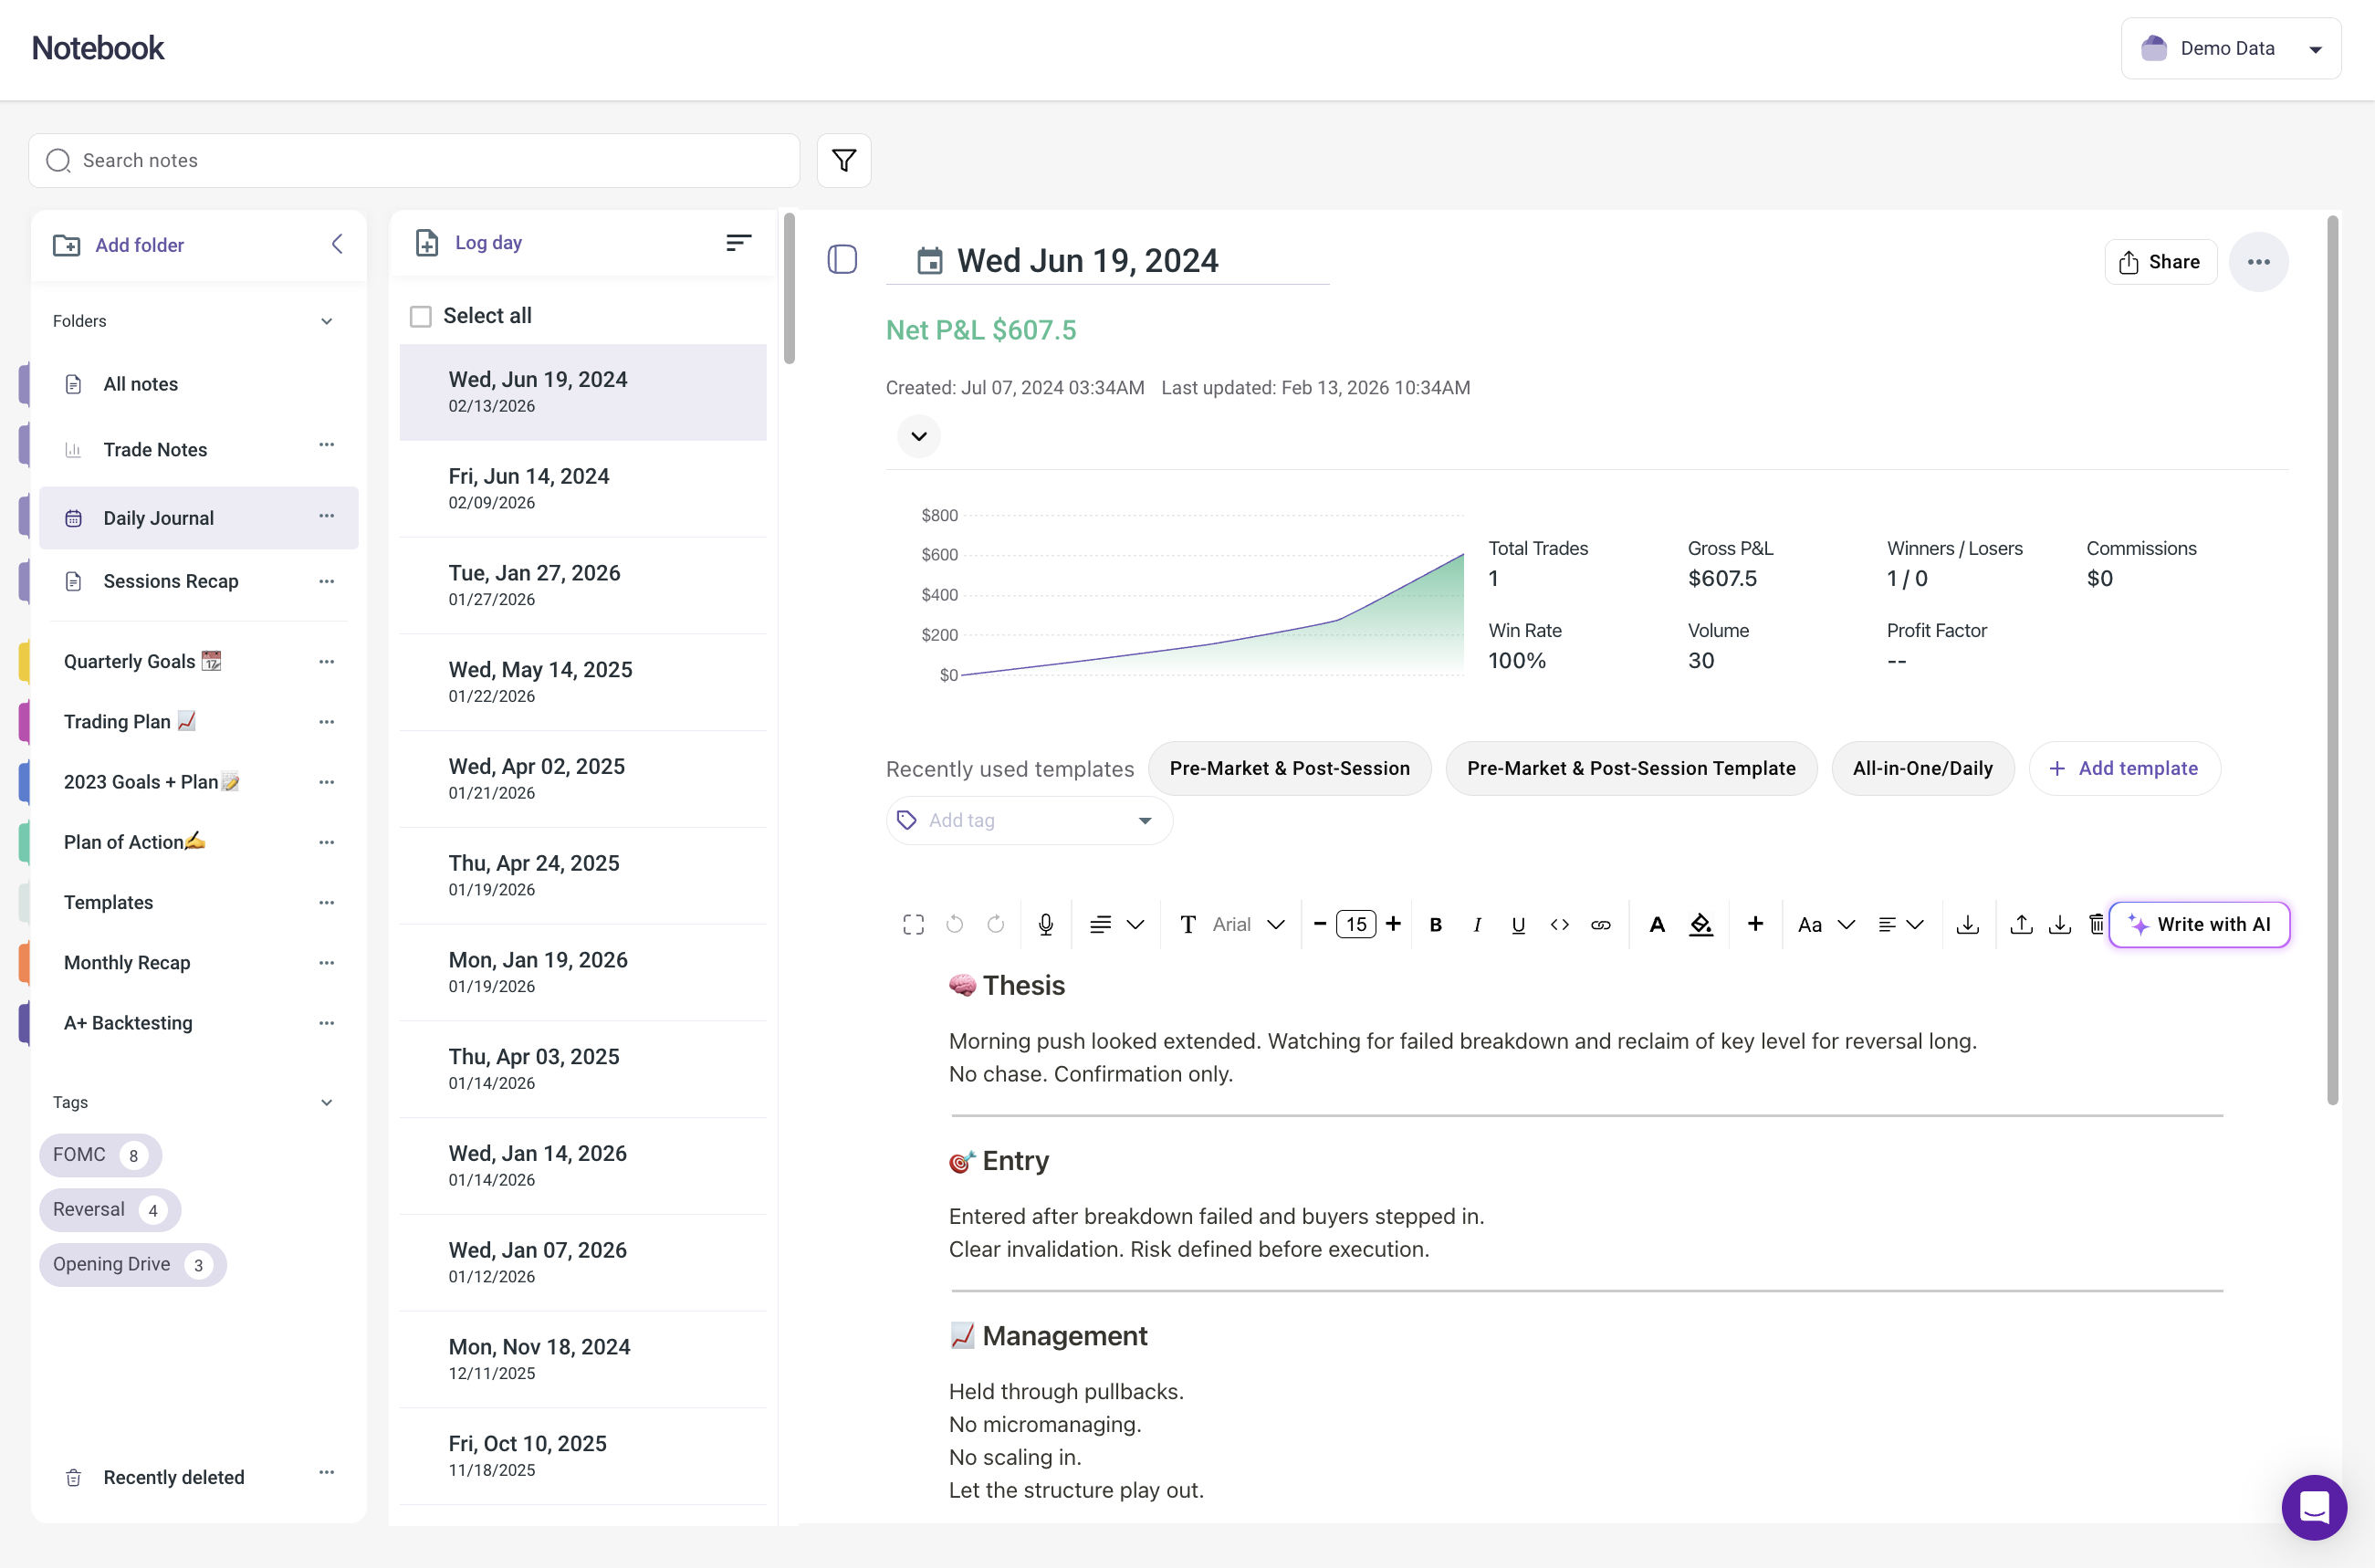
TradeZella Notebook
What Should You Do After Finding Your Edge?
Concentrate Your Trading
Restructure your daily plan around your edge. Fewer, higher-quality trades at the intersection of your best setup, time window, and conditions will produce better results than high volume spread across the full session. This directly reduces overtrading, which is one of the most common ways traders with a real edge still lose money.
Dollar example: Marcus was trading a $50,000 account with $500 risk per trade. Before finding his edge, he took 6 to 8 trades per day across all three setups. After, he concentrated on 2 to 3 breakout trades in the first hour on gap days. His total P&L went from roughly breakeven to averaging +$1,200 per week, not because he traded more, but because he traded less. Maintain your drawdown management rules during this transition. Concentrating does not mean removing your safety net.
Track Edge Metrics Monthly
Your edge is not permanent. Markets evolve, volatility shifts, and strategies that worked in one environment can weaken in another. Set a monthly checkpoint where you re-run the same 5-step analysis on the most recent 30 to 60 days of data.
Build this into your trade review process. Weekly reviews catch execution problems. Monthly reviews catch edge degradation. If your profit factor on your primary edge drops below 1.2 for two consecutive months, it is time to investigate whether market conditions have shifted.
Expand Systematically
Once your primary edge is confirmed over 50 or more trades with the filters applied, start developing a second one using the same 5-step process. Most consistently profitable traders run 2 to 3 confirmed edges. Each edge should be validated through the full process independently.
You can also use backtesting to test potential new edges on historical data before risking capital. The system-building framework covers how to move from a hypothesis to a confirmed edge through backtest, forward test, and live test phases.
What Are the Most Common Mistakes When Searching for an Edge?
Too small a sample size. You need a minimum of 15 to 20 trades per segment when filtering. If slicing by setup + time + conditions gives you fewer than 15 trades in a segment, that segment is not yet statistically meaningful. Widen the time period or combine similar conditions.
Confusing a lucky streak with an edge. A cluster of wins over 2 weeks is not an edge. An edge persists across months. You need at least 6 to 8 weeks of data before treating a pattern as confirmed.
Ignoring losing setups. Marcus's single biggest improvement came from stopping his afternoon reversal trades entirely. Removing a -0.6 profit factor setup improved his overall numbers immediately. Cutting losers is as valuable as amplifying winners.
Over-optimizing. If you keep slicing data until you find a profitable micro-segment with 8 trades, you have not found an edge. You have found randomness. Every filter you add reduces sample size. Keep each final segment above 15 trades minimum.
Emotional interference. Trading tilt contaminates your data. If you took 5 revenge trades after a loss, those trades pollute the analysis for that setup and time window. Tag tilt trades separately and exclude them from your edge analysis. Analyze your tilt cost separately.
Looking for someone else's edge. Your edge is shaped by your personality, risk management approach, schedule, and market knowledge. A scalper's edge looks nothing like a swing trader's edge. The process is the same, but the output is uniquely yours.
Prop Firm Traders: Finding your edge before attempting an evaluation is not optional. Prop firm challenges have hard drawdown limits and time constraints. If you do not know your best setup, best time window, and best conditions before starting, you are gambling with the evaluation fee. Run the 5-step process on your personal account or paper trading data first. Then apply that edge to the evaluation with the confidence of real numbers behind it. TradeZella's Prop Firm Sync lets you track evaluation progress alongside your edge metrics in the same dashboard.
Key Takeaways
Your trading edge is the specific combination of setup, time of day, and market conditions where you have a demonstrated statistical advantage.
You need 50 or more logged trades with full details before this analysis becomes meaningful. Each filtered segment needs at least 15 trades.
Filter by setup type first. Any setup with a profit factor below 1.0 over 15 or more trades should be paused or eliminated.
Filter your best setup by time of day to find your "golden window" where metrics peak.
Filter by market conditions using custom tags to identify which environments amplify your edge.
Write an Edge Statement: one specific sentence with your setup, time, conditions, and performance metrics.
Review your edge metrics monthly. An edge is not permanent. Markets shift, and your data should tell you when to adapt.
TradeZella's Strategy comparison report and Day & Time analytics automate Steps 2 and 3 of this process. You create a Strategy for each setup, and the platform filters your win rate, profit factor, and R-multiple by setup and time window automatically.
How many trades do I need before I can find my edge?
A minimum of 50 trades total, with at least 15 to 20 per individual setup. The more trades you have, the more reliably you can filter by multiple dimensions. Traders with 200 or more logged trades can slice by setup, time, and conditions simultaneously and still have meaningful sample sizes in each segment. If you are starting from scratch, plan on 2 to 3 months of consistent journaling before running the full analysis.
Can I have more than one trading edge?
Yes, and most consistently profitable traders do. The key is confirming each edge independently with its own data. Do not try to develop three edges at once. Master one, confirm it over 50 or more qualifying trades, then start the 5-step process again for a second setup. Two confirmed edges with specific conditions outperform five unvalidated setups every time.
What if my data shows I have no edge in anything?
This is valuable information. If no filter combination produces a profit factor above 1.0, you need to investigate two things. First, check your execution. If your Rule Adherence Score is below 75%, the problem might be trading discipline, not strategy. Second, if execution is clean but no setup is profitable, you may need to rethink your strategy entirely. Consider paper trading new setups and running the 5-step process on those results.
How often should I re-evaluate my edge?
Monthly is the right cadence for a full re-evaluation. Track your edge metrics weekly as part of your regular review. If profit factor or win rate on your primary edge drops significantly for 3 or more consecutive weeks, move the full re-evaluation up. Market regimes shift, and an edge that worked in a trending market may weaken when conditions turn range-bound.
Does my edge change when I switch markets or timeframes?
Almost always, yes. A breakout edge in large-cap stocks does not automatically transfer to futures or forex. If you change markets, instruments, or timeframes, treat it as building a new edge from scratch. Run all 5 steps on the new market data. You may find similar patterns, but the specific numbers (win rate, average R, best time window) will likely be different.
Can I find my edge using a spreadsheet instead of a dedicated tracker?
You can calculate the basic metrics manually, but the filtering is where spreadsheets break down. Steps 2 through 4 require filtering by setup, then by time, then by conditions, and comparing metrics across each segment. In a spreadsheet, this means complex pivot tables and formulas that become brittle at scale. If you take more than 3 to 5 trades per day, a dedicated tracker with built-in filtering saves hours per week. Our trading journal vs spreadsheet comparison covers the full breakdown, and the best trading trackers comparison reviews your options.
What is a good profit factor for confirming an edge?
A profit factor above 1.3 over 30 or more trades is a meaningful edge. Above 1.5 is strong. Above 2.0 is excellent but check your sample size carefully, because very high profit factors on small samples often regress toward the mean as you add more trades. If your profit factor is between 1.0 and 1.2, you have a marginal edge that could disappear with a few bad trades. Keep collecting data before restructuring your trading around it.