A complete walkthrough of TradeZella's backtesting feature. Learn how to create sessions, replay historical data, place trades, tag setups, analyze performance metrics, and compare backtest results against your live trading journal.
class SampleComponent extends React.Component {
  // using the experimental public class field syntax below. We can also attach
  // the contextType to the current class
  static contextType = ColorContext;
  render() {
    return <Button color={this.color} />
  }
}
Last Updated: May 13th, 2026
Backtesting with TradeZella means replaying historical market data and placing trades as if you were live, with every trade automatically logged to your journal for analysis. Unlike bar replay tools that only show you price movement, TradeZella's backtesting combines order execution, automatic journaling, Strategy tracking, and 50+ analytics reports in one platform. You test a strategy against 11+ years of data across stocks, forex, crypto, and futures, then compare those results directly against your live trades in the same dashboard.
Most traders skip backtesting because the process feels disconnected from real trading. You test in one tool, journal in another, and analyze in a third. By the time you compare backtest results to live performance, the data lives in three different places and the comparison never happens.
TradeZella solves this by keeping everything in one platform. Your backtested trades sit alongside your live trades. Your Strategy performance shows backtest and live results side by side. When something breaks down in live trading, you can pinpoint exactly where execution deviates from what the backtest predicted.
If you want to understand the theory behind backtesting first, read our guide on backtesting trading strategies. For a hands-on walkthrough with a real trade example, see how to backtest a trading strategy. For a comparison of backtesting platforms, see best backtesting software. This article focuses specifically on how to use TradeZella's backtesting feature step by step.
Here is how to set up and run a backtest in TradeZella, from session creation to live comparison.
Backtesting Step
What You Do
TradeZella Feature
Why It Matters
Minimum Target
1. Define Rules
Write entry, exit, stop, and filter criteria
Notebook + Strategy creation
Prevents ad hoc decisions that inflate results
Written rules before starting
2. Create Session
Select instrument, balance, date range, timeframe
11+ years data, up to 5 symbols, seconds timeframe
Realistic conditions match live trading
12-18 months of data
3. Replay + Trade
Play the market forward and execute trades
All order types, auto position sizing, auto breakeven, manual partials, Go-To
50+ reports, Strategy comparison, tag filtering, calendar
Identifies whether the strategy has a real edge
50+ trades (100+ ideal)
6. Compare to Live
Match backtest metrics against live execution
Same dashboard for backtest + live, R-Multiple View, Strategy analytics
Pinpoints where execution deviates from strategy potential
After 30+ live trades
What Should You Define Before Starting a Backtest?
Before opening the backtesting tool, write down your strategy rules. This prevents you from making decisions during the replay that inflate your results and give you false confidence in a setup that does not actually work.
If you do not have a written trading plan yet, create one first. Your backtest is only as good as the rules you are testing. Vague criteria produce unreliable data.
What to define:
Entry criteria. The exact conditions that must be true for you to enter a trade. Be specific. "VWAP bounce with volume confirmation" is vague. "Price touches VWAP from above, the candle closes above VWAP, and volume on the bounce candle exceeds the 20-period average" is testable.
Stop loss. Where you exit if the trade goes against you. A fixed dollar amount, a percentage, or a structural level (below the setup candle's low, for example). Your risk management rules should define your maximum loss per trade before you start.
Profit target. Where you take profits. A fixed risk-reward ratio (2:1, 3:1), a structural level (previous day's high), or a trailing stop.
Filters. Conditions that keep you out. No entries within the first 5 minutes of market open. No entries against the prevailing trend. No entries 30 minutes before a major economic report.
Dollar risk. Define your per-trade risk in dollar terms. On a $50,000 account risking 1% per trade, that is $500. On a $25,000 account, that is $250. This number determines your position size for every backtest trade.
Write these rules in your TradeZella Notebook so they are right there during the backtest.
How Do You Set Up a Backtesting Session in TradeZella?
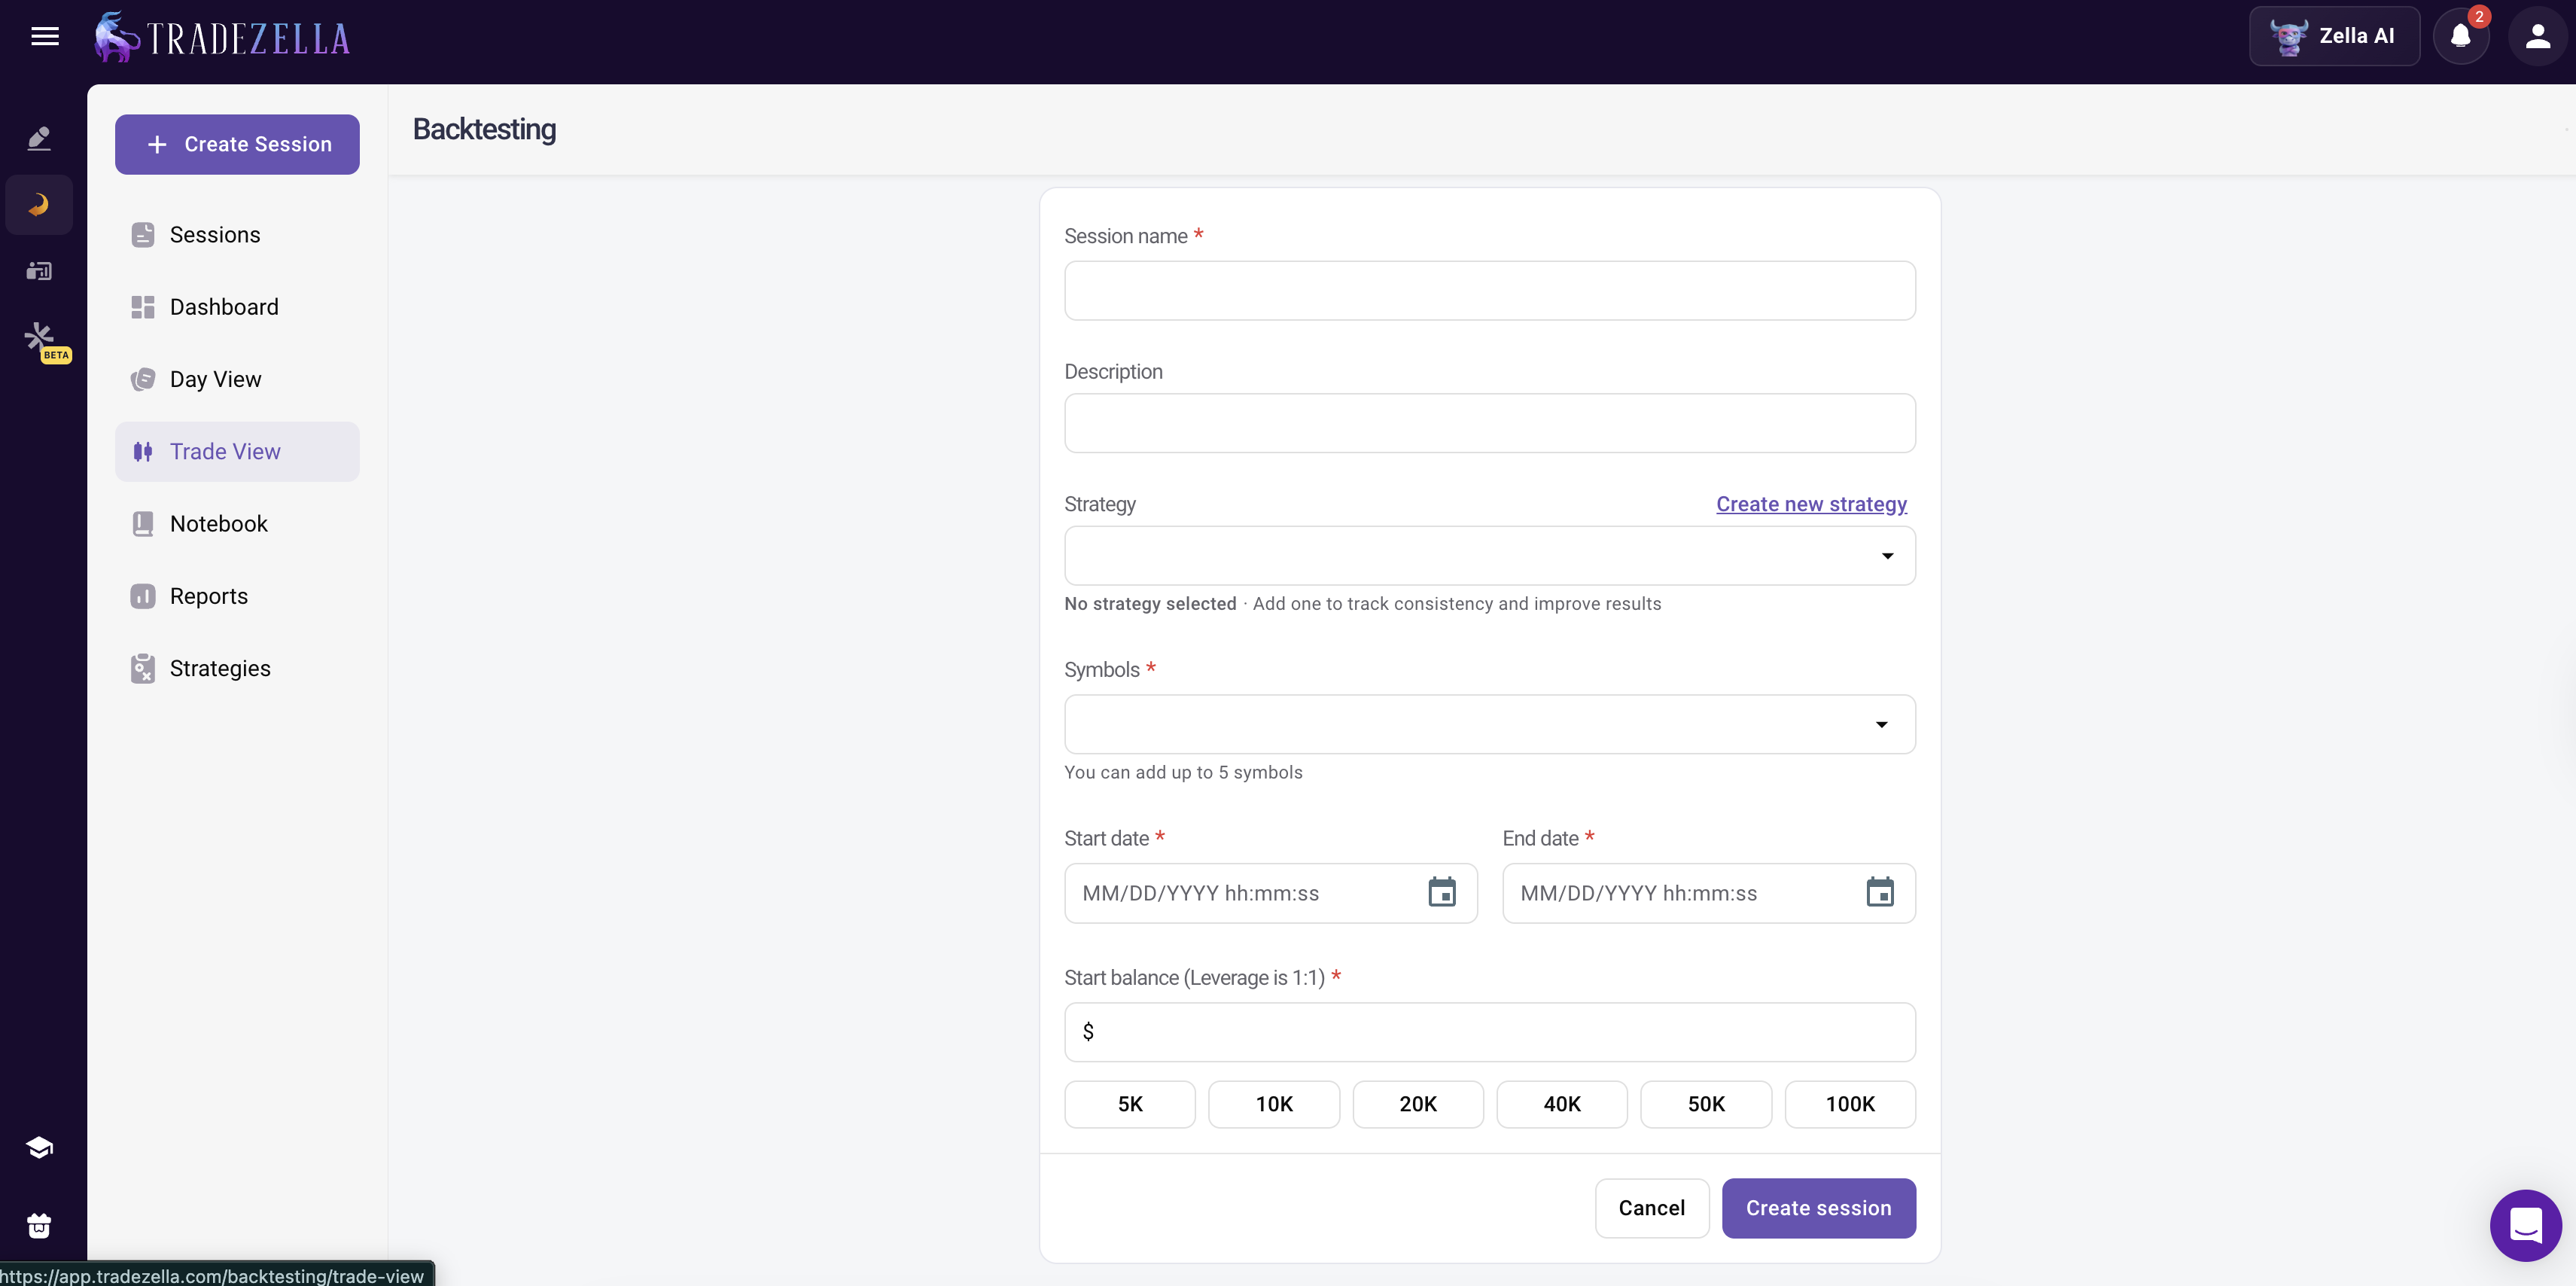
Open the backtesting feature and create a new session. Here is what you need to configure:
Choose your instrument. Select the ticker or pair you want to test. TradeZella supports stocks, forex, crypto, and futures. If your strategy works across multiple instruments, run separate backtests for each one and compare results. You can add up to 5 symbols per session and view up to 8 charts simultaneously.
Set your starting balance. Use a balance that matches your actual (or planned) account size. If you trade a $50,000 account, set the backtest balance to $50,000. This keeps position sizing realistic and makes your P&L numbers directly comparable to live results.
Select the time period. Choose a date range that covers at least 12 to 18 months and includes different market conditions. You want to test across trending markets, range-bound periods, and high-volatility events. TradeZella offers historical data going back to September 2014, so you have 11+ years to work with.
Set your timeframe. Match the chart timeframe to how you actually trade. If you use a 5-minute chart for entries, set the replay to 5-minute bars. TradeZella supports timeframes down to the second for precision day trading strategies.
Link a Strategy. If you have already created a Strategy in TradeZella (for example, "VWAP Bounce" or "Opening Range Breakout"), link it to the session. Every trade you place during the backtest will automatically be tagged with that Strategy, making it easy to filter and analyze results later.
How Do You Replay the Market and Place Trades?
Once your session is configured, the chart loads at the start of your selected date range. Use the replay controls to move the market forward:
Play/Pause. Click Play to simulate market conditions. Candles generate as if you were trading live, showing price action in real-time intervals. Press Space on your keyboard as a shortcut. Use Pause to stop the simulation at any point.
Speed control. Adjust the speed from 1x up to 10x or higher. Fast-forward through quiet periods (overnight sessions, lunch hour chop) and slow down when you are approaching a potential setup.
Forward/Back. Use the arrow keys to skip forward or backward by one candle for precise navigation.
Go-To feature. Skip to specific dates, candles, or sessions instantly instead of waiting for setups to develop. If you want to test how your strategy handles a particular earnings week or FOMC announcement, jump straight to that date.
Economic calendar. View high-impact news events directly on your chart. Toggle "Show events" above the chart to see when major economic reports land, so you can test how your strategy performs around news catalysts.
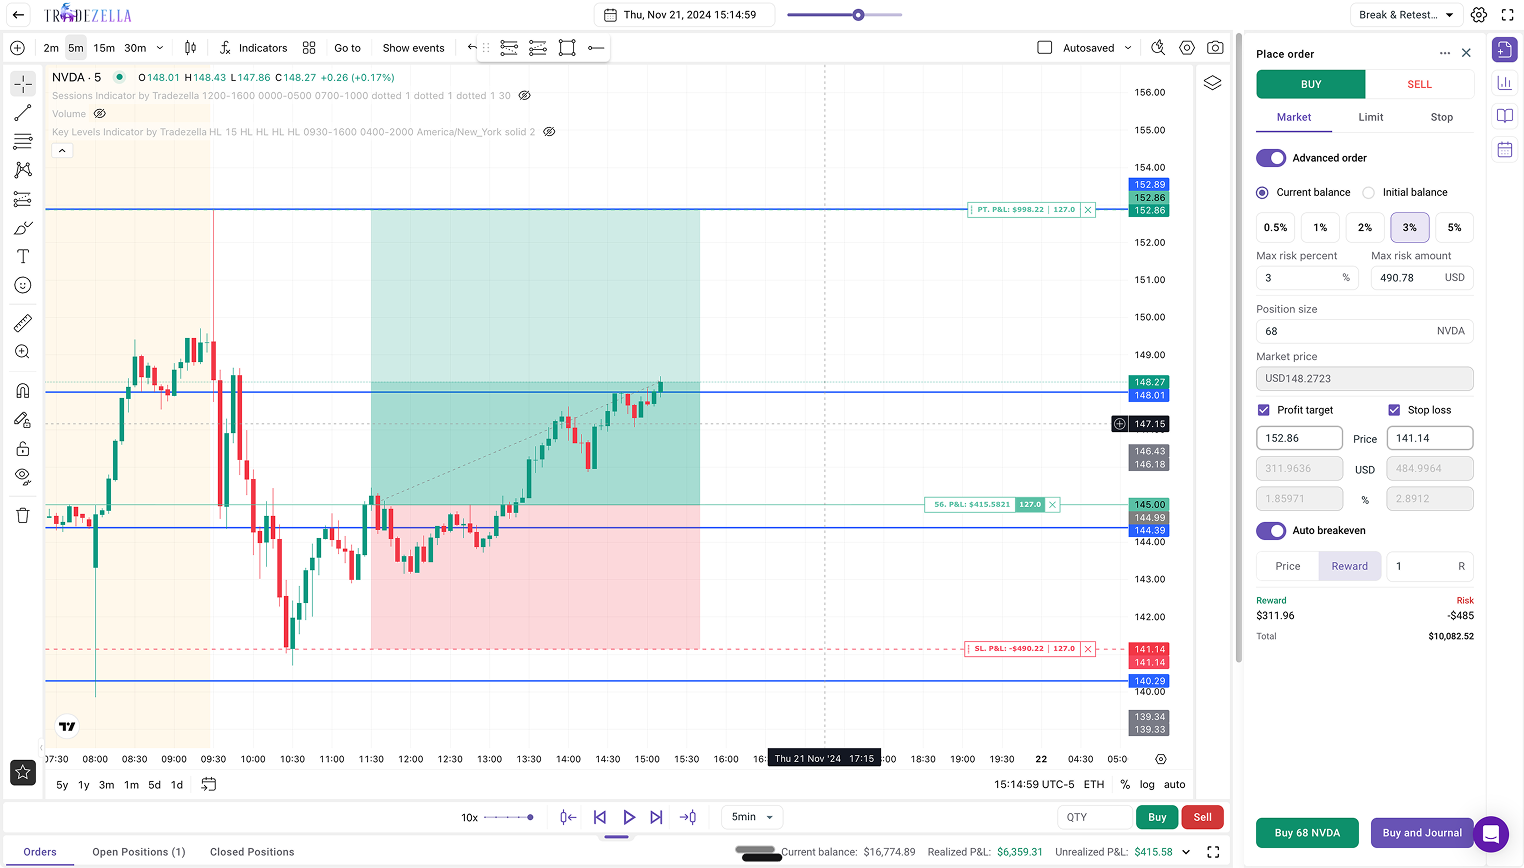
When you see a setup that meets your defined criteria, place your order:
Order types. TradeZella supports market, limit, and stop orders in backtesting. Select your order type, set your entry, and execute.
Automatic position sizing. Toggle "Advanced Order" on, select Current Balance or Initial Balance, and input your max risk percentage or dollar amount. TradeZella automatically calculates the position size for you. On a $50,000 account risking 1%, set the max risk to $500 and TradeZella figures out the correct number of shares or contracts based on your stop distance. No manual math needed. You can also use the Position Size Calculator on the free tools page to double-check your numbers.
Stop loss and profit target. Set your SL and PT by price, dollar amount, or percentage. You can also drag and drop the SL and TP levels directly on the chart after placing the order.
Auto breakeven. TradeZella can automatically move your stop loss to breakeven when price hits a target. Set the trigger by price level, R-multiple, or dollar amount.
Manual partials. Close 25%, 50%, 75%, or any custom percentage of your position at any time. This lets you test scaling-out strategies with precision.
Important: Only take trades that match your pre-defined rules. The temptation during replay is to enter trades that "look good" even if they do not meet every criterion. This defeats the purpose. Trading discipline during backtesting produces reliable data. If you would not take the trade live, do not take it in the backtest.
How Should You Tag and Journal Backtested Trades?
Every trade you place during a backtesting session is automatically logged to your TradeZella journal with entry, exit, position size, P&L, and timestamps. No manual data entry required.
But raw P&L numbers are not enough. To get real insights, add context to each trade:
Strategy tag. If you linked a Strategy to the session, trades are already tagged. If you are testing multiple setups within the same session, add specific tags to differentiate them.
Quality rating. Use custom tags to rate trade quality. Create tags like "A+ Setup" (met every criterion perfectly), "B Setup" (met most criteria), or "Off-Plan" (took it despite a missing condition). This lets you filter later and see whether your best setups actually perform best. Tracking trading habits this way turns a raw P&L number into a behavioral dataset.
Notes. Add one or two sentences about why you took the trade and anything you observed about the price action. These notes become valuable when you review the full backtest later.
Mistake tags. If you entered early, sized too large, or moved your stop, tag the mistake. Common tags: "Early Entry," "Moved Stop," "Oversized," "FOMO Entry." Knowing which mistakes cost you money in the backtest helps you avoid them when trading live.
This metadata turns a simple P&L number into a rich dataset you can filter and analyze across hundreds of trades.
How Do You Analyze Your Backtest Results?
After completing your backtest (aim for at least 50 trades as a minimum, with 100+ for stronger statistical confidence), review the performance summary in your analytics dashboard.
TradeZella gives you the same 50+ analytics reports for backtested trades that you get for live trades. Here are the metrics that matter most:
Win rate. What percentage of trades were profitable. Context matters here. Trend-following strategies often have 35 to 45 percent win rates but compensate with larger average wins. Mean reversion strategies typically run 55 to 65 percent.
Profit factor. Gross profit divided by gross loss. Above 1.5 is solid. Above 2.0 is excellent. If your profit factor is below 1.0, the strategy lost money and needs revision. On a $50,000 account, a profit factor of 1.5 means for every $1,000 you lost, you made $1,500 back.
Average R-multiple. How many units of risk your average trade returned. An average R of 1.5 means your typical trade makes 1.5 times what it risks. If you risk $500 per trade and your average R is 1.5, your average winning trade makes $750.
Maximum drawdown. The deepest peak-to-trough decline in your equity curve during the backtest. This tells you the worst-case scenario you would need to stomach if you trade this strategy live. If your max drawdown was $4,000 on a $50,000 account, that is 8%. Read our drawdown management guide to understand how to set thresholds based on your risk tolerance.
Trading expectancy. (Win rate times average win) minus (loss rate times average loss). Positive expectancy means the strategy makes money over a large sample of trades. An expectancy of +$125 per trade means you can expect to make $125 on average for every trade you take, win or lose.
Strategy performance. If you linked a Strategy to your session, pull up the Strategy comparison report. See win rate, net P&L, average win/loss, and trade count for each Strategy you tested. This is how you find your trading edge, the specific setups and conditions where your strategy actually makes money.
Filter by tags. If you tagged setup quality during the backtest, filter for only A+ trades and see if your metrics improve. If A+ setups show a 2.1 profit factor while B setups show 0.9, the data is telling you to be more selective. Build your trading dashboard around these filtered views to track what matters most.
How Do You Compare Backtest Results with Live Trading?
This is where TradeZella's integrated platform pays off. Once you start trading your backtested strategy live, both datasets live in the same journal. You do not need to export data, build spreadsheets, or eyeball comparisons across tools.
Pull up your Strategy analytics and compare:
Backtested win rate vs. live win rate. If your backtest showed 60 percent and you are live at 48 percent, something is different in execution. Maybe you are entering late, exiting early, or taking setups that do not quite meet your criteria.
Backtested average R vs. live average R. If your backtest showed 1.8R average and you are live at 1.1R, you might be cutting winners short or not honoring your stop levels. Use the R-multiple dashboard view to compare distributions side by side.
Backtested drawdown vs. live drawdown. If you are experiencing larger drawdowns live than in your backtest, your position sizing or emotional discipline might be off.
These comparisons are the core of your trade review process. The backtest becomes a benchmark, and your journal measures how close you come to it. For a deeper framework on interpreting these metrics, see our guide on how to analyze trading performance.
What to do: After 30 live trades on a backtested strategy, run this comparison. If the gap between backtest and live performance is greater than 15 to 20 percent on any key metric, identify the cause (execution errors, emotional decisions, market condition changes) and address it before continuing at full size.
What Is the Difference Between Backtesting and Trade Replay?
TradeZella offers two replay features that serve different purposes. Understanding the difference helps you use the right tool at the right time.
Backtesting replays historical data you have never traded. You are simulating trades to test whether a strategy works. The data is new to you, the trades are hypothetical, and the goal is to validate your rules before risking real money.
Trade Replay replays trades you have already taken live. You are reviewing your actual executions, second by second, to understand what happened and why.
Use backtesting before you trade a strategy live. Use Trade Replay after you trade to review your execution. Together, they create a complete feedback loop: backtest to set expectations, trade live, replay to diagnose gaps, adjust, and repeat.
What Are the Best Practices for Backtesting in TradeZella?
Do not cherry-pick. Test the full date range, including periods where the setup loses money. If you skip the losing months, your backtest is fiction.
Model realistic costs. Account for commissions and estimated slippage in your results. A strategy with $0.50 average profit per trade might be breakeven after costs.
Test one Strategy at a time. Do not mix setups in the same backtest session unless you are tagging them separately. Run a separate test for each Strategy so you get clean, isolated performance data. This is the same principle behind building a trading system: isolate variables before combining them.
Use the Go-To feature. Instead of watching hours of uneventful price action at 10x speed, skip directly to dates and sessions where your setup is likely to trigger. This cuts backtesting time dramatically without sacrificing data quality.
Save your chart settings. Lock in your preferred indicators and chart layout so they load automatically every session. You should not be reconfiguring your workspace every time you open a backtest.
Retest periodically. Market conditions change. A strategy you backtested in 2024 might behave differently in 2026 market structure. Re-run your backtests annually or whenever market conditions shift significantly (new volatility regime, structural change in the instrument).
Keep your trading discipline score high. If you tag rule-following during the backtest, you can calculate your Rule Adherence Score. Aim for 90 percent or higher. Anything below 80 percent means your backtest data includes too many off-plan trades to be reliable.
Backtesting for Prop Firm Traders, If you are preparing for a prop firm evaluation, backtesting is how you validate your strategy against the firm's specific rules before risking your evaluation fee. Set your backtest starting balance to the evaluation account size (for example, $100,000 for an FTMO challenge). Set your max drawdown threshold to match the firm's limit (usually 5% total, 10% trailing). Track daily P&L in the backtest to make sure no single day exceeds the daily loss limit. If your strategy cannot pass these thresholds in a backtest across 3+ months of historical data, it will not pass them live. For a complete guide to evaluation preparation, read prop firm trading.
What Is Coming Next to TradeZella Backtesting
TradeZella is introducing automated no-code backtesting, where traders describe strategies in plain English and the engine runs them across years of historical data. Every individual trade the engine executes is visible in a detailed trade log, with Zella AI analysis on the session results. No Python, no PineScript, no coding required. TradeZella is also rolling out scenario backtesting with pre-built strategy templates that let you practice specific setups on targeted historical conditions, so you build repetition on the exact patterns you want to master.
Key Takeaways
Define your strategy with exact entry, exit, stop, and filter rules before opening the backtesting tool. Write them in your TradeZella Notebook.
Set your backtest balance to match your real account size so P&L numbers and position sizing are directly comparable to live trading.
Use automatic position sizing (Advanced Order mode) to let TradeZella calculate share or contract count based on your risk percentage and stop distance.
Tag every backtested trade with Strategy, quality rating, and mistake tags for richer analysis beyond raw P&L.
Analyze results using win rate, profit factor, average R-multiple, max drawdown, and expectancy. Filter by tags to find your highest-quality setups.
Compare backtest metrics with live performance in the same platform after 30+ live trades. If any key metric deviates by more than 15 to 20 percent, diagnose the cause before continuing at full size.
Use the Go-To feature to skip to relevant dates and cut backtesting time without sacrificing sample size.
Frequently Asked Questions
How much historical data does TradeZella have for backtesting?
TradeZella provides over 11 years of historical data going back to September 2014. This covers stocks, forex, crypto, and futures across multiple market cycles, including bull markets, bear markets, and high-volatility periods.
Does TradeZella automatically journal backtested trades?
Yes. Every trade you place during a backtesting session is automatically logged to your TradeZella journal with entry price, exit price, position size, profit and loss, and timestamps. You can add notes, tags, and link Strategies without any manual data entry.
How many trades should I include in a backtest?
Aim for at least 50 trades as a minimum, with 100 or more providing stronger statistical confidence. The more trades in your sample, the more reliable your performance metrics. If your strategy triggers infrequently, extend the date range or test across additional instruments.
Can I backtest discretionary strategies in TradeZella?
Yes. The replay feature lets you step through historical charts bar by bar and enter trades manually when you see your setup. This is ideal for discretionary strategies that involve judgment calls beyond purely mechanical rules. You control the speed and can pause at any point to evaluate the chart.
What is the difference between backtesting and Trade Replay in TradeZella?
Backtesting replays historical data you have never traded to test whether a strategy works. Trade Replay replays trades you have already taken live, second by second, to review your actual execution. Trade Replay includes Level 2 and Time and Sales data. Backtesting is for strategy validation. Trade Replay is for execution review.
How do I know if my backtest results will hold up in live trading?
Compare your backtest metrics with live performance after 30 or more live trades on the same strategy. If your live win rate, profit factor, and average R-multiple are within 15 to 20 percent of your backtested numbers, the strategy is translating well. Larger gaps usually point to execution differences such as late entries, early exits, or emotional decisions rather than strategy failure.
Can I use TradeZella backtesting to prepare for a prop firm evaluation?
Yes. Set your backtest starting balance to match the evaluation account size and configure your risk limits to match the firm's rules (daily loss limit, maximum drawdown). If your strategy cannot stay within the firm's thresholds across several months of historical data, you know it needs adjustment before you pay the evaluation fee.