Automated Backtesting Inside TradeZella: From Plain English to Results in Minutes
Automated Backtesting Inside TradeZella: From Plain English to Results in Minutes
A step-by-step visual walkthrough of TradeZella's automated backtesting. Write your strategy in plain English, run it across months of market data, and review every individual trade on a chart.
class SampleComponent extends React.Component {
  // using the experimental public class field syntax below. We can also attach
  // the contextType to the current class
  static contextType = ColorContext;
  render() {
    return <Button color={this.color} />
  }
}
Last Updated: July 15, 2026
Automated backtesting lets you write a trading strategy in plain English and run it across months or years of historical market data in minutes, not months. Instead of clicking through bars one at a time in manual replay, you describe your entry rules, exit rules, stop loss, and target in a text box. Zella AI parses your description into structured trading rules, runs every trade automatically, and delivers a full results dashboard with every individual trade visible on a chart. TradeZella offers plain English automated backtesting with built-in ICT indicators, pre-built templates, and AI-powered analysis of your results.
This tutorial walks through every step of the process, from typing your first strategy to inspecting individual trades on a chart. If you want the conceptual overview of what automated backtesting is and why it matters, start there. This article shows you exactly how the automated backtesting feature works inside TradeZella, step by step.
How Does Automated Backtesting Work in TradeZella?
The entire process takes a few simple steps: navigate to the backtesting section, describe your strategy, fill in any missing details, confirm the parsed setup, run the backtest, and review your results. Most traders complete the setup in under two minutes. The backtest itself runs in two to three minutes depending on the time period and complexity. Here is each step in detail.
How Do You Start an Automated Backtest?
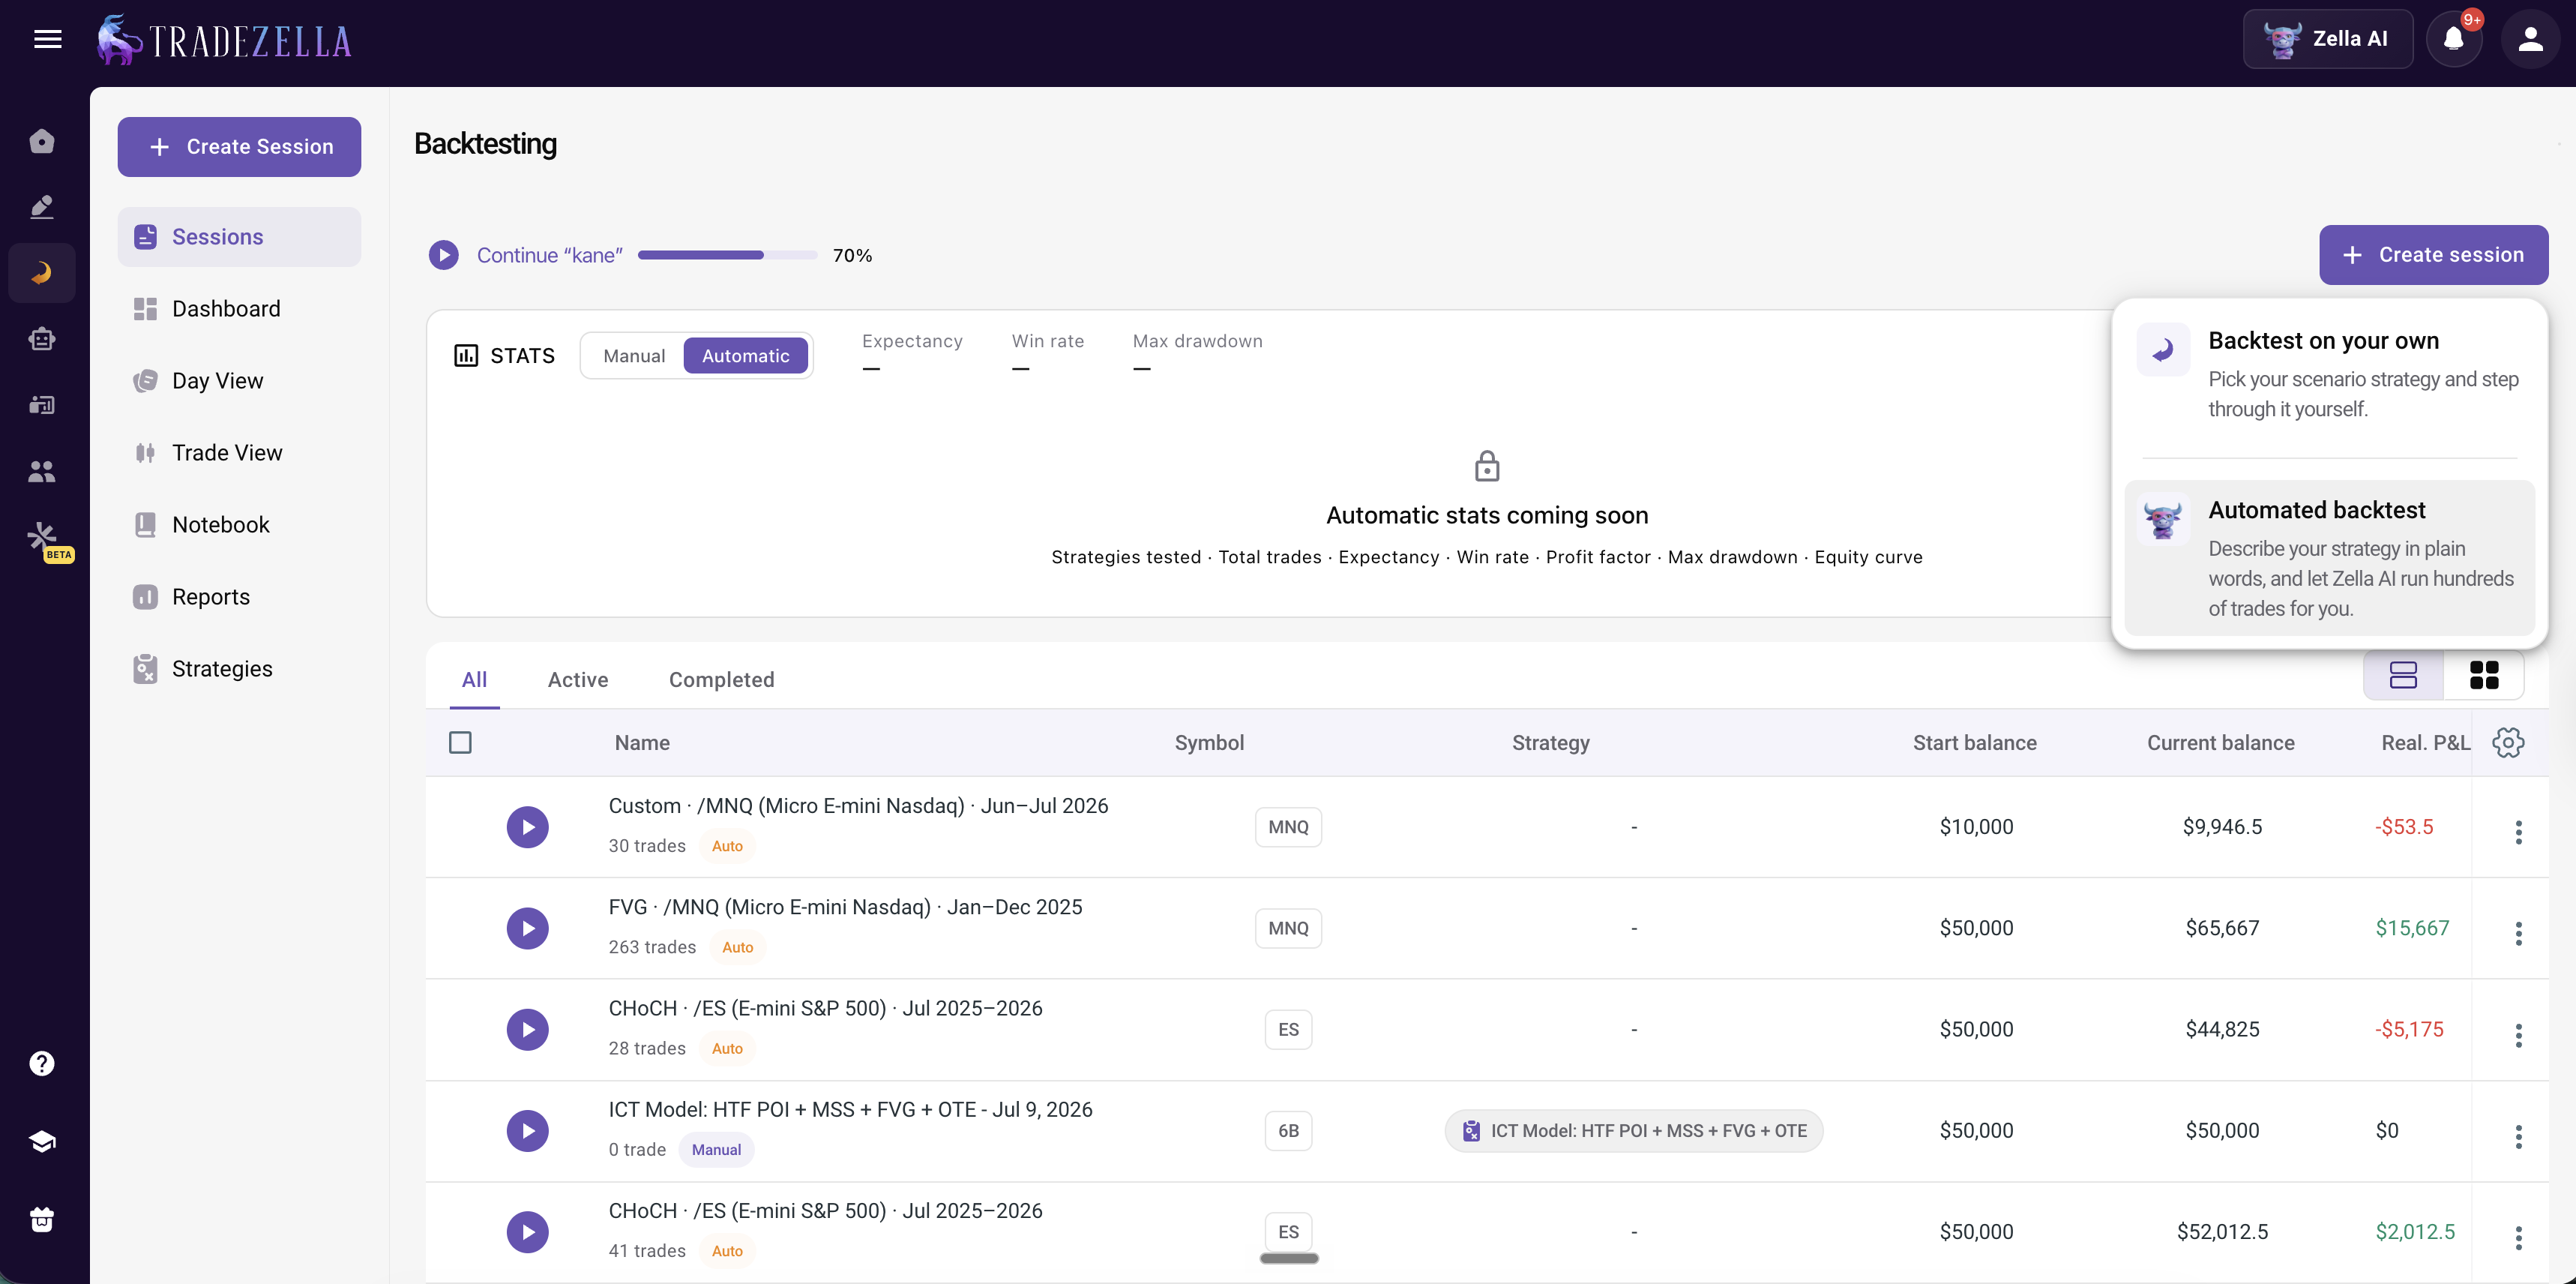
To start an automated backtest in TradeZella, go to the Backtesting tab in the left sidebar. Click the "Create Session" button in the top right corner. A dropdown appears with two options: "Backtest on your own" (manual bar replay where you step through it yourself) and "Automated backtest" (describe your strategy in plain words and let Zella AI run hundreds of trades for you). Select "Automated backtest" to begin.
Step 1: Describe Your Strategy in Plain English
When you open a new automated backtest in TradeZella, you see a text box with a simple prompt: "Describe entry, exit, stop, target, position sizing..." You write your strategy the same way you would explain it to another trader.
For example, an EMA crossover strategy looks like this:
"Go long when the 9 EMA crosses above the 21 EMA on the 5-minute chart; go short when the 9 EMA crosses below the 21 EMA. Place the stop loss just beyond the most recent swing low (for longs) or swing high (for shorts). Target a 2R take profit. Exit early if an opposite EMA crossover occurs before the target is reached."
That is the entire input. No Pine Script, no Python, no MQL5. Plain English.
A checklist below the text box confirms your strategy covers all four essential components: entry/exit criteria, stop loss strategies and profit taking, markets and trading days, and trade holding. Green checkmarks appear as Zella AI detects each component in your description.
Use the Enhance Button
After writing your strategy, you can click the "Enhance" button. Zella AI reviews your description and adds any missing details, clarifies ambiguous language, and strengthens the rules for more precise execution. This is optional. If your strategy description already covers everything, you can skip straight to "Continue."
Or Start From a Pre-Built Template
If you do not want to write from scratch, the sidebar shows pre-built templates you can use as starting points. Each template is a complete strategy with entry rules, exit criteria, stops, and targets already defined. Templates include ICT concepts like 4h FVG + CHoCH + SMT, Asian range manipulation, iFVG Trading Model, and Break and Retest, all configured for futures instruments like /MNQ and /MES.
Every template is tagged by asset class (Futures), style (Intraday), and methodology (ICT, SMT). Click any template to pre-fill the strategy box, then customize it to match your own rules. This is especially useful if you trade fair value gap trading patterns or other ICT concepts and want a starting point that already understands the terminology.
Step 2: Add Controls (Optional)
Before continuing, you can click "+ Add" to open the controls panel. Controls are structured settings that override any conflicting information in your strategy text. The available controls are:
Symbol: Which instrument to backtest (ES, NQ, MES, MNQ, stocks, forex pairs)
Sessions: Limit trades to specific market sessions (New York, London, Asia, or custom windows)
Period: How far back to test (last 3 months, 6 months, 12 months, or custom dates)
Trading days: Which days of the week to include
Risks: Maximum risk per trade or position sizing rules
Stop losses: Override or add stop loss rules
Profit taking: Override or add take profit targets
Additional exit controls: Time-based exits, trailing stops, or other exit conditions
Controls are optional. If you include everything in your plain English description, you do not need to add any. But if you want to guarantee a specific symbol or session window regardless of what the text says, controls give you that precision.
Step 3: Fill in Any Missing Details
After you click "Continue," Zella AI analyzes your strategy description. If any critical information is missing, it asks you structured follow-up questions instead of guessing. This typically includes four questions:
Question 1: Which market or symbol do you want to backtest? Options include ES (E-mini S&P 500), NQ (E-mini Nasdaq), MES (Micro E-mini S&P 500), MNQ (Micro E-mini Nasdaq), or you can specify your own symbol including stocks and forex pairs.
Question 2: What time period? Choose from the last 12 months, 6 months, 3 months, or specify a custom date range.
Question 3: Which trading session? Select Entire day (24/7), New York (09:30-16:00 ET), London (03:00-11:30 ET), Asia (19:00-03:00 ET), or add a custom window. You can select multiple sessions.
Question 4: What starting balance? Choose $10,000, $50,000, $100,000, or specify your own amount. This determines position sizing and percentage-based metrics.
If your strategy text or controls already specify these details, Zella AI skips the questions and moves straight to confirmation. The system only asks what it genuinely needs.
Step 4: Confirm Your Setup and Run
Before running the backtest, TradeZella shows you a confirmation page with everything Zella AI parsed from your strategy. This page displays:
Strategy name and instrument: Automatically generated from your rules (e.g., "EMA · /MES (Micro E-mini S&P 500) · Jan-Jul 2026")
Symbol, Balance, Period, and Session: All the parameters at a glance
Strategy logic: Your full plain English description with the parsed parameters appended
Entries: The specific entry conditions Zella AI extracted (e.g., EMA periods, crossover direction, source data)
Exits: Stop loss placement and profit targets parsed from your description
Trade controls: Position sizing, indicators being used (EMA(9), EMA(21), Swing Points), and any additional filters
Review this page carefully. If anything looks wrong, click the edit icon to adjust or "Go back" to modify your strategy. You can also click "Save" to save the setup as a template for future use without running it yet.
When everything looks correct, click "Run backtest." The system shows a "Preparing strategy..." screen while it processes, which typically takes two to three minutes depending on the time period and number of trades generated.
Step 5: Review Your Results Dashboard
Once the backtest finishes, you get a full results dashboard with two tabs: Overview and Trade Log.
Overview Tab
The Overview tab shows your strategy's performance at a glance:
Headline metrics: Win rate, profit factor, net P&L, total trades, and average win vs average loss. These are the first numbers you should check. A profit factor above 1.3 with at least 50 trades suggests a potentially viable edge.
Equity curve: A line chart showing your account balance over time. Look for consistent upward slope. A curve that spikes and crashes suggests the strategy is inconsistent or dependent on a few lucky trades.
Monthly P&L: A bar chart showing profit and loss by month. This reveals whether your strategy performs consistently or has large variance between periods.
Risk and return metrics: Sharpe ratio (risk-adjusted return), max drawdown management (largest peak-to-trough decline), Calmar ratio (return vs max drawdown), and Sortino ratio (downside-adjusted return). These advanced metrics help you compare strategies on a risk-adjusted basis, not just raw P&L.
Direction breakdown: How many long vs short trades the strategy took, and the win rate for each direction. If one direction significantly outperforms the other, you may want to filter your strategy to trade only in the stronger direction.
What Does Zella AI Tell You About Your Backtest?
Below the metrics, Zella AI provides a written analysis of your backtest results. This is not a generic summary. Zella AI reads the actual data and tells you what it means:
Whether the win rate and average win vs average loss combination is profitable or not
How close the strategy is to breakeven and what win rate you would need to cross it
Whether long and short performance differs significantly
The severity of your max drawdown relative to account size
Specific actionable fixes based on the data patterns
This is the difference between looking at numbers and understanding what they mean. The trading expectancy might be negative, but Zella AI tells you exactly why and what to change.
Can You See Every Individual Trade?
Yes. The Trade Log tab shows every single trade the backtest generated, in order. Each row displays the trade number, date, direction (long or short), entry price, exit price, position size, P&L, exit reason (Target Hit or Stop Hit), and running balance.
This is one of TradeZella's key differentiators. TradingView's Strategy Tester gives you an equity curve and summary stats but does not let you click into individual trades on a chart. NinjaTrader shows a trade list but requires coding to set up the backtest in the first place. Most Pine Script or Python backtests give you aggregate metrics and nothing else. TradeZella shows every individual trade so you can identify patterns that summary stats hide: are the losses clustered on specific days? Do stops get hit by one tick before reversing? Are targets too ambitious for the session?
Inspect Any Trade on a Chart
Click any trade in the log to open a detailed chart view. This shows the exact entry and exit on a TradingView chart with color-coded markers: entry price in blue, exit price in red or green, stop loss level, and target level. You can switch between timeframes (1m, 2m, 3m, 5m, 15m, 30m, 1h, 4h, 1d) to see the trade from different perspectives.
The trade detail panel also shows P&L, entry time, exit time, duration, position size, and exit reason. This level of detail turns a backtest from a numbers exercise into an execution review. You can see exactly where the strategy entered, where it placed the stop, and why it exited, just like reviewing a live trade in trade replay software.
What Happens After You Run a Backtest?
A backtest is step one. Here is what to do with the results:
If the results look promising (profit factor above 1.3, positive expectancy, max drawdown under 20% of account): Save the strategy as a Strategies entry in TradeZella, then move to backtesting vs forward testing to validate with 20-30 paper trades at reduced size before going live.
If the results are marginal (profit factor between 1.0 and 1.3): Look at the Zella AI analysis for specific fixes. Common adjustments include tightening session filters, adjusting risk-reward ratio targets, or adding a higher timeframe confirmation. Run the modified strategy as a new backtest and compare.
If the results are negative (profit factor below 1.0): The strategy does not have an edge in the tested conditions. Check whether the issue is directional (long vs short breakdown), time-based (specific sessions underperforming), or fundamental (the entry logic does not predict direction). Modify the rules and test again, or try a different strategy entirely.
How Does This Compare to Manual vs Automated Backtesting?
TradeZella offers both methods. Manual backtesting uses bar replay where you advance the chart bar by bar at speeds from 0.5x to 10x, placing orders as you would in live trading. Automated backtesting runs the same rules across the entire dataset in minutes.
Use automated backtesting when you want statistical validation across a large sample (50+ trades). Use manual replay when you want to practice execution, build muscle memory, or test discretionary elements that cannot be written as rules. Most traders use automated first to validate the edge, then manual replay to practice the execution
Key Takeaways
Automated backtesting in TradeZella requires zero coding. Write your strategy in plain English or pick a pre-built template.
Zella AI parses your description into structured entry rules, exit rules, and trade controls. If anything is missing, it asks specific questions instead of guessing.
The confirmation page lets you review exactly how your strategy was parsed before running.
Results include a full dashboard with win rate, profit factor, Sharpe ratio, max drawdown, equity curve, monthly P&L, and direction breakdown.
Every individual trade is visible in the trade log. Click any trade to see it on a TradingView chart with entry, exit, stop, and target markers.
Zella AI analyzes your results and provides specific, actionable feedback based on the actual data.
Use automated backtesting for statistical validation, then manual replay for execution practice.
Do I need to know how to code to use automated backtesting?
No. TradeZella's automated backtesting uses plain English. You describe your strategy the same way you would explain it to another trader. Zella AI parses your description into structured rules and runs them across historical data. There is no Pine Script, Python, or any other programming language involved.
How long does an automated backtest take to run?
Setup takes one to two minutes. The backtest itself runs in two to three minutes depending on the time period and number of trades generated. A six-month test on a futures instrument typically completes in under three minutes. Compare this to manual bar replay, which can take hours or days to generate the same number of trades.
What instruments can I backtest?
TradeZella supports futures (ES, NQ, MES, MNQ, CL, GC, RTY, and more), stocks, forex pairs, crypto, and options. The system includes session filters for New York, London, and Asia, plus custom time windows for any instrument.
What happens if my strategy description is missing information?
Zella AI asks you specific follow-up questions for any missing details. Common questions include which symbol to test, what time period to use, which trading sessions to include, and what starting balance to apply. If your description and controls already cover everything, the system skips the questions and moves straight to confirmation.
Can I see every individual trade from the backtest?
Yes. The Trade Log tab shows every trade with date, direction, entry price, exit price, position size, P&L, exit reason, and running balance. Click any trade to open it on a TradingView chart with entry, exit, stop, and target markers at any timeframe from 1-minute to daily.
What ICT concepts does automated backtesting support?
TradeZella has built-in ICT indicators including fair value gaps, order blocks, breaker blocks, CHoCH (change of character), SMT divergence, and liquidity sweeps. The pre-built template library includes ICT strategies like 4h FVG + CHoCH + SMT and Asian range manipulation. You can also write any ICT concept in plain English and Zella AI will parse it. See the best backtesting software comparison for how this differs from competitors.
Should I use automated backtesting or manual replay?
Use automated for statistical validation (50+ trades across months of data in minutes). Use manual replay for execution practice and testing discretionary elements. Most traders start with automated to validate the edge, then use replay to practice the execution before going live. TradeZella offers both in the same platform.