Trading Journal vs Spreadsheet: Which Actually Improves Your Trading?
Trading Journal vs Spreadsheet: Which Actually Improves Your Trading?
Both spreadsheets and trading journals track trades, but they break down at different volumes for different reasons. This guide compares the real time cost of manual entry, the data accuracy gap from missed fees and decimal errors, and the analysis depth each tool can actually deliver, so you can match the right tool to your trading stage.
class SampleComponent extends React.Component {
  // using the experimental public class field syntax below. We can also attach
  // the contextType to the current class
  static contextType = ColorContext;
  render() {
    return <Button color={this.color} />
  }
}
Last Updated: June 6, 2026
Both trading journals and spreadsheets can track your trades. Both can show you which setups work and which don't. So which one actually matters?
The honest answer: it depends on how many trades you take, how much time you want to spend on data entry, and how deep you want your analysis to go.
Spreadsheets work fine. Thousands of traders use them successfully. They're free, fully customizable, and you control every cell. But spreadsheets scale linearly with your effort. The more trades you take, the more time you spend entering data instead of analyzing it.
Trading journals solve a different problem. They automate the grunt work so you can spend your time on what actually moves the needle: spotting patterns, refining your edge, improving execution. And with AI now built into platforms like TradeZella, the journal does not just store your data. Zella AI tags every trade, reviews every session against your plan, and flags patterns you would never catch in a spreadsheet.
The real question isn't "spreadsheet or journal." It's "what's the best use of your time?"
What Do Spreadsheets Actually Do Well?
Spreadsheets have real advantages. They're cheap (free), accessible (everyone knows how to use one), and completely customizable. You can build exactly what you want, exactly how you want it.
For traders taking 1 to 3 trades per day, spreadsheets handle the basics perfectly fine. A simple layout tracking entry price, exit price, profit/loss, date, and setup type gives you enough data to spot whether your edge is real or just luck.
You own the structure. No learning curve, no onboarding. You download a template, start tracking, and within a few days you have real data. For traders who are comfortable with formulas, you can even automate some calculations (win rate, risk/reward ratio, average winner vs loser).
Spreadsheets also create a mental checkpoint. There's something about manually entering every trade that forces you to confront what you actually did. Some traders find that friction valuable. It makes you intentional.
If you're testing a new setup, running through a course, or just starting out, a spreadsheet can absolutely be your baseline. If you want a starting point, our free Trading Journal Template is a pre-built spreadsheet with the columns most traders need, so you don't have to build from scratch.
Where Do Spreadsheets Break Down?
How Much Time Does Manual Data Entry Actually Cost?
You finish a trade. You close the position. Now you spend the next 5 to 10 minutes manually copying entry price, exit price, spread cost, commission, fees into a spreadsheet. If you take 5 to 10 trades a day, that's an hour of data entry, every trading day. That's 20 hours a month just typing numbers.
Think about that for a second. In a 20 trading day month, that's an entire day spent just entering numbers. You could have spent that time reviewing your trades, analyzing your biggest winners and losers, identifying patterns, or even taking better trades. Instead, you're transcribing data.
For scalpers taking 15-30 trades per session, the math is worse. At 5 minutes per trade, 20 trades per day is over 1.5 hours of data entry. That's 30+ hours per month, the equivalent of nearly 4 full trading days spent typing into cells instead of trading or analyzing.
Daily Volume
Spreadsheet (monthly)
Journal (monthly)
Time Saved
Verdict
1-3 trades/day
3-5 hours
~30 min
2.5-4.5 hrs
Spreadsheet is fine
4-5 trades/day
7-10 hours
~1 hour
6-9 hrs
Tipping point
6-10 trades/day
12-20 hours
~1.5 hours
10-18 hrs
Journal wins
11-20 trades/day
22-40 hours
~2 hours
20-38 hrs
Journal essential
20+ trades/day
40+ hours
~2.5 hours
37+ hrs
Spreadsheet impossible
Assumes 5-10 min per trade for spreadsheet entry, 20 trading days/month. Journal time is tagging and verification only (auto-import handles data entry).
How Do Data Entry Errors Affect Your Trading Decisions?
Add in the human error. You miss a fee. You enter a decimal wrong. You forget to tag which setup it was. Now your statistics are off. A 2 percent error in one cell compounds across your entire dataset.
This is the silent killer of spreadsheet tracking. You think you're 52 percent profitable, but you actually missed commissions on 15 percent of your trades. You think one setup has a 3:1 risk/reward, but it's actually 2.4:1 because you forgot to include fees in half your calculations. These small errors accumulate over months, leading you to keep setups that aren't actually working and abandon ones that are.
This matters more than it sounds. Your trading expectancy depends on accurate fee data. If your expectancy formula uses win rate and average win/loss but the average win/loss is off by even 10% because of missed commissions, the expectancy number is misleading. You might be running a setup that looks profitable on paper but is actually breakeven or negative after real costs.
The same problem hits R-multiple tracking. If your initial risk is recorded correctly but your actual exit price is off by a few cents (forgot the spread, missed a partial fill), your R-multiple per trade is wrong. Multiply that across 200 trades and your entire performance picture is skewed.
What Analysis Can't Spreadsheets Do?
Spreadsheets also have hard limits on visualization. You can make a pie chart or a line graph, but comparing performance across multiple variables (which setups work best in which market conditions) requires building multiple sheets, linking data across tabs, and basically reconstructing database logic that someone else has already built.
You also lose the ability to filter quickly. "Show me only AAPL trades in the morning where I used limit orders." In a journal with tagging, that's one click. In a spreadsheet, you're rebuilding a pivot table or manually sorting rows.
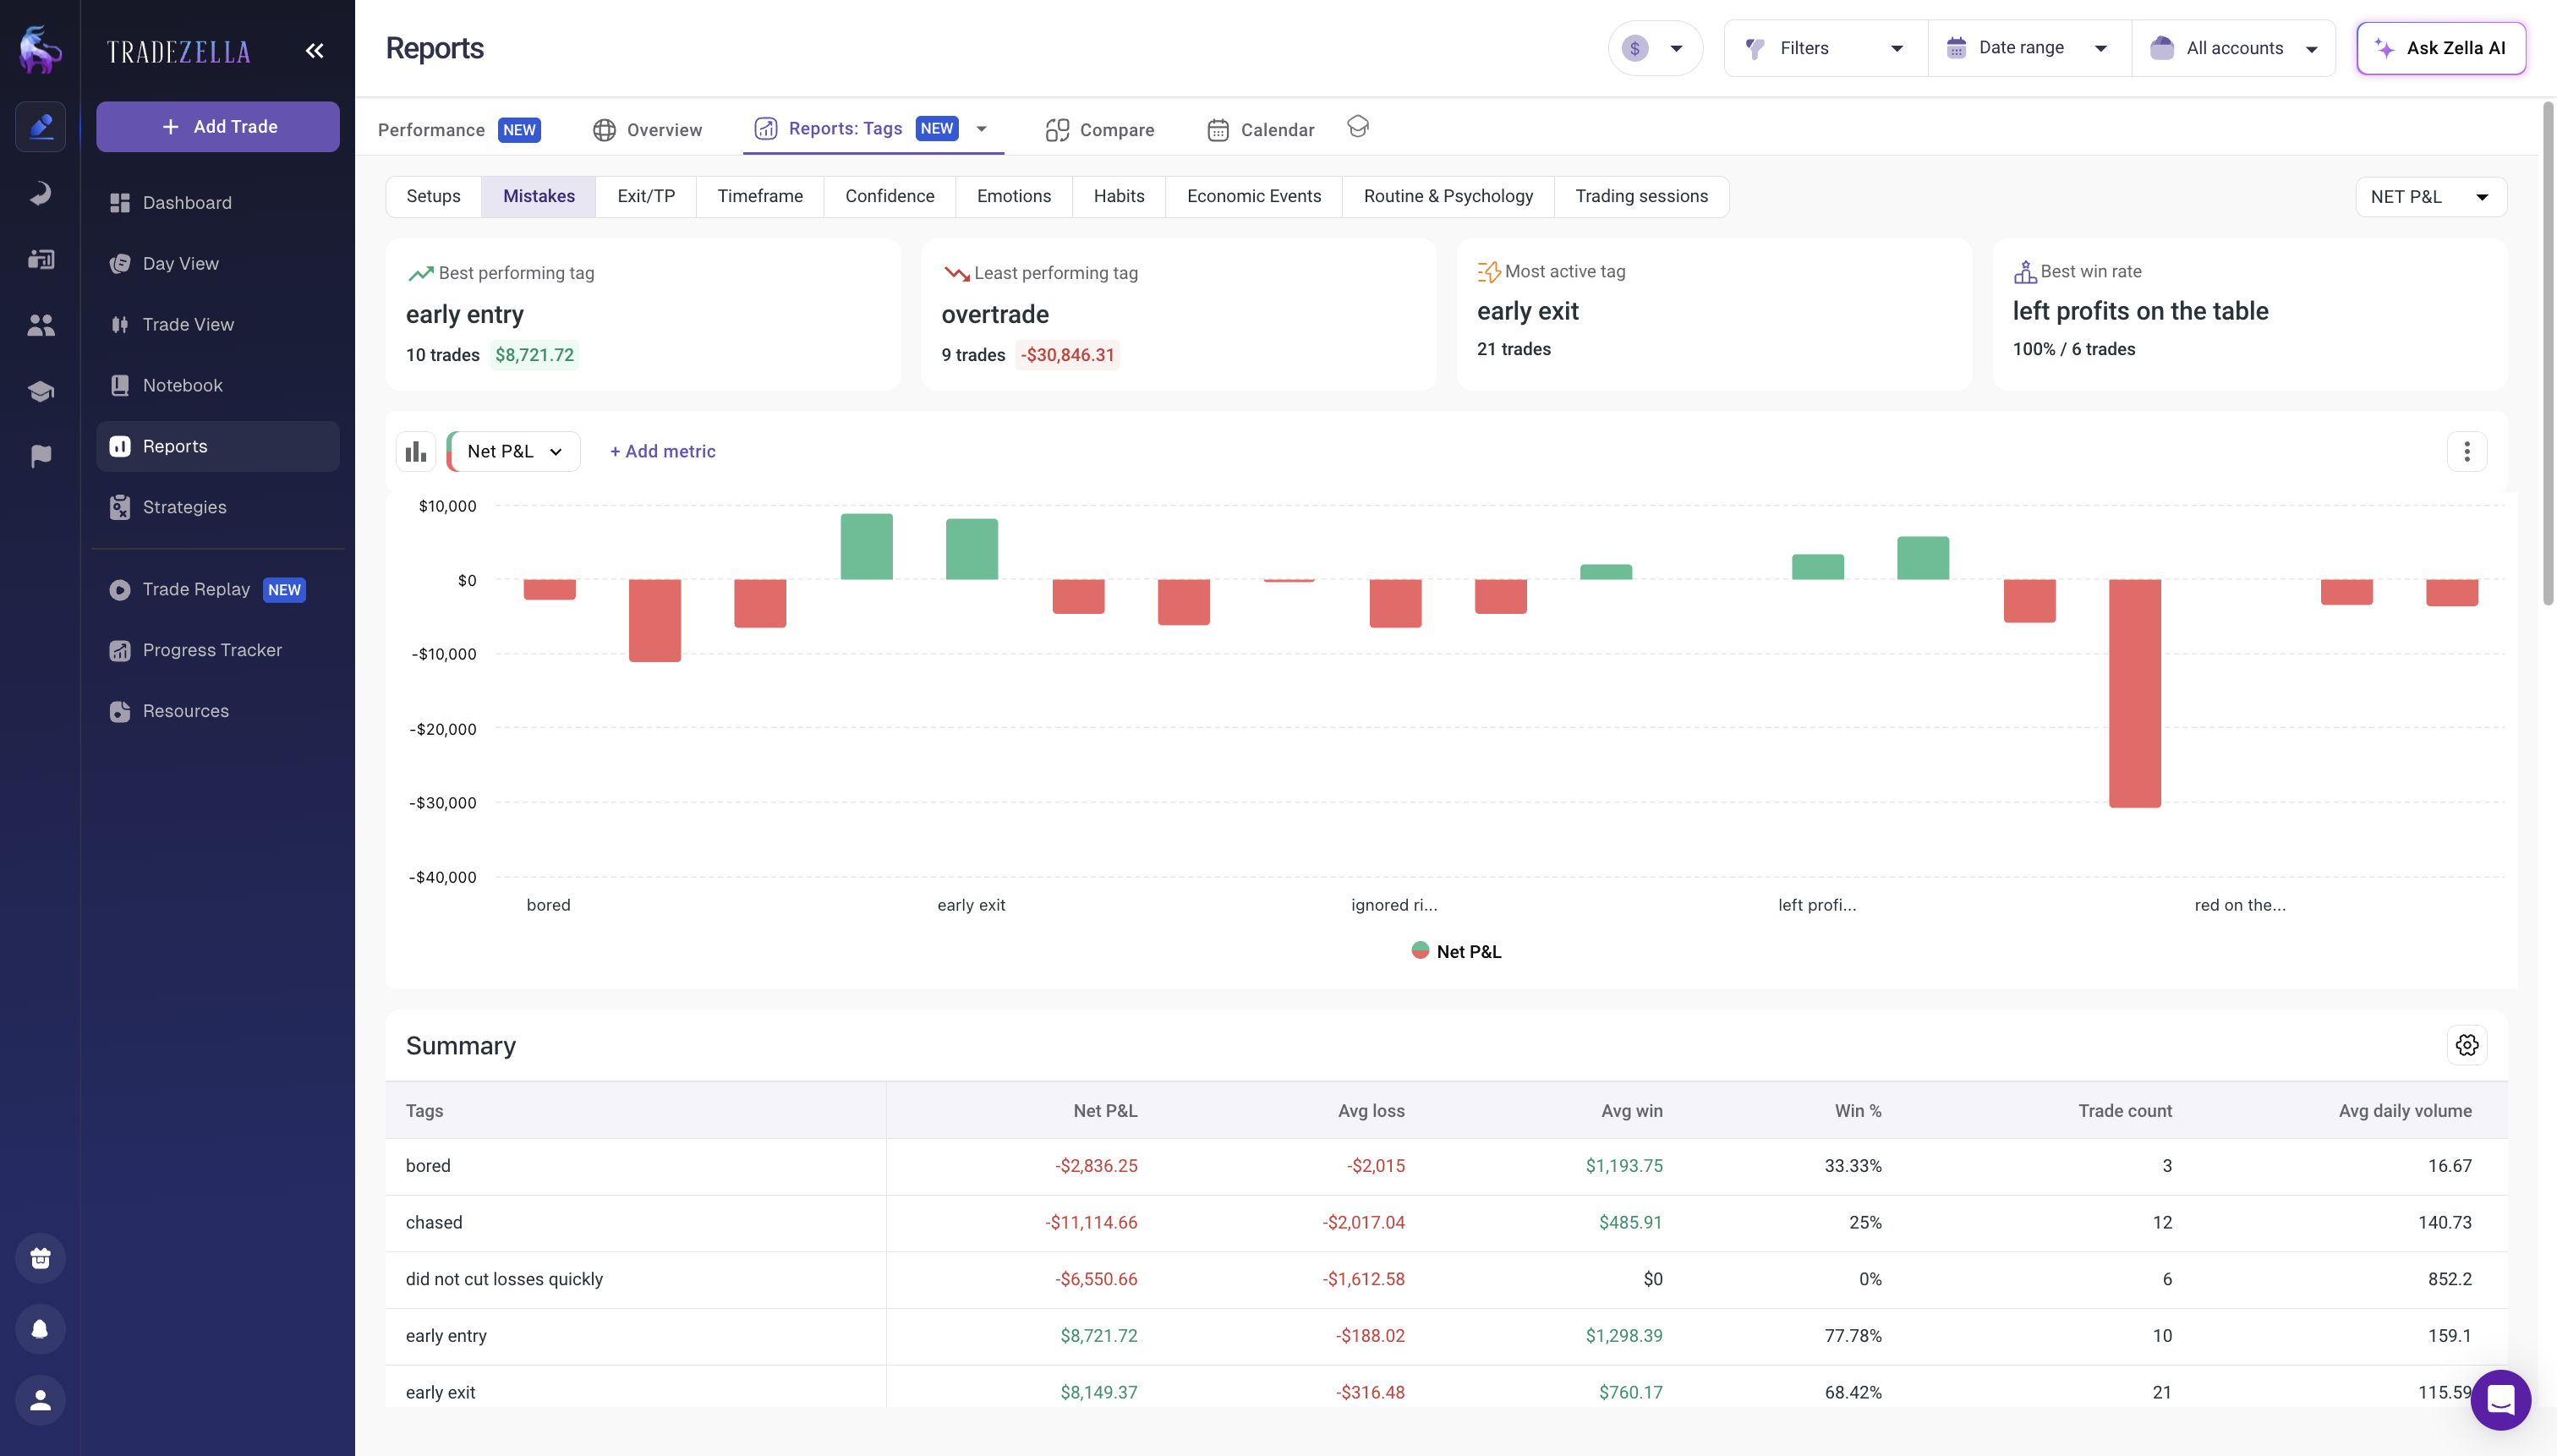
Time-of-day analysis is the clearest example. Most traders have no idea whether they perform better at 9:30 AM or 2:00 PM. A journal breaks this down automatically. With a spreadsheet, you would need to parse timestamps, create hour-based buckets, run conditional averages across each bucket, and build a chart. That's a half-day project, and most traders never do it. Which means they never discover that their morning session is +$200/day average but their afternoon session is -$80/day average. That single insight, invisible in a spreadsheet, is worth the entire cost of a journal.
In depth Report from TradeZella
And spreadsheets have zero connection to your broker. You can't auto-import fills. There's no connection between the trade you executed in your platform and the row you're entering in your sheet. If there's a discrepancy (which there will be), you have to manually reconcile it.
This disconnect is where most traders' spreadsheet tracking breaks down completely. You execute a trade in your broker's platform. You then manually record it in your spreadsheet. Fast forward three months later and you notice your account balance in your spreadsheet doesn't match your actual account balance. Now you have to spend hours figuring out where the mismatch is. Did you miss a trade? Was there a dividend reinvestment? Did your broker charge a fee you forgot about? The spreadsheet can't tell you because it was never connected to the source of truth.
This is especially critical if you are tracking prop firm evaluations. Prop firms close your account if you breach drawdown limits. A spreadsheet error that underreports your current drawdown by 1% could mean the difference between adjusting your risk and blowing the evaluation. You need accuracy that manual entry cannot provide, which is why most funded traders use Prop Firm Sync to track challenge progress automatically.
What Does a Trading Journal Add That Spreadsheets Can't?
How Does Auto-Import Change Your Workflow?
A real trading journal removes the data entry burden entirely.
When you use a platform that connects to your broker, every fill automatically appears. TradeZella imports trades through direct broker, or through CSV upload from any of 500+ supported brokers. You do not type entry price. The system reads it from your broker. No transcription errors. No missed fees. Real data, captured the moment the trade closes.
That automatic import solves the time problem. What used to be an hour of daily data entry becomes 30 seconds of verification. You glance at the imported trades, and Zella AI's Auto Trade Tagger has already tagged each one based on rules you define. No manual tagging, no missed trades, no end-of-day data entry sessions. The system does the heavy lifting.
What Pre-Built Analytics Do You Get?
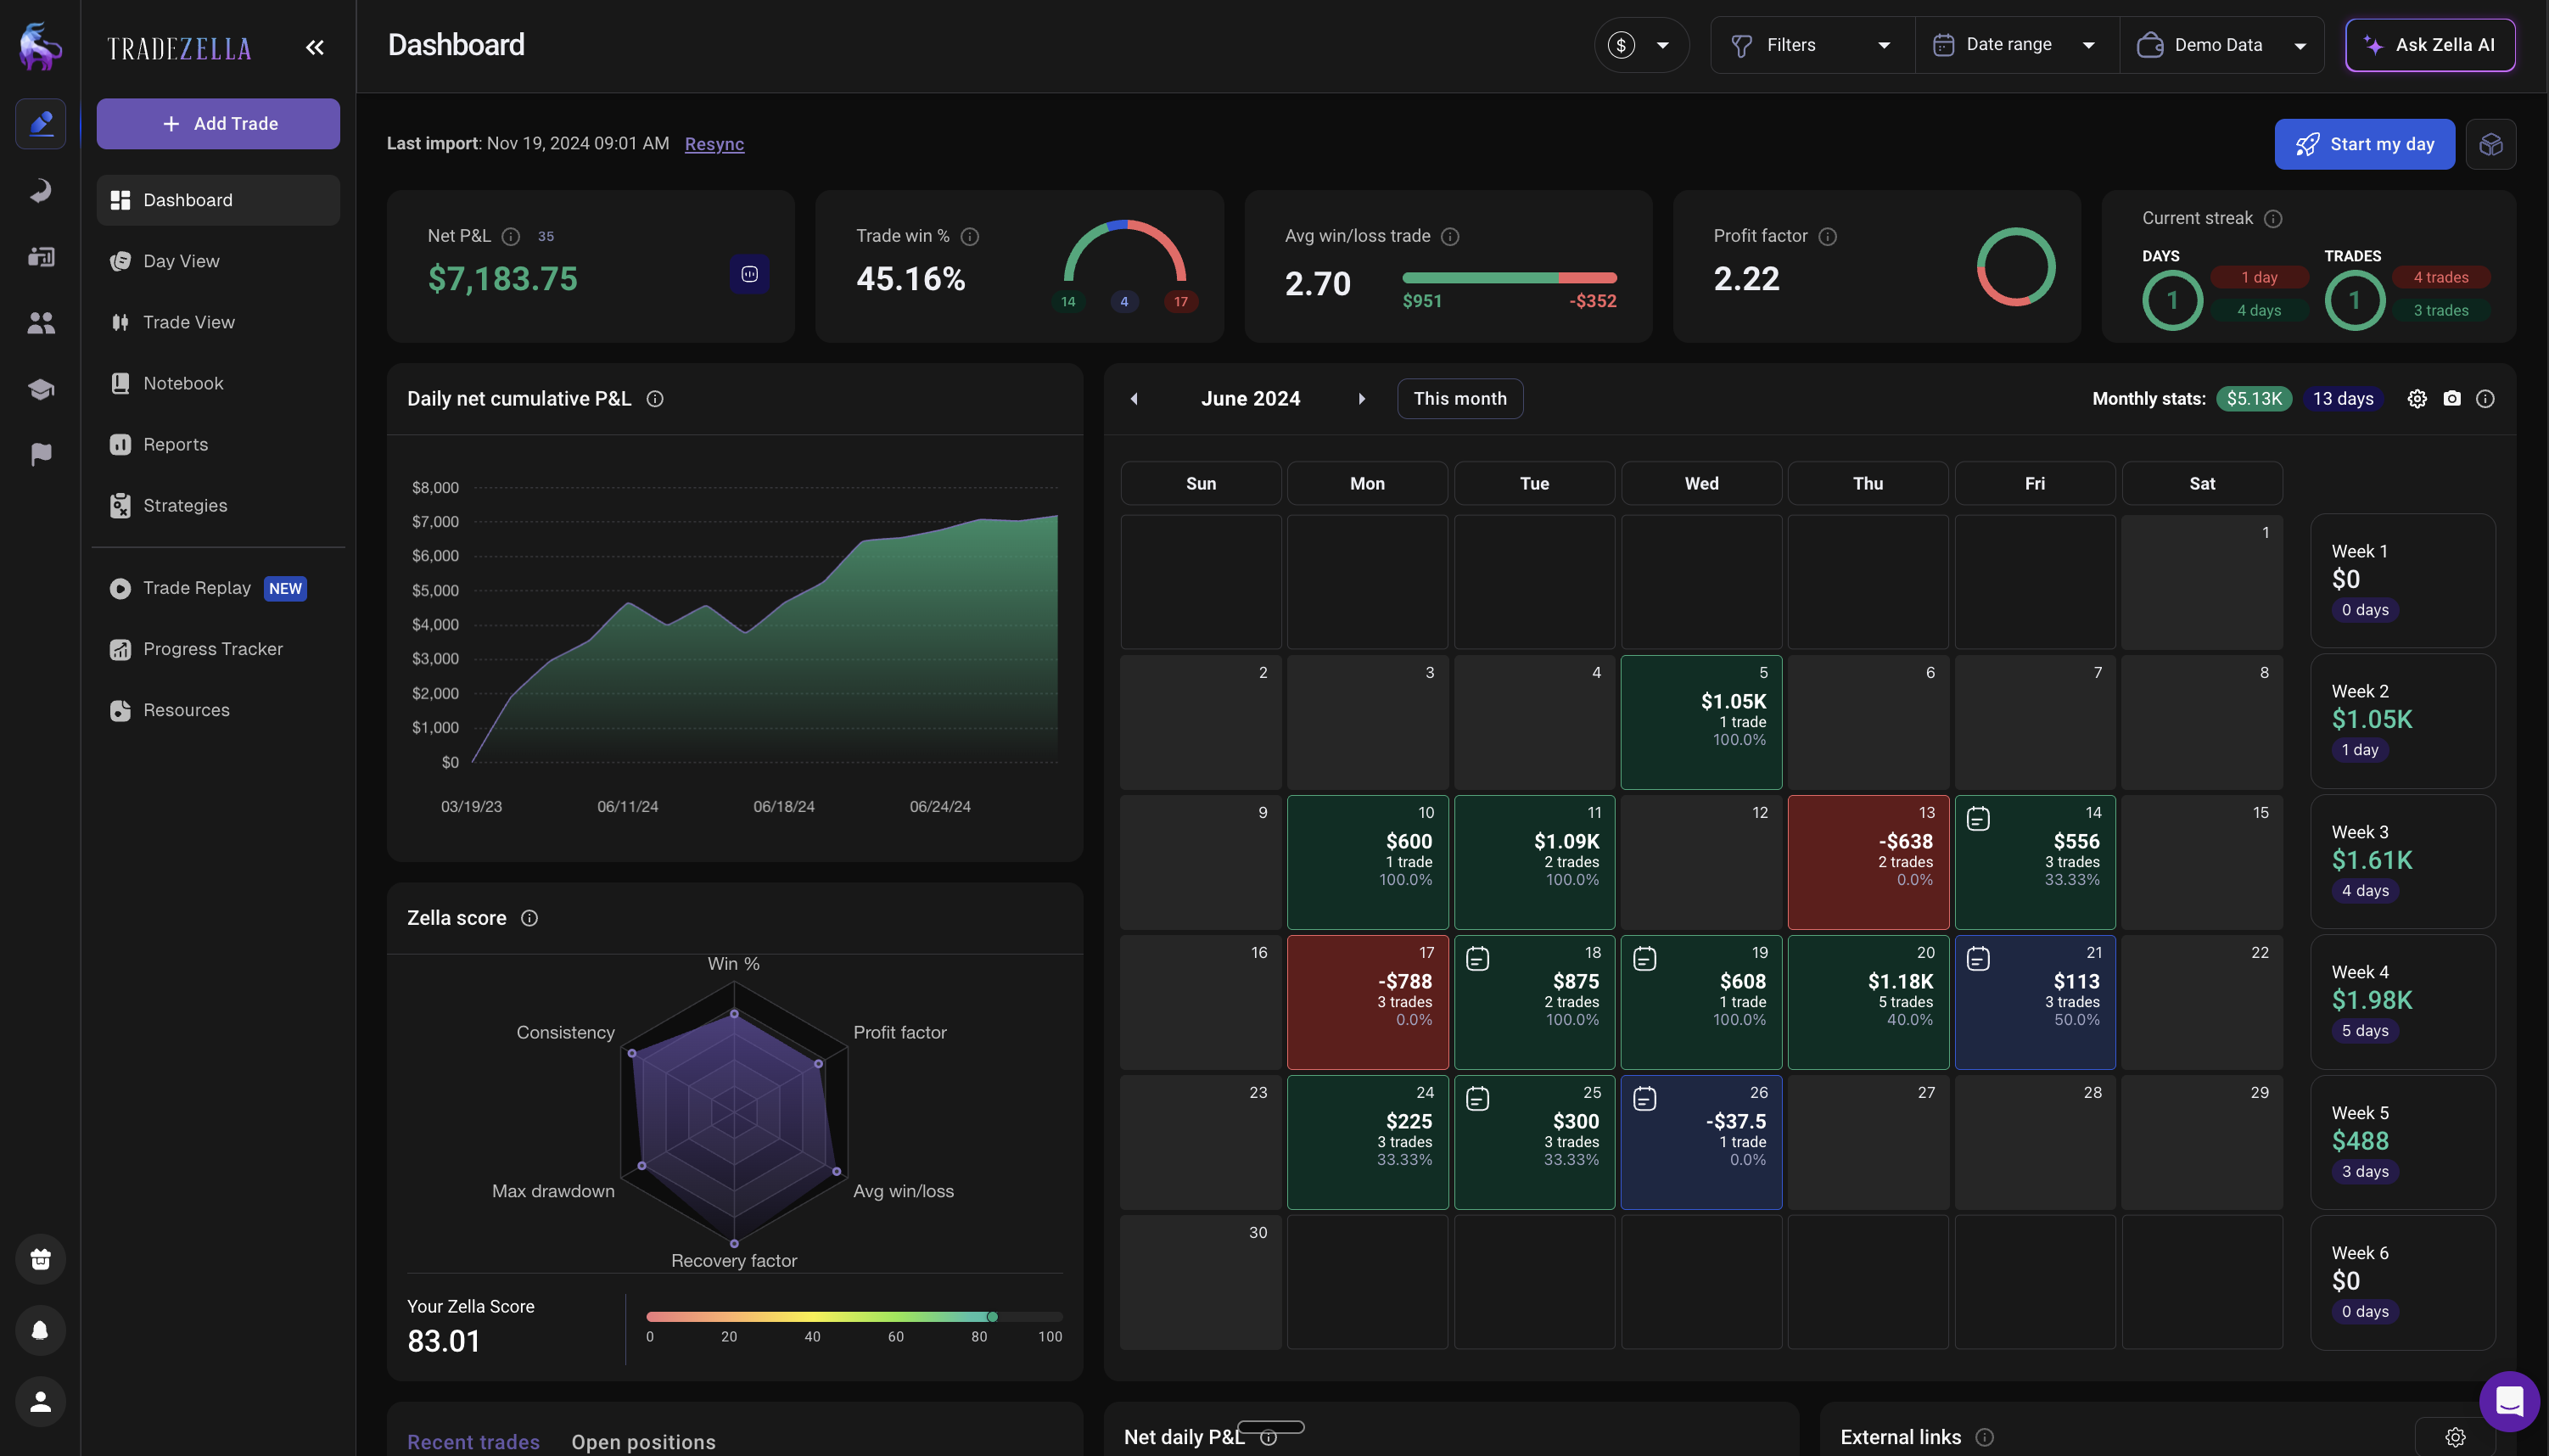
Pre-built analytics are where journals get interesting. A good journal gives you different reports and metrics out of the box. Win rate by Strategy. Average risk-reward ratio by market condition. Performance by time of day. Profit factor. R-multiple distribution. Consecutive winners and losers. All calculated instantly from your data. TradeZella offers 50+ reports across 7 dashboard views, including a dedicated P&L calendar that shows daily patterns at a glance.
With a spreadsheet, building even one of those reports requires conditional formulas, helper columns, and troubleshooting when it breaks. In a journal, it's already there.
Setup-by-setup tracking is where the real value shows up. If you trade multiple setups (pattern breakouts, gap fills, mean reversion), a journal lets you compare them head to head. Which setup has the highest win rate? Which one has the best risk/reward? Which one is most consistent?
This matters more than it sounds. Most traders have a vague sense of which setups feel good, but they've never actually compared them numerically. A journal shows you that your gap fill setup is actually 38% win rate with 2.1:1 risk/reward, while your pattern breakout setup is 52% win rate with 1.8:1 risk/reward. Suddenly you know exactly where to focus your effort.
How Does Tagging Change Your Analysis?
The biggest analytical gap between spreadsheets and journals is tagging. In a journal, you tag every trade with metadata: setup type, market condition, emotional state, time of day, ticker. Then you filter by any combination.
"Show me all FOMO trades in the last 30 days." One click. Now you see that your FOMO-tagged trades have a 31% win rate and -0.4R average, while your planned trades are 54% win rate and +0.8R average. That is the exact cost of FOMO in your account, measured in dollars.
"Show me all trades after a losing streak of 3+." Now you can see if revenge trading is a pattern. If your post-loss trades are significantly worse than your normal trades, the journal gives you the data to prove it. Zella AI's Session Review catches this automatically, comparing your position sizes after losses to your normal range and flagging when trading tilt is creeping in. A spreadsheet would need a custom formula checking the previous 3 rows for consecutive losses, then averaging the next row's P&L, across hundreds of trades. Most traders never build that.
This is the same tagging system used for tracking trading habits. Tag five specific behaviors on every trade (followed plan, sized correctly, respected stop, entered on signal, managed emotions), filter by each tag weekly, and the data shows you exactly which habits are costing you money. Spreadsheets can track this in theory, but the multi-tag filtering is where they break.
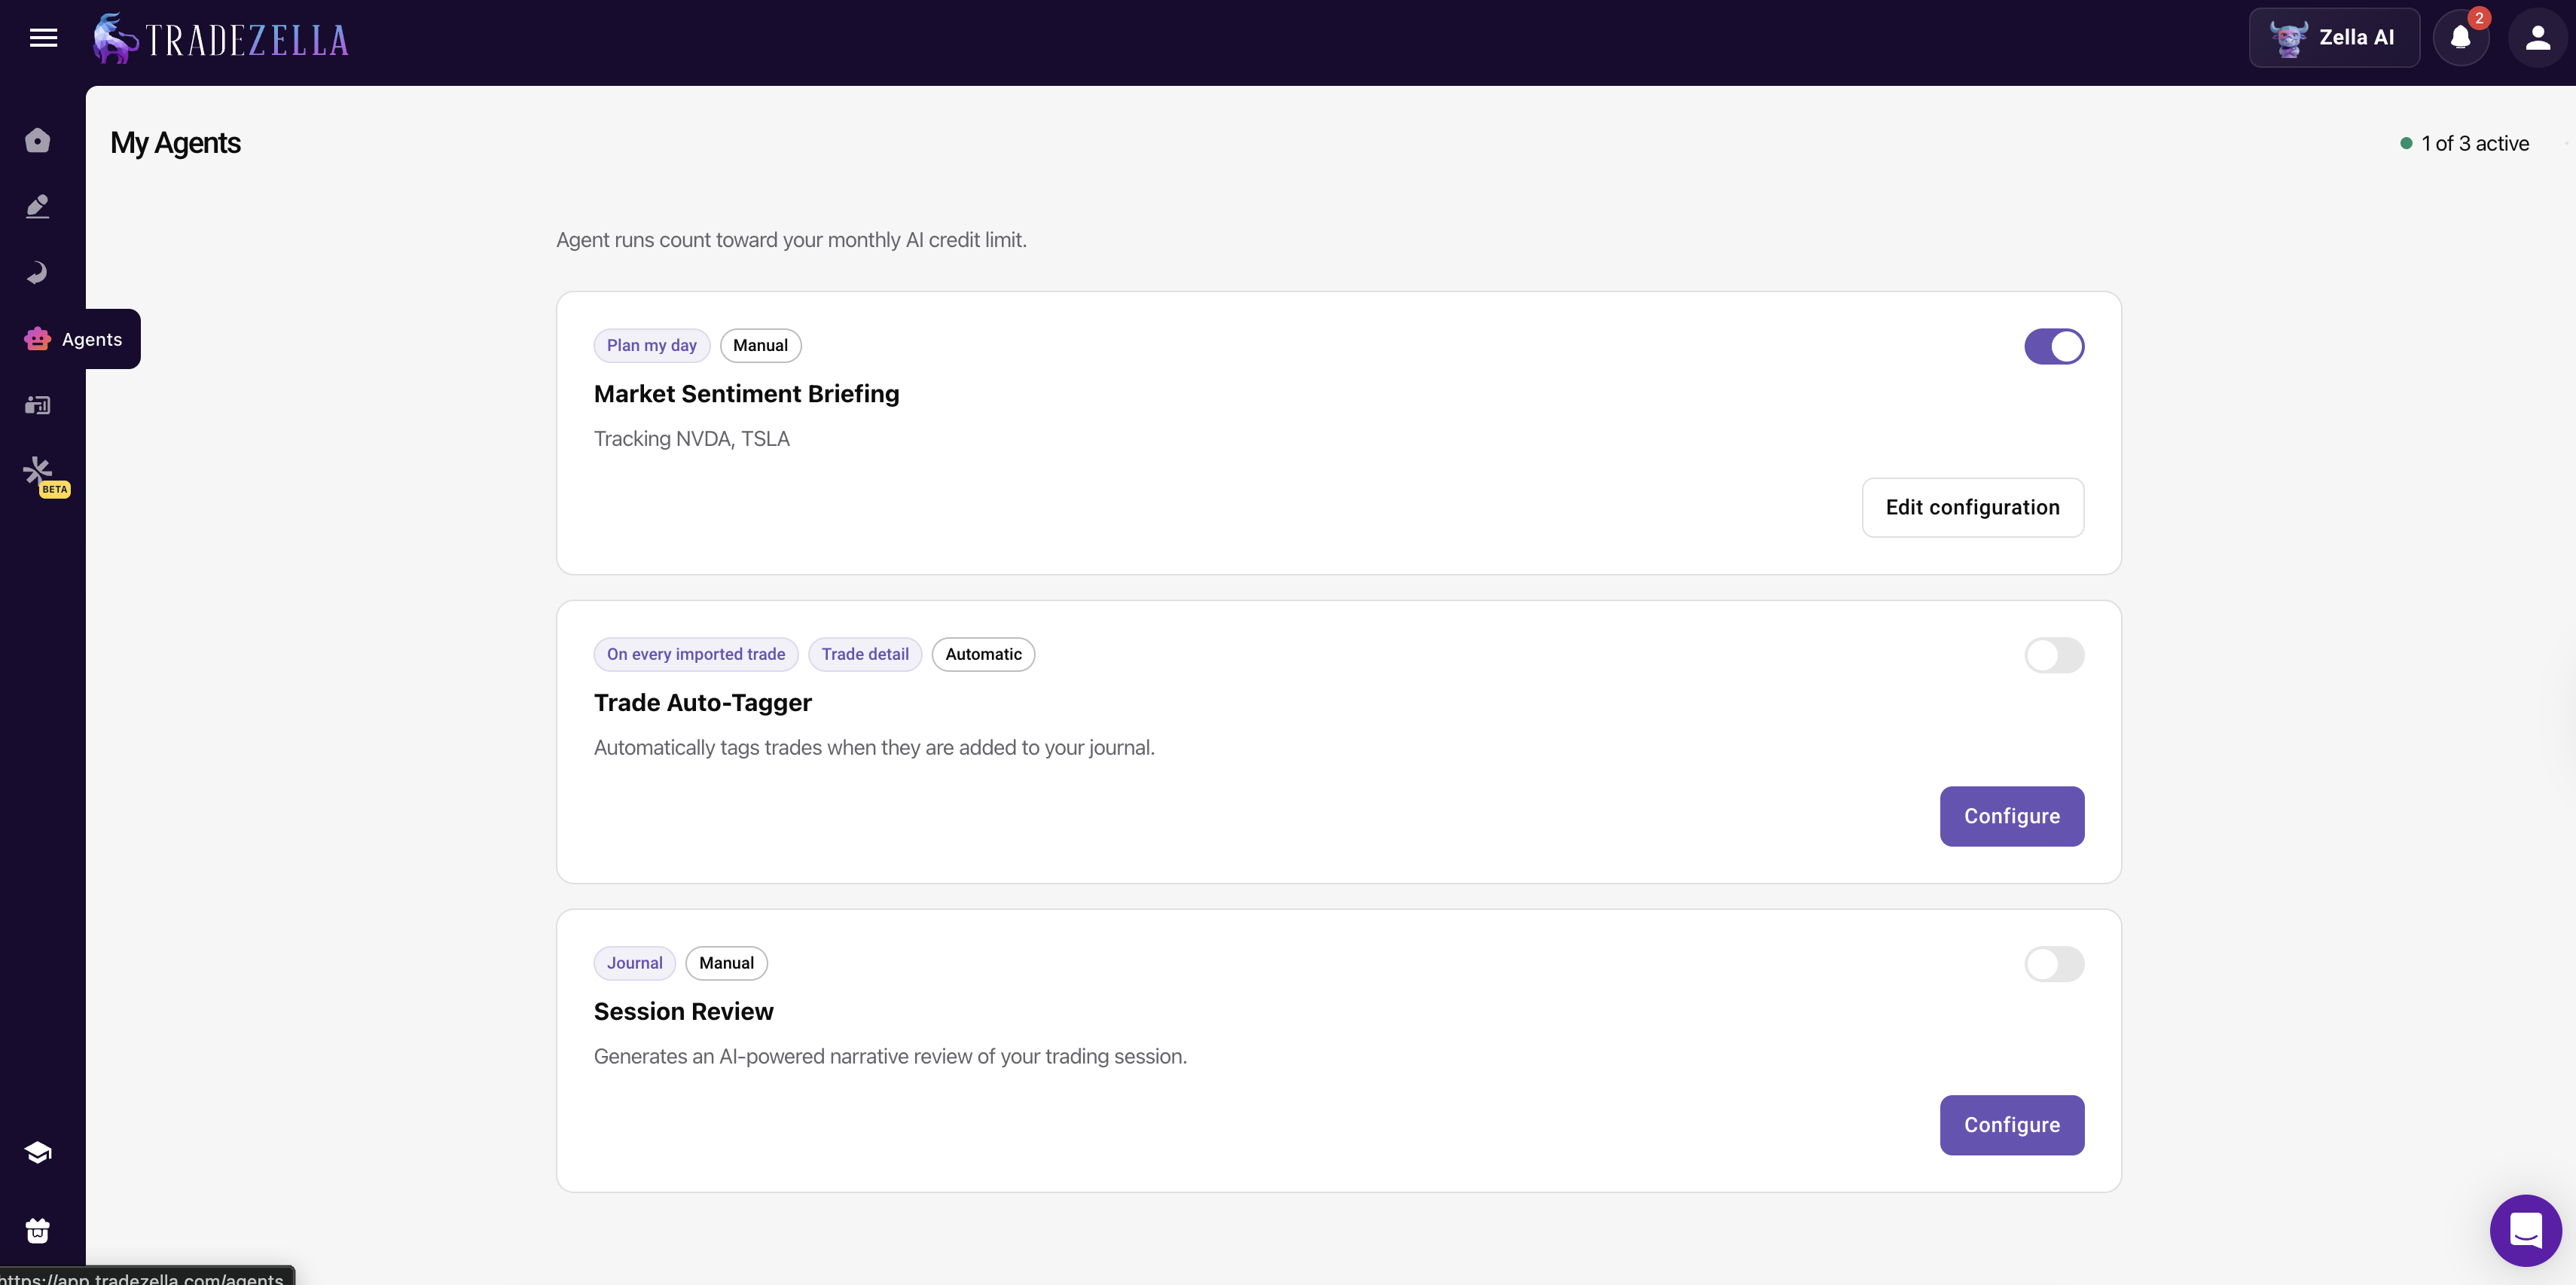
Zella AI removes most of the tagging work entirely. The Auto Trade Tagger applies your tagging rules to every trade the moment it syncs, so tags like entry timeframe, setup type, and whether a trade hit 2R are applied automatically without you touching anything. The Session Review agent goes further, comparing your morning plan against your actual results at the end of each session and flagging rule breaks, size deviations, and emotional patterns. You can also ask Zella AI questions directly about your data, like "which Strategy had the highest profit factor this month" or "show me my worst day this week and what went wrong," and it answers using your actual trade history, not generic advice. A spreadsheet cannot do any of this. It stores what you type. Zella AI reads your data, acts on it, and tells you what you missed.
Zella AI Agents
How Does a Journal Fit Into Your Weekly Review?
A journal is not just a storage system. It is the foundation for your weekly trade review. Every Sunday, you open your journal, filter by the past week, and in 30 minutes you can answer: which setups won, which lost, when did I overtrade, when did I trade on emotion, and what do I change next week?
With a spreadsheet, that same review takes 60 to 90 minutes because you have to manually sort, filter, and calculate. Most spreadsheet traders skip the review entirely because it is too much work. That is the real cost: not the tool itself, but the review that does not happen because the tool makes it too hard.
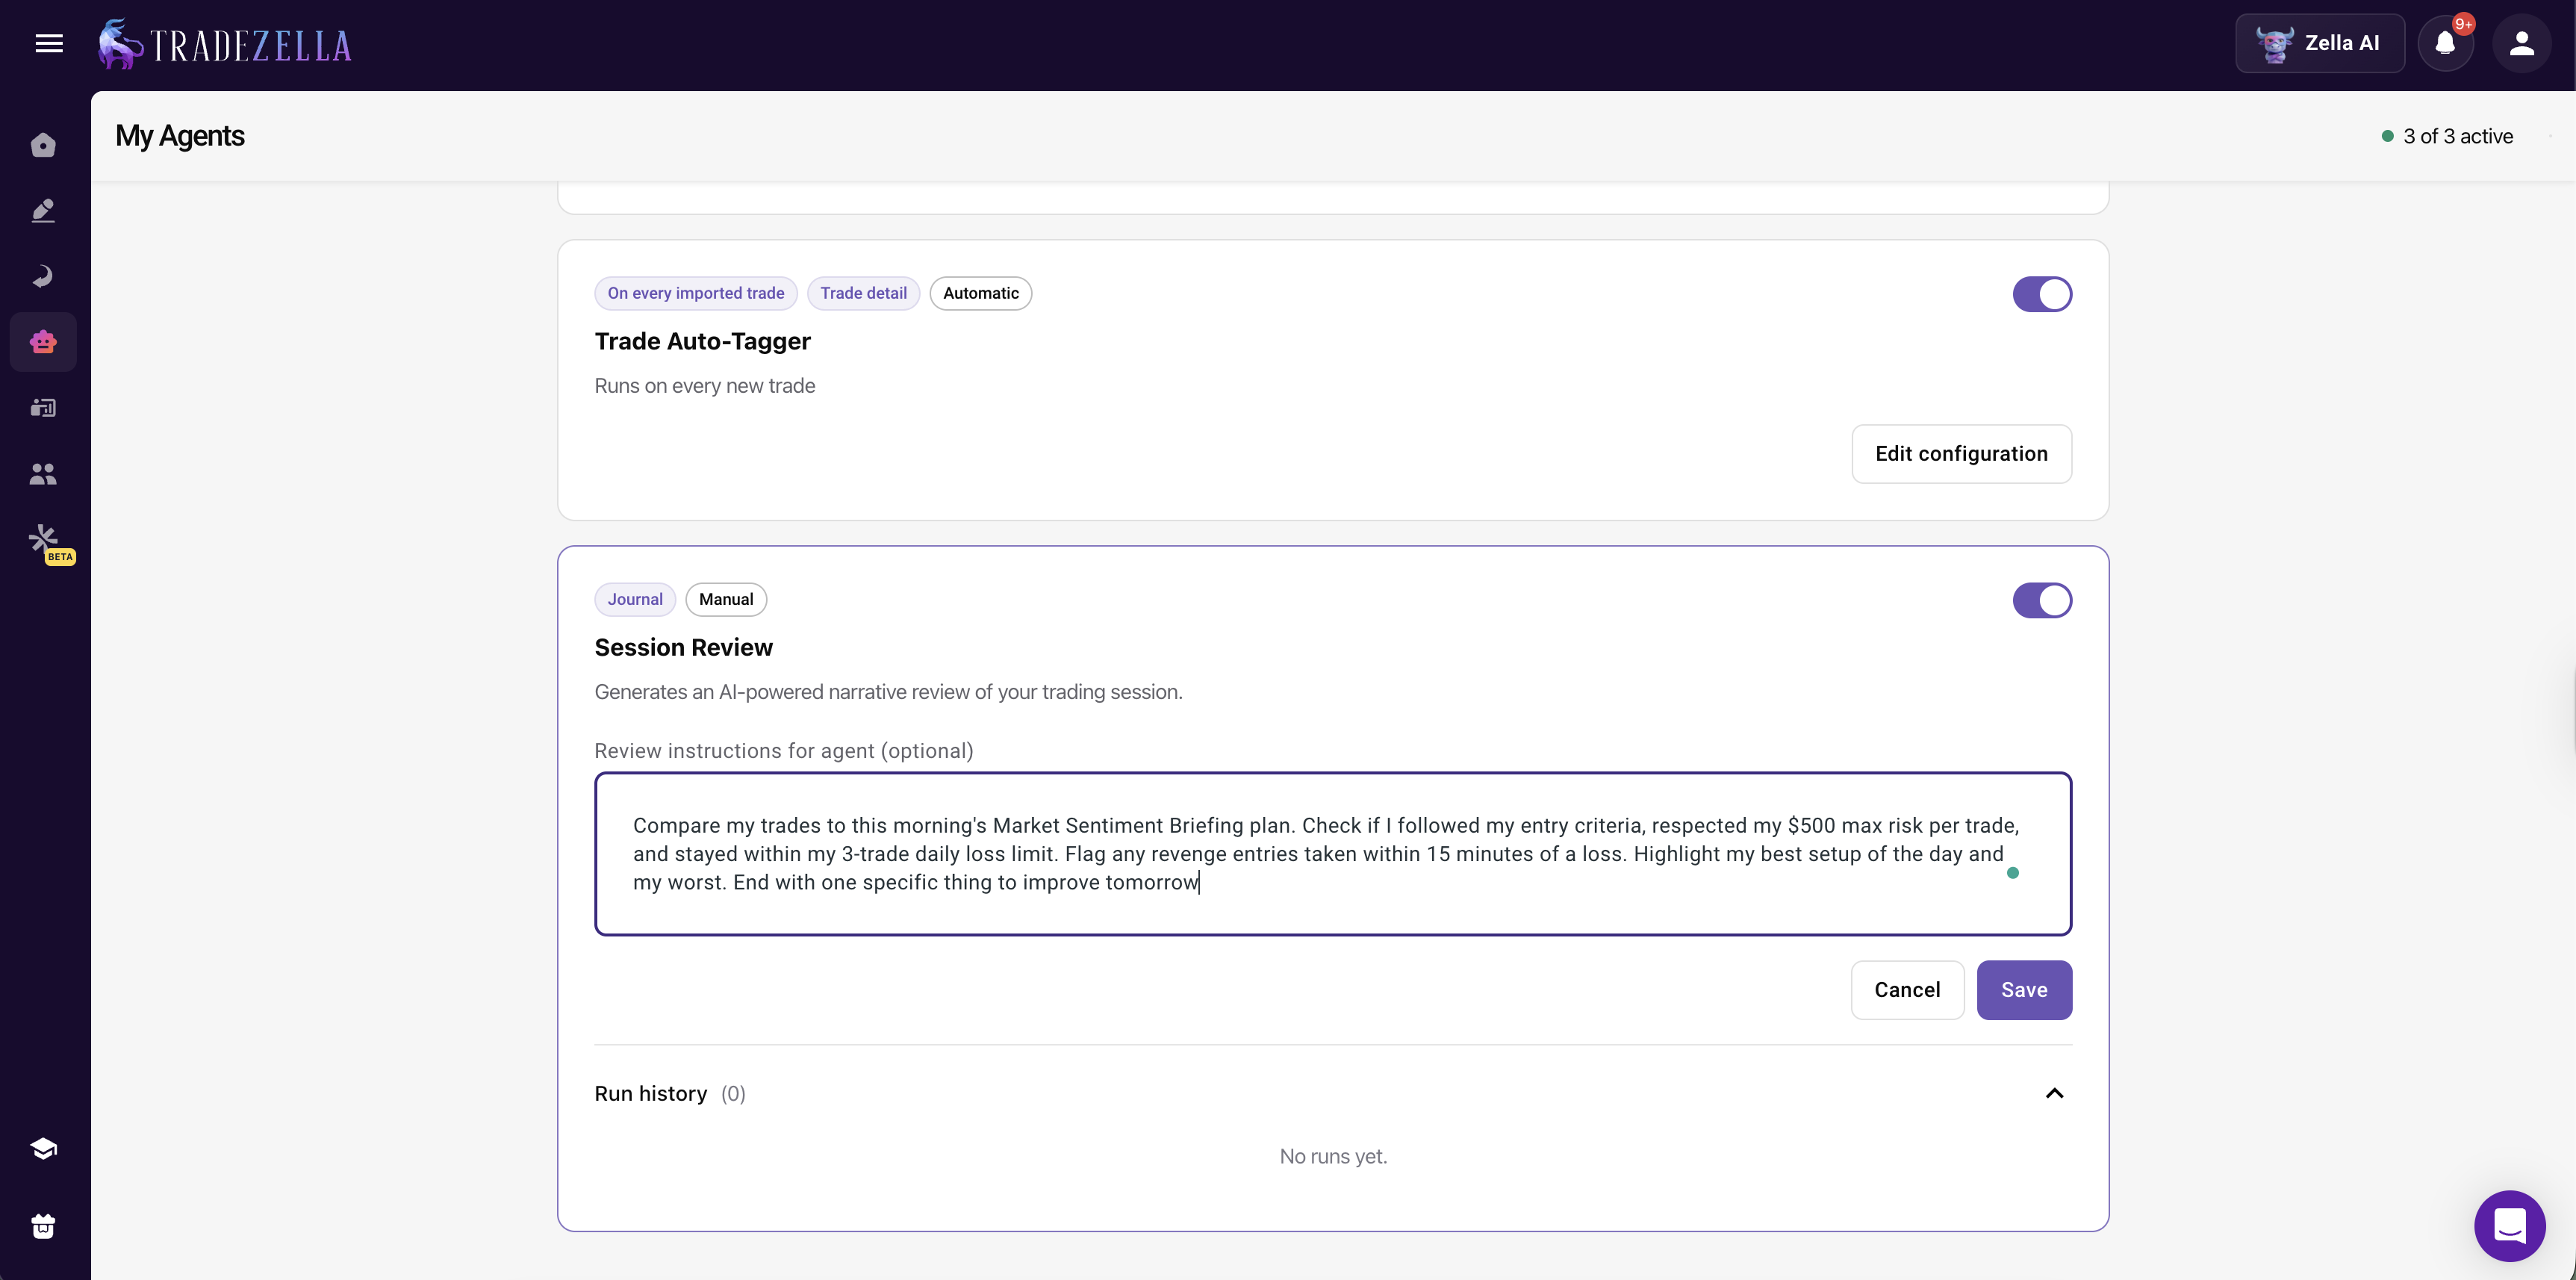
Zella AI's Session Review agent makes this even faster. It reviews each trading session automatically against your morning plan, flags rule breaks, and journals your entire day. By Sunday, most of the analysis is already done. Your weekly review becomes a 15-minute pattern check, not a data dig.
Zella AI Session Review Agent
When Should You Switch from Spreadsheet to Journal?
Here's the honest rubric for deciding. This isn't about one tool being objectively better. It's about matching your tool to your stage as a trader and your willingness to maintain it.
Stick with a spreadsheet if:
You take 1 to 3 trades per day on average
You trade only one main setup
You're testing something short-term (a new strategy, an online course)
You're comfortable building formulas and managing multiple sheets
You don't mind spending 20 to 30 minutes daily on data entry
You're in the early exploration phase and want to keep it simple
You want analysis without having to build it yourself
You want auto-import from your broker (no manual entry)
You want to track performance by setup, time of day, or other variables
You want AI to tag trades, review sessions, and catch behavioral patterns you would miss manually.
The tipping point for most traders is around 5+ trades per day. At that volume, the time saved by auto-import and built-in analytics justifies switching. You're literally saving hours of data entry every month, time you can redirect toward improving your actual trading.
But be honest about your volume and your patience for spreadsheet maintenance. Some traders thrive with spreadsheets and would find a journal overkill. Others take 3 trades a day and feel the friction immediately. The right tool depends on your personality as much as your trading volume. If you're the type who loves customization and doesn't mind maintenance work, a spreadsheet might genuinely be the better choice. If you'd rather let the system handle mechanics so you can focus on analysis, a journal is worth the investment.
Also consider your future plans. If you're a beginning trader starting with 1 to 2 trades per day, a spreadsheet is fine right now. But if you have ambitions to scale up to 5, 10, or 20 trades per day, you're going to outgrow it. Migrating later is possible but adds friction. Sometimes starting with a journal, even if you don't need all its features yet, saves transition costs down the road.
Position sizing verification is another trigger point. When you start risking real money based on your journal data (sizing positions based on historical win rate and R-multiple), the accuracy of that data becomes non-negotiable. A 2% error in your spreadsheet win rate translates to a position size that's either too large or too small. At that point, a journal's auto-import isn't a convenience. It's a risk management tool.
How Do You Transition from a Spreadsheet to a Journal?
If you've been using a spreadsheet and want to move to a journal, the transition is simpler than you think.
Most trading journals accept CSV imports. You format your spreadsheet data (date, entry, exit, setup type, profit/loss), export as CSV, and the journal imports it. Within a few minutes, all your historical data is in the new system. You are not starting from zero. Going forward, TradeZella imports new trades automatically through direct broker connections, or through CSV upload from 500+ supported brokers.
The next step is setup configuration. In your journal, you define each of your setups. You create a setup for gap fills, one for pattern breaks, one for reversals, whatever applies to you. If you don't have your setups documented yet, the free Trading Plan Template gives you a framework for defining each setup's entry criteria, exit rules, and risk parameters before you start tagging trades.
Then you establish your baseline. Run a report on your imported data. What's your win rate across all trades? What's your average risk/reward? Now filter by setup. Does one setup clearly outperform the others? That baseline tells you where to focus first. This is the moment where most traders realize what they've been missing. They finally see the actual numbers instead of the approximations they've been working with.
From there, the workflow becomes almost automatic. You take a trade, the journal auto-imports it from your broker, you tag which setup it was, maybe add a one-line note (why you entered, what you were thinking, what you learned). The journal automatically calculates win rate, risk-reward ratio, profit factor, and updates all your reports. Zella AI's Auto Trade Tagger applies your tagging rules to every imported trade, and the Session Review agent analyzes each session against your plan. By the end of the week, you have fresh performance data that is actually accurate, plus AI-generated insights about which sessions went well and which patterns are costing you money.
Most traders spend a few days learning the interface and building their custom reports. They might spend an afternoon setting up alerts or creating additional analysis views. By week two, they're fully transitioned and wondering why they didn't make the switch earlier. By week four, they often can't imagine going back to a spreadsheet. The time they save on data entry alone feels like a superpower.
Key Takeaways
Both spreadsheets and trading journals track trades. Spreadsheets are free, accessible, and simple. Trading journals eliminate manual data entry, provide pre-built analysis, and scale with your trading volume. AI-powered journals like TradeZella go further by tagging, reviewing, and analyzing your trades automatically.
The decision comes down to how many trades you take and how much time you want to spend on data entry versus analysis. At 5+ trades per day, the time saved by auto-import justifies switching. Below that, a spreadsheet might be enough.
Data accuracy is the hidden cost of spreadsheets. Missed fees, decimal errors, and forgotten tags compound across months and lead to decisions based on wrong numbers.
Tagging (setup type, emotional state, market condition) is where journals pull ahead. The ability to filter by any combination of tags and see performance instantly is something spreadsheets cannot replicate without heavy custom work.
If you do switch, modern journals let you import your historical data, so you're not starting over. The setup takes an afternoon, and from there, the system does the heavy lifting.
The traders who get the most from journals aren't the ones who need the fanciest features. They're the ones who recognized that every hour spent on data entry is an hour they're not spending on what actually matters: analyzing patterns, refining their edge, and improving their execution.
Yes, if you take 1 to 3 trades per day and don't mind manual entry. At higher volumes (5+ trades/day), the time cost of a spreadsheet becomes significant. At 10+ trades per day, you're spending 60-90 minutes daily on data entry. That time is better spent on analysis. The question isn't whether you can, it's whether you should.
What if I switch and regret it?
Most journals let you export your data as CSV, so you can go back to a spreadsheet if needed. But in practice, once you experience automatic imports and pre-built analytics, few traders go backward. The workflow is too much more efficient.
Can I use both at the same time?
Some traders run a journal as their main system but maintain a personal spreadsheet for custom analysis. It's extra work, but possible. Most traders find that one good journal covers 90 percent of what they need.
Does a trading journal actually improve my trading?
The journal itself does not improve your trading. Analysis does. A journal just makes analysis faster and more accessible. If you import your data but never look at the reports, it will not help. If you actually review your metrics weekly and adjust your approach based on what you find, it will. The weekly trade review process is where the improvement actually happens. The journal is the tool that makes that review possible in 30 minutes instead of 90. With Zella AI, the review is partially done for you. The Session Review agent compares your plan against your results after every session, so insights surface automatically even on days you would have skipped the manual review.
How long does it take to set up a trading journal?
Most journals have a setup wizard that takes 20 to 30 minutes. Importing historical data takes another 10 to 15 minutes. Within an hour, you're fully set up. The learning curve for the interface is another few days, but the basics are intuitive.
How much does a trading journal cost compared to a free spreadsheet?
Trading journals typically cost $20-$50 per month. The real comparison isn't the dollar cost. It's the time cost. If a journal saves you 20 hours per month of data entry, and you value your time at even $15/hour, that's $300/month of time recovered for a $30 tool. The math works at any trading volume above 5 trades per day.
What's the best free option if I'm not ready for a journal?
Start with a structured template rather than a blank spreadsheet. Our free Trading Journal Template has the columns, formulas, and layout pre-built. It won't auto-import or give you advanced analytics, but it's a better starting point than building from scratch. When you're ready to upgrade, you can import the CSV directly into a journal.
Can AI replace a spreadsheet for trade tracking?
AI does not just replace the spreadsheet. It replaces the manual work that makes spreadsheets fail. TradeZella's Zella AI includes agents that tag every trade automatically based on rules you define, review each trading session against your morning plan, and generate pre-market briefings based on how you trade. The mechanical work, including data entry, tagging, calculating metrics, and comparing plan versus results, is handled by AI. You still do the thinking and decision-making, but the hours of data entry and manual analysis that cause most traders to quit journaling are eliminated. A spreadsheet requires your time for every trade. Zella AI requires your time only for the review.