The Weekly Trade Review Process That Actually Improves Your Trading
The Weekly Trade Review Process That Actually Improves Your Trading
Most traders journal but never actually review. This is the 30-minute weekly framework that fixes that: 6 steps, 5 key metrics compared against your baseline, and one specific playbook adjustment per week. After 12 weeks, you'll have 12 data-backed refinements to your strategy and a clear record of what worked.
class SampleComponent extends React.Component {
  // using the experimental public class field syntax below. We can also attach
  // the contextType to the current class
  static contextType = ColorContext;
  render() {
    return <Button color={this.color} />
  }
}
Last Updated: April 2, 2026
The most effective way to improve as a trader is a structured weekly review that takes 30 minutes and follows a repeatable process. Not journaling for the sake of journaling. Not staring at charts after the fact and thinking "I should've held longer." A system that forces you to look at the right data, ask the right questions, and make one specific adjustment each week.
Most traders who journal don't actually review. They log trades during the week, maybe glance at their P&L on Friday, and then start the next week doing the same things. That's like recording every workout you do but never looking at whether you're actually getting stronger. The review is where the improvement happens. The journal is just the data collection.
If you're not journaling yet, start there. But if you've been logging trades for weeks or months without seeing improvement, this framework is what's missing. Every metric we reference below, win rate, profit factor, expectancy, and R-multiple, is something your journal should already be calculating. If you need help with any of the math, TradeZella's free trading calculators can get you started.
Here's the exact 30-minute framework, broken into 6 steps you can follow every Sunday evening or Monday morning before the market opens.
Step 1: How Do You Read Your Week at a Glance? (3 Minutes)
Open your trading journal's calendar view and look at the full week. Don't zoom into individual trades yet. You're looking for the shape of the week first.
What you're looking for:
Which days were green and which were red? A week with one big red day and four small green days tells a different story than a week with steady small wins.
Was there a pattern to the red days? Monday losses after a weekend of overthinking? Friday losses from forcing trades before the weekend?
How does this week compare to last week? Is your daily P&L range expanding (higher highs and lower lows) or contracting?
In a journal like TradeZella, the calendar view gives you a visual heat map of daily P&L. You can spot patterns in seconds that would take 20 minutes of scrolling through a spreadsheet. Green days, red days, and their magnitude, all visible at a glance.
TradeZella Dashboard calendar view showing a full week with green/red daily P&L values
This step takes 3 minutes and gives you the narrative of your week before you look at any numbers.
Step 2: How Do You Compare This Week's Metrics to Your Baseline? (5 Minutes)
Every trader should know their baseline metrics, your averages over the last 30-90 days. Without a baseline, you don't know if this week was good, bad, or normal.
The five metrics that matter most for a weekly review:
Win Rate: What percentage of trades were winners? More importantly, how does this week compare to your 30-day average? A 45% win rate sounds bad in isolation, but if your 30-day average is 48%, you're within normal range. If your 30-day average is 62%, something changed this week.
Average Win vs. Average Loss (Risk-Reward): Are your winners bigger than your losers? The ratio matters more than the win rate. If your average winner is $380 and your average loser is $220, you're 1.73:1. Compare to your baseline. Use the Risk/Reward Calculator if you need to check whether a specific setup's R:R still justifies taking the trade.
Profit Factor: Total gross profit divided by total gross loss. Above 1.0 means you're net profitable. A profit factor of 1.5 means for every $1 you lose, you make $1.50. This is the single best snapshot of whether your edge is intact.
Number of Trades: Did you trade more or fewer times than usual? More trades than your average often correlates with lower quality. If your trade count is significantly above your baseline, check the overtrading signals: does your P&L degrade after the first few trades of the day?
Maximum Drawdown (Intra-Week): What was your worst peak-to-trough moment? If your account went from +$1,200 on Wednesday to -$400 on Thursday before recovering, that $1,600 swing tells you something about risk management even if you ended the week positive. If you're coming off a significant drawdown, the Drawdown Recovery Calculator shows you the realistic math of how long recovery takes at your current win rate.
Write down each metric next to your baseline. Circle anything that's more than 15% away from your average. That's where the insight is.
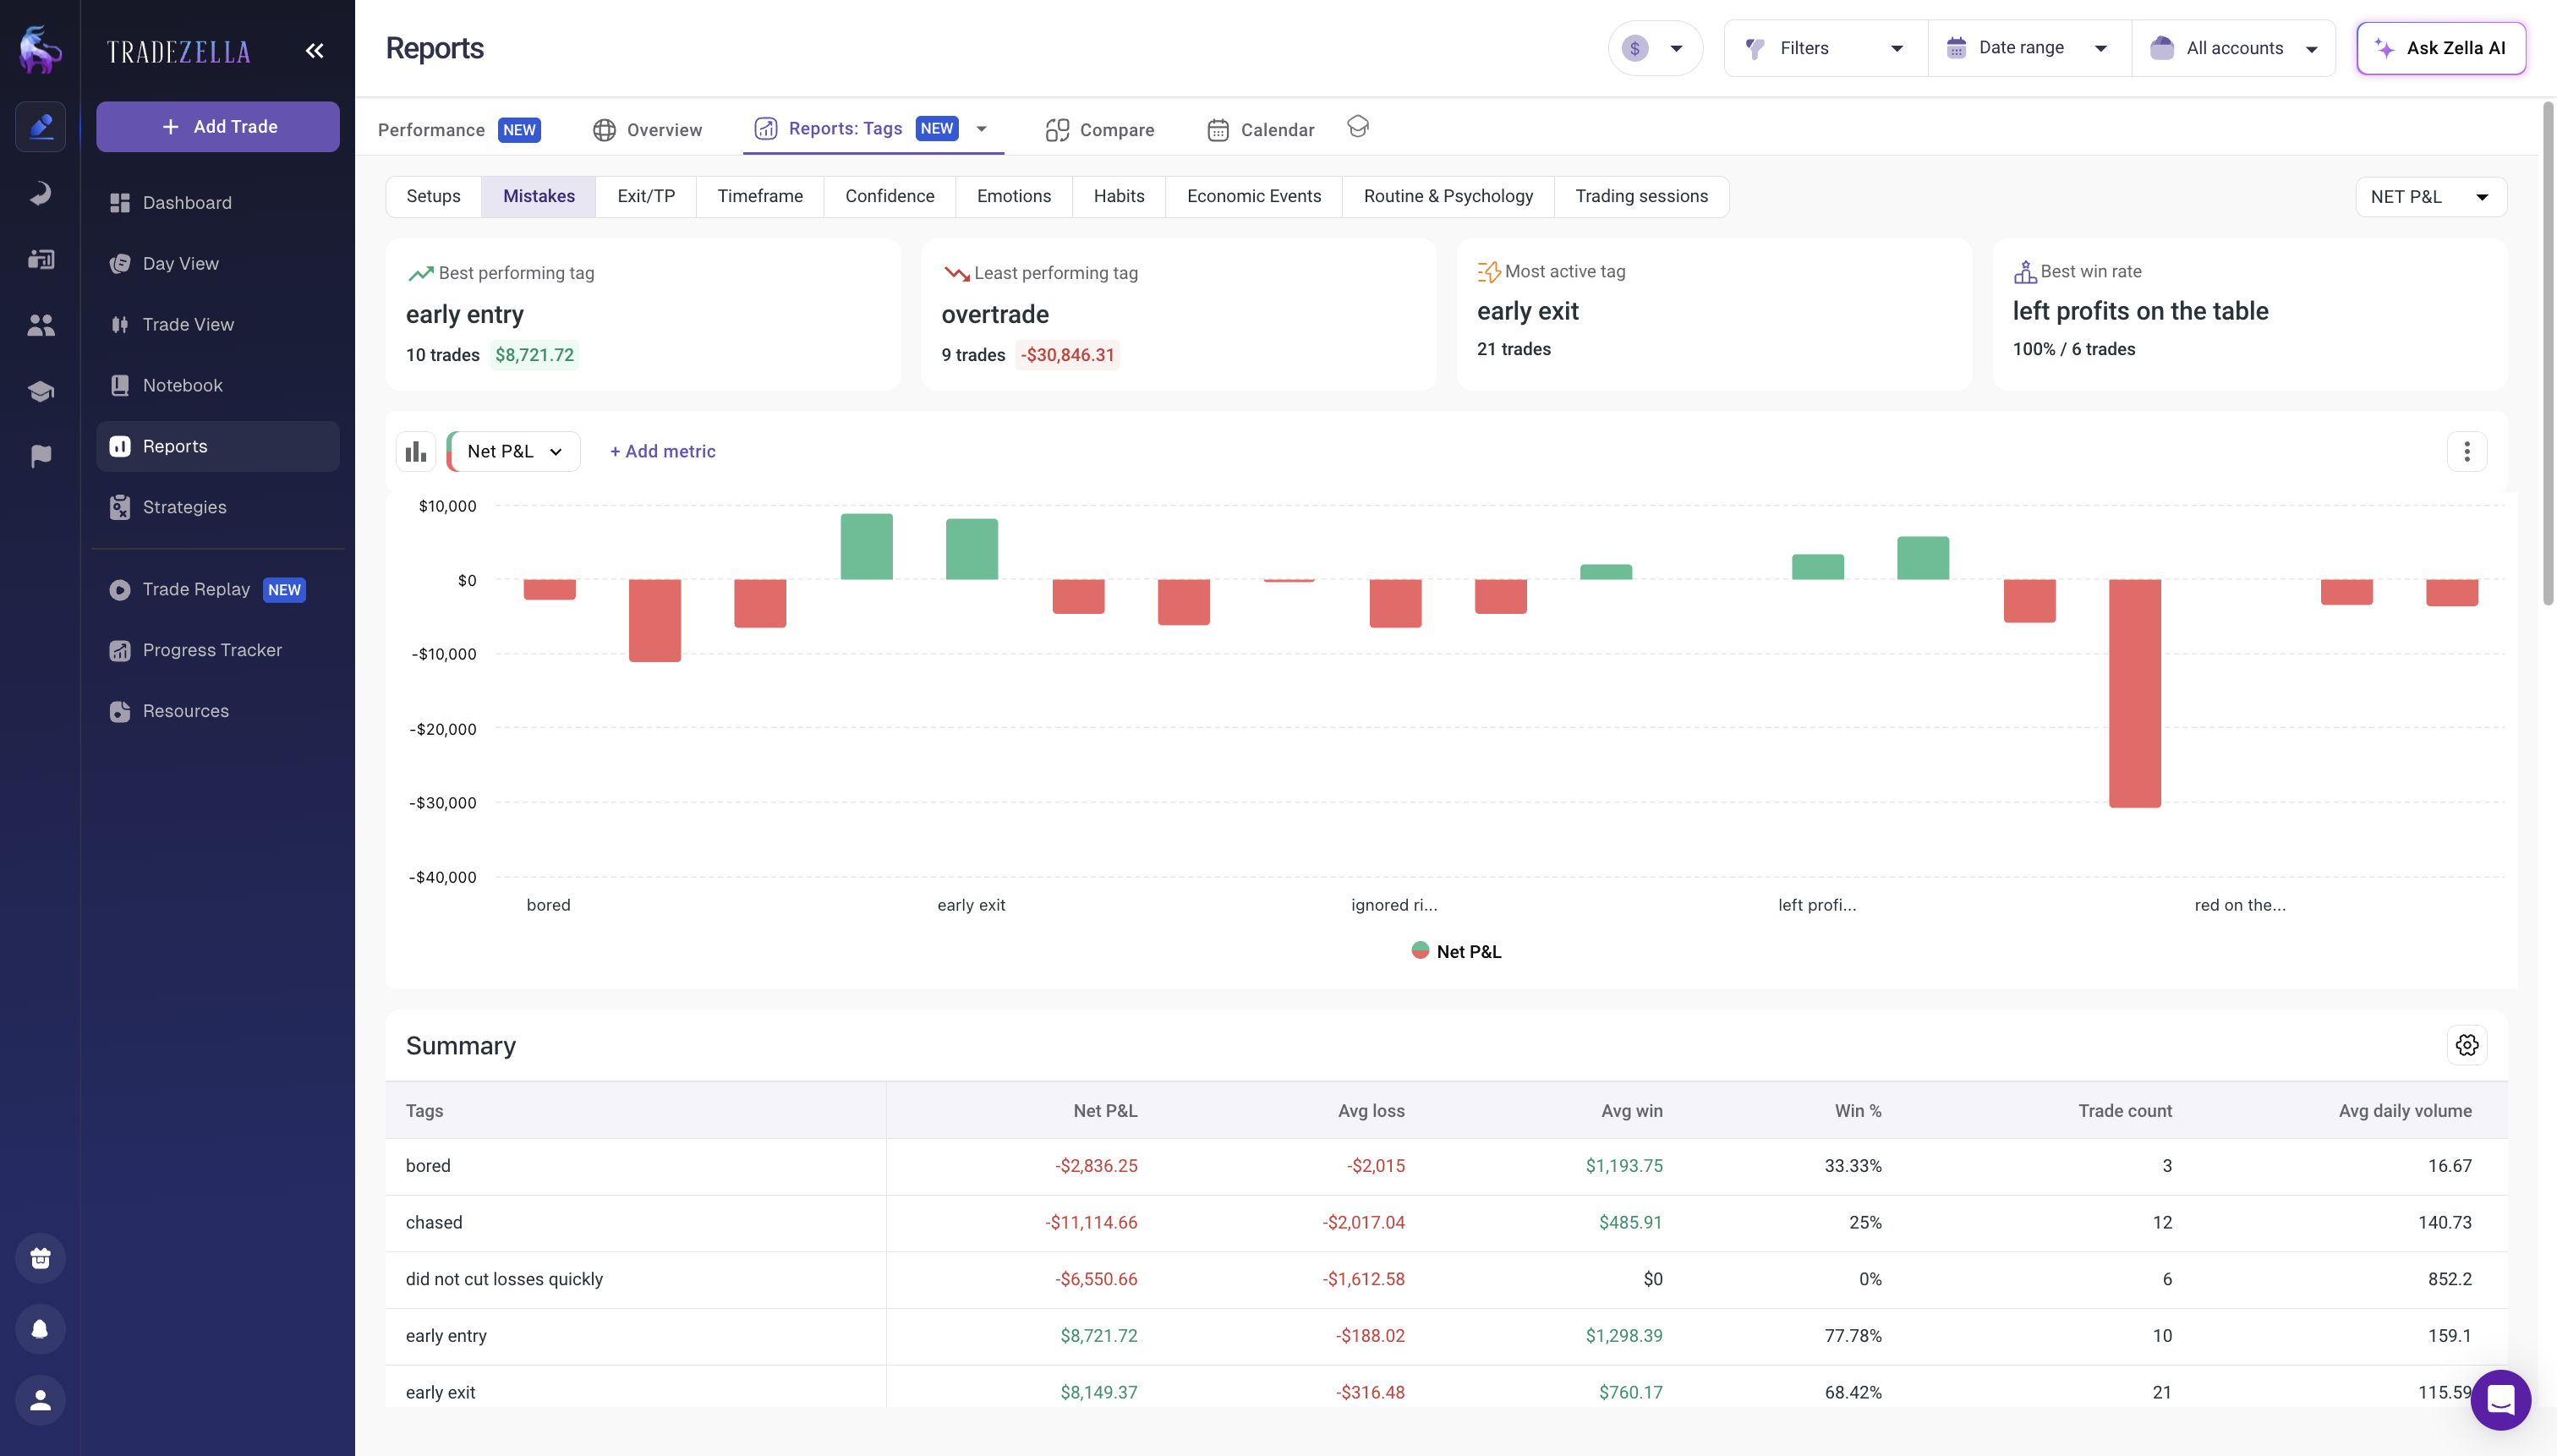
Step 3: How Do You Sort Winners From Losers to Find the Real Story? (5 Minutes)
Now you zoom in. Pull up all your trades for the week and sort them into two groups: winners and losers.
For your winners, ask:
Did they follow my strategy criteria exactly, or did I get lucky on a trade I shouldn't have taken?
What was the average hold time on winners? Am I cutting winners short or letting them run properly?
Was there one big winner that skewed the week? If I remove the biggest winner, am I still profitable?
For your losers, ask:
Did I follow my stop loss, or did I move it / hold past it?
Were these trades from my A+ setups that just didn't work, or were these lower-quality entries?
How many of these losses were on the same setup type?
The most important question across both groups: Were my losses from good trades that didn't work out, or from trades I shouldn't have taken in the first place?
A losing week where every trade followed your rules perfectly is a normal variance week. No adjustments needed. A winning week where half your profits came from off-plan trades that happened to work is actually a warning sign. You were rewarded for bad behavior, and that rarely lasts.
Step 4: What Pattern Breaks Should You Look For? (7 Minutes)
This is the most valuable part of the review. You're looking for anything that deviated from your normal patterns.
Performance by setup type. If you trade 3 different setups (VWAP bounce, opening range breakout, pullback to moving average), check each one separately. Maybe your overall week was flat, but your VWAP bounces were 4/5 wins while your pullbacks were 0/4. That's not a bad week. That's a signal that one setup is working in current market conditions and another isn't.
In TradeZella, strategy analytics let you see win rate, profit factor, and average P&L for each setup independently. If you set up your strategies, this comparison takes 30 seconds instead of manual calculation.
TradeZella strategy analytics
Performance by time of day. Did you make most of your money in the first hour? Did you give it back after lunch? Time-of-day analysis is one of the most underused review tools because most journals don't make it easy. But the pattern is often stark. Many scalpers and day traders find that 70-80% of their profits come from the first 90 minutes, and afternoon trading is a net drag.
Performance by ticker/instrument. Are you consistently losing on the same stock? Some traders have "nemesis tickers," instruments they keep trading despite negative expectancy because they feel familiar. The data makes this obvious.
Tagged trade review. If you tagged any trades during the week (emotional entries, FOMO, revenge trades, B-setups), pull those up separately. What percentage of your loss came from tagged trades? This is usually the biggest revelation.
Step 5: How Do You Write the 3 Observations That Actually Matter? (5 Minutes)
Not 10 observations. Not a full journal entry. Exactly three.
Why three? Because it forces prioritization. You can't write "I need to be more disciplined, manage risk better, take only A+ setups, stop trading after 11am, reduce size on Fridays, stick to my stop loss, and stop checking P&L after every trade." That list is useless because you can't focus on 7 things simultaneously.
Three observations. Here's the format that works best:
Observation 1 (What I did well): Start with what worked. This isn't feel-good fluff. It's identifying behavior to continue. "My VWAP bounce setup was 4/5 this week because I was patient waiting for confirmation. I didn't chase the first touch."
Observation 2 (What cost me): The specific behavior or pattern that hurt performance. "I took 3 trades on Thursday after hitting my daily loss limit. All three lost. Without those trades, I'd be up $400 instead of down $200."
Observation 3 (One adjustment for next week): Not a vague intention. A specific, measurable rule change or focus area. "Next week: if I hit my daily loss limit, I'm closing the platform immediately. No 'one more trade.' Platform closes, done."
Keep a running log of these weekly observations. After a month, review the observations themselves. You'll start seeing meta-patterns. Maybe you write "I overtraded on Thursday" three weeks in a row. That's a structural problem, not a willpower problem, and it needs a structural solution. This is exactly how habit tracking works: the data reveals the pattern, and the pattern points to the fix.
Step 6: How Do You Make One Strategy Adjustment Each Week? (5 Minutes)
Based on this week's review, make one, and only one, adjustment to your trading plan.
This could be:
Adding a filter: "I'm adding a rule to my VWAP bounce setup: only take it if volume is 1.5x the 10-day average in the first 15 minutes."
Removing a setup temporarily: "Pullbacks to the 20 EMA haven't worked for 3 consecutive weeks. I'm pausing this setup until market conditions change."
Adjusting a parameter: "My stop losses on breakout trades are too tight. 5 of my 7 losses this week stopped me out before the move. I'm widening stops from 0.5% to 0.75% and reducing size to keep dollar risk the same."
Changing a behavioral rule: "I'm setting a hard stop at 3 consecutive losing trades. After 3, I take a 30-minute break regardless of time."
One adjustment per week. Not three. Not zero. One forces you to commit to the most impactful change. If you change nothing, you're ignoring your data. If you change three things, you won't know which one worked.
Document the adjustment in your strategy so it's visible during your next trading session. In TradeZella, you can update your strategy rules directly. The adjustment becomes part of your documented strategy, not a mental note you'll forget by Tuesday.
Before committing to the adjustment, stress-test it. If you're changing your stop distance, run the Monte Carlo Simulator with the new parameters to see how the change affects your equity curve distribution over 1,000 simulated paths. A small stop change that improves win rate but reduces R-multiple may not actually help.
What Does the Full 30-Minute Framework Look Like?
Step
Time
What You Do
Key Question
1. Week at a Glance
3 min
Calendar view. Spot the shape of the week: green days, red days, magnitude.
What's the narrative of this week?
2. Metrics vs Baseline
5 min
Win rate, R:R, profit factor, trade count, max drawdown. Compare to 30-day average.
Is anything more than 15% off my baseline?
3. Sort Winners & Losers
5 min
Separate all trades into wins and losses. Check if losses followed rules or broke them.
Were losses from good trades or bad decisions?
4. Pattern Breaks
7 min
Setup performance, time of day, tickers, tagged trades. Find what deviated from normal.
Which setup, time, or behavior is out of line?
5. Write 3 Observations
5 min
What worked. What cost me. One adjustment for next week.
If I could only change one thing, what has the most impact?
6. Adjust Strategy
5 min
One specific, measurable rule change. Document it in your strategy.
Can I define this adjustment in one sentence?
Total: 30 minutes
Every Sunday evening or Monday morning before the open.
Total: 30 minutes. Do this every Sunday evening or Monday morning before the open.
The compounding effect is what makes this powerful. One adjustment per week equals 52 refinements per year. After 3 months of weekly reviews, your strategy is measurably tighter, your pattern awareness is sharper, and your average week looks noticeably different from where you started, because you have 12 weeks of data proving which changes worked and which didn't.
What Are the Most Common Mistakes That Kill the Review Process?
Reviewing every single trade in detail. You don't need to replay every trade every week. The aggregate patterns tell you more. Save deep trade-by-trade analysis for your biggest winners and biggest losers, maybe 3-4 trades per week get a deep dive.
Only reviewing losing weeks. Winners need reviews too. A winning week built on solid process should be reinforced. A winning week built on lucky entries should be corrected before the luck runs out.
Making the review too long. If your review takes 90 minutes, you'll skip it. Thirty minutes, consistently, beats two hours every other week.
Changing too many things at once. This is the most common killer. You have a bad week, panic-change five things about your strategy, then can't tell what's working the next week. One adjustment. Always one.
Not having a baseline. Without knowing your averages, every week feels like either a celebration or a crisis. Track your 30-day rolling averages and compare against those, not against an idealized version of your trading.
Not reviewing during prop firm challenges. Traders on funded evaluations often skip reviews because they're focused on hitting the profit target. This is backwards. The weekly review is even more important during a challenge because one structural mistake (like overtrading on Thursdays) can cost you the evaluation. The review catches it before it compounds.
How Swing Traders Should Adapt This Framework
If you're a swing trader taking 3-5 trades per week instead of 3-5 per day, you may not have enough data for a meaningful weekly review. In that case, switch to a bi-weekly or monthly review cadence, but use the same 6-step framework. The metrics and questions stay the same. You just need more trades before the patterns become statistically meaningful (aim for at least 15-20 trades per review period).
Key Takeaways
The weekly review, not the daily journal entry, is where actual improvement happens. The journal is data collection; the review is the analysis.
The 30-minute framework has 6 steps: week overview, metrics vs baseline, sort winners/losers, identify pattern breaks, 3 observations, one strategy adjustment.
One adjustment per week is the optimal pace. More creates confusion. None wastes the data you collected.
Review winning weeks, not just losing ones. Reinforcing good process matters as much as fixing bad habits.
Keep a running log of your weekly observations. The meta-patterns that emerge over 4-8 weeks reveal structural issues that weekly snapshots can't.
Use TradeZella's free calculators to validate your adjustments before committing (position sizing, risk/reward, Monte Carlo simulation).
A structured weekly review is the best balance of thoroughness and sustainability. Daily reviews tend to be too reactive, one bad trade feels like a crisis. Monthly reviews are too infrequent, by the time you spot a pattern, you've repeated it for four weeks. The weekly cadence gives you enough data to spot real patterns while being soon enough to make timely adjustments.
What's the difference between a trade journal and a trade review?
The journal is the data layer: logging your entries, exits, setup type, size, and notes. The review is the analysis layer: looking at that data in aggregate to find patterns, measure against your baseline, and make specific improvements. Most traders journal but don't review, which is like collecting medical test results and never reading them.
What metrics should I track in my weekly review?
Focus on five: win rate, average win vs. average loss (risk-reward ratio), profit factor, number of trades, and maximum intra-week drawdown. Compare each against your 30-day rolling average. Anything more than 15% above or below your baseline deserves investigation.
How long before I see results from weekly reviews?
Most traders report noticeable improvement within 4-6 weeks of consistent reviews. The first 2 weeks are about establishing your baseline and getting the process down. Weeks 3-4, you start making meaningful adjustments based on real data. By week 6, you've made 4-6 refinements to your strategy, and the compound effect becomes visible in your metrics.
Should I review trades I didn't take?
Only if a missed trade is part of a pattern you're tracking. If you're consistently missing your A+ setup because you're already in a lower-quality trade, that's worth noting. But cataloging every trade you "should have taken" leads to hindsight bias and FOMO. Focus on what you actually did, not what you could have done.
Can I use a spreadsheet instead of a dedicated journal for reviews?
You can, but it adds friction. A spreadsheet requires manual calculation for every metric, manual sorting for setup performance, and manual filtering for time-of-day and tag analysis. A dedicated journal like TradeZella calculates win rate, profit factor, expectancy, and drawdown automatically and lets you filter by strategy, time, and tag in seconds. The 30-minute framework assumes you have these analytics built in. With a spreadsheet, the same review takes 60-90 minutes. If you want to start with a spreadsheet, TradeZella's free trading journal template has the formulas pre-built.
What should my first trade review look like if I've never done one?
Your first review is about establishing baselines, not making changes. Follow Steps 1-4 as described but skip Steps 5-6. Instead of writing observations and making adjustments, just record your current metrics: win rate, average win/loss, profit factor, average trade count per day, and your best/worst performing setup. This becomes your baseline for every future review. Start making adjustments from week 2 onward.


.png)