

Built For
Instruments: Futures
Trading Style: Scalping/ Day Trading
Strategy Overview
The Institutional Order Flow & Iceberg Trading Strategy focuses on identifying where large market participants are trading and using that information to find trading opportunities.
Instead of relying only on candlestick patterns, support and resistance, or technical indicators, the strategy looks at the actual buying and selling activity behind price movements.
The approach focuses on four main market drivers:
- Iceberg Orders and Stop Runs: Reveal hidden institutional orders and areas where traders are being forced out of positions.
- Options Flow: Shows how options-related hedging activity can influence futures prices.
- Algorithms: Create short-term price movements and reversals.
- Institutional Program Buying and Selling: Produces strong directional moves when large institutions buy or sell baskets of stocks.
The foundation of the strategy is iceberg orders and stop runs.
Important price levels are identified before trading, but a trade is not entered simply because price reaches one of those levels. Significant order flow activity must appear, and price must confirm the expected direction.
The strategy uses two main trading approaches:
- Position Trade: Capture a larger directional move after price confirms movement away from an iceberg or stop-order event.
- Reversion Trade: Capture a move back toward the original event zone after price becomes extended.
Options flow, algorithms, and institutional activity provide additional information to help determine whether the market is likely to continue, reverse, or remain within a range.
Understanding Iceberg Orders and Stop Runs
Iceberg orders and stop runs reveal where significant trading activity is occurring.
They help identify areas where large participants are active and where traders may be trapped in losing positions.
Iceberg Orders
An iceberg order is a large order that hides most of its size from the visible order book. Large institutions use iceberg orders to execute positions without displaying their full size to other market participants and trading algorithms.
For example, a large buyer may want to purchase 1,000 contracts but display only a small portion of that order.
As the visible contracts are filled, additional contracts become available. This allows the institution to absorb selling without revealing the full order. The strategy uses CME Market by Order (MBO) data through Bookmap to identify this activity.
Buy Iceberg
A buy iceberg occurs when a large participant absorbs aggressive selling.
Price may be falling toward an important support area while sellers continue entering the market. If a large buyer absorbs that selling, price may stop falling and begin moving higher.
However, a buy iceberg alone does not confirm a bullish trade. Price must demonstrate that the buying activity is strong enough to support a directional move.
Sell Iceberg
A sell iceberg occurs when a large participant absorbs aggressive buying.
Price may be moving higher toward an important resistance area while buyers continue entering. If a large seller absorbs that buying, price may struggle to continue higher and begin falling.
As with buy icebergs, the price response determines whether the event becomes a trading opportunity.
Stop Runs
A stop run occurs when price reaches an area containing stop orders. For example, traders holding short positions may have stop-loss orders above a recent high.
When price reaches those orders, the short positions are closed through buying activity. This can create a sudden upward movement.
However, the buying may represent traders exiting losing positions rather than new buyers entering the market.
The same applies to sell stops.
When traders holding long positions are stopped out, their exits create selling activity. This selling does not necessarily mean new sellers are entering the market.
Stop runs are important because price can reverse after the forced buying or selling has finished.
Why These Events Matter
Large iceberg and stop-order events identify areas where significant trading activity has occurred.
When price moves away from these areas, traders who entered on the wrong side may become trapped.
If price later returns, those traders may attempt to exit their positions. This behavior can influence how the market reacts around the original event. The strategy uses these events to identify both directional trades and reversions.
Minimum Iceberg and Stop Order Requirements
Not every iceberg or stop run is large enough to trade. The strategy uses minimum contract thresholds for each market, based on years of watching these events. Anything below the threshold is ignored, and the zone drawing tool will not draw it.
For example, an ES buy iceberg of 300 contracts does not qualify. An ES buy iceberg of 800 contracts does.
Meeting the threshold does not create a trade on its own. The event must happen at an important price area, and price must confirm the setup.
The edge works in any futures market. If ES or NQ is quiet, the same events can be traded in markets such as wheat or soybeans, as long as the volume and volatility are there.
Using ATR to Confirm Trade Entries
The strategy uses the 5-minute Wilder’s Average True Range (ATR) to measure price movement around significant iceberg and stop-order events.
ATR measures how much price typically moves over a given period. It helps determine whether price has moved far enough away from an event to confirm a directional move or create a potential reversion opportunity.
Identifying the Event Zone
When a significant iceberg or stop run occurs, the price area where the activity took place is marked as an event zone.
This zone becomes the reference point for measuring price movement.
Confirming the Direction
- For a bullish position trade, price must move one full ATR above the event zone.
- For a bearish position trade, price must move one full ATR below the event zone.
This confirms that price has moved a meaningful distance away from the original event.
The 115% ATR Rule
Although one ATR confirms the direction, the actual position-trade entry occurs at 115% ATR beyond the event zone.
The additional 15% helps avoid entering too early when price may still return to the original event.
- For a long trade, the entry is 115% ATR above the zone.
- For a short trade, the entry is 115% ATR below the zone.
The stop-loss is placed 115% ATR beyond the opposite side of the event zone. These rules apply to the Position Trade model.
Trading Models
The strategy uses two main approaches built around significant iceberg and stop-order events.
- The Position Trade looks for price to continue moving away from the event.
- The Reversion Trade looks for price to return toward the event after moving an extended distance away.
Model 1: Position Trade
The Position Trade aims to capture larger directional movements after significant iceberg or stop-order activity.
The setup begins at an important price area where a meaningful market reaction may occur. However, reaching an important level is not enough to enter a trade.
A significant iceberg or stop-order event must appear, followed by confirmation that price is moving away from the event zone.
Step 1: Identify an Important Price Area
Begin by identifying an important market level. This may include support and resistance, gamma levels, VWAP, or another price area used in the trading plan.
The purpose is to identify where a significant market reaction may develop.
Step 2: Wait for a Significant Order Flow Event
A qualifying iceberg or stop-order event must occur at the important area. The event must meet the minimum contract threshold for the instrument.
Once the event appears, mark the event zone. This zone becomes the reference for the entry and stop-loss.
Step 3: Wait for ATR Confirmation
Price must move one full 5-minute Wilder’s ATR beyond the event zone.
- For a long trade, price must move above the zone.
- For a short trade, price must move below the zone.
This movement confirms that the market is moving away from the significant trading activity.
Step 4: Enter at 115% ATR
The actual entry occurs at 115% ATR beyond the event zone.
- Long Entry: 115% ATR above the event zone.
- Short Entry: 115% ATR below the event zone.
The additional distance helps avoid entering before the market has demonstrated sufficient directional movement.
Step 5: Place the Stop-Loss
The stop-loss is placed 115% ATR beyond the opposite side of the event zone.
- Long Stop: 115% ATR below the event zone.
- Short Stop: 115% ATR above the event zone.
This means price must move back through the significant trading area and continue beyond the opposite side before the position is stopped out.
Step 6: Calculate Position Size
Position size is calculated using the distance between the entry and stop-loss.
The number of contracts depends on the amount of capital allocated to the trade.
A zone-drawing tool can calculate the appropriate position size based on the selected risk amount. The goal is to keep the potential loss within the predefined risk limit.
Step 7: Determine the Profit Target
Position Trades do not use one fixed profit target. Targets depend on important market levels and the expected movement.
Potential targets may include:
- Important gamma levels.
- Areas of resting liquidity.
- Other significant market levels.
Profits may also be taken at intermediate areas as the trade develops.
Step 8: Trail the Stop Using New Events
Stops are not automatically moved to breakeven when a trade becomes profitable.
Price frequently pulls back during directional movements, and an arbitrary stop adjustment can cause an early exit.
Instead, the stop can be trailed when a new qualifying order flow event occurs.
For example, if a long position is open and another significant bullish event appears higher in the market, the stop can be moved to 115% ATR below the new event zone.
Additional qualifying events may also provide opportunities to enter separate positions or add to an existing trade.
Position Trade Process:
Important Price Area → Significant Iceberg or Stop Event → 1 ATR Confirmation → Entry at 115% ATR → Stop Beyond Opposite Side → Manage Toward Important Levels
Model 2: Reversion Trade
The Reversion Trade aims to capture price movements back toward a significant iceberg or stop-order event.
After a large order flow event occurs, price may move one, two, or three ATRs away from the original event zone before returning toward it.
The strategy looks for opportunities to trade this return movement.
Reversion trades can develop from four types of order flow events:
- Buy iceberg
- Sell iceberg
- Buy stops
- Sell stops
The direction of the trade depends on where price moves relative to the event zone. If price moves above the zone, the setup looks for a potential short trade. If price moves below the zone, the setup looks for a potential long trade.
Step 1: Identify a Significant Event
Begin by identifying a qualifying iceberg or stop-order event.
Mark the price area where the activity occurred. This becomes the event zone and the target for the potential reversion trade.
The event must meet the minimum contract threshold for the instrument being traded.
Step 2: Mark the ATR Extensions
Use the 5-minute Wilder’s ATR to measure price movement away from the event zone.
Mark three potential extension levels:
- 1 ATR
- 2 ATR
- 3 ATR
These levels identify areas where a reversion trade may develop.
For example, if price moves two ATRs above a buy-stop event, the setup looks for an opportunity to enter short and target the original event zone.
The entry can be taken using one of the following approaches.
Reversion Entry Methods
1. Aggressive Reversion
The Aggressive Reversion enters when price reaches a selected ATR extension without requiring additional confirmation from another important price level.
For example, a significant buy iceberg appears, and price moves higher away from the event zone.
When price reaches the one-ATR extension, a short position can be entered with the objective of capturing the return toward the original event.
The same approach can be used at the two-ATR or three-ATR extension.
This is an aggressive entry because the trade is taken against the current price movement.
Entry: At a selected ATR extension.
Target: The original iceberg or stop-order event zone.
2. Back in Black Trade
The Back in Black Trade is a more selective approach that combines an ATR extension with another important price level.
Instead of entering simply because price reaches one, two, or three ATRs, the setup waits for price to reach an extension that aligns with an area where a market reaction may occur.
These areas can include:
- Gamma levels
- Fibonacci levels
- Bollinger Bands
For example, a significant buy-stop event occurs, and price continues moving higher.
The one-ATR extension aligns with an important gamma level.
When price reaches that area, the combination of the ATR extension and gamma level provides an opportunity to enter short.
The trade targets the original buy-stop event zone.
The same approach works in the opposite direction when price moves below an event zone.
Entry: At an ATR extension that aligns with another important price level.
Target: The original iceberg or stop-order event zone.
3. A+ Reversion
The A+ Reversion uses a previous significant order flow event to provide additional support for the entry.
The setup follows the same principle as a standard Reversion Trade, but the ATR extension aligns with an earlier event zone.
This previous event is important because traders who entered around that area may be waiting for price to return so they can exit their positions.
For example, a significant iceberg event occurs, and price moves away from it. As price approaches the one-ATR extension, a previous event zone is located near that level. The earlier event provides an additional reason to expect a reaction.
The entry can occur just before or inside the previous event zone, provided the stop-loss is placed outside that zone.
The trade then targets the current event zone.
Entry: At an ATR extension near or inside a previous event zone.
Stop-Loss: Outside the previous event zone.
Target: The current iceberg or stop-order event zone.
Reversion Trade Target
All three entry approaches share the same objective: capture the return toward the original event zone.
The main difference is how the entry is selected. Aggressive Reversion uses the ATR extension alone.
Back in Black looks for an ATR extension that aligns with another important price level. A+ Reversion uses a previous order flow event near the ATR extension to provide an additional entry reference.
These trades are generally shorter-term opportunities focused on capturing the movement back toward significant order flow activity.
Reversion Trade Process:
Significant Iceberg or Stop Event → Mark ATR Extensions → Select Reversion Entry Method → Enter Trade → Target Original Event Zone
Additional Order Flow Patterns
Different combinations of iceberg orders, stop runs, and price structure can provide additional information about potential market movements.
These patterns help identify whether important price areas are holding or failing.
Double Whammy
The Double Whammy occurs when sell stops and a buy iceberg appear around the same price area.
As price moves lower, sell stops are triggered when traders exit their long positions. At the same time, a significant buy iceberg appears and absorbs the selling.
The sell stops represent forced selling, while the buy iceberg shows that a large buyer is active at the same area. This combination can support a potential bullish reversal.
The important factor is that significant buying activity appears while other traders are being forced out of their positions.
Broken Ice
Broken Ice occurs when an iceberg order fails to hold price. For example, a large buy iceberg may appear as price moves lower.
However, instead of reversing higher, price continues falling. This indicates that the buying activity was not strong enough to stop the decline.
A move one ATR below the event zone can provide bearish confirmation for a position trade. The pattern demonstrates that a large iceberg does not guarantee a reversal. The market’s response determines whether the event supports a trade.
Failed Balance Breakout
The Failed Balance Breakout combines market structure with order flow confirmation. Markets generally move between two conditions: balancing and trending.
A balance occurs when price trades within a range.
A breakout occurs when price moves outside that range.
A failed breakout develops when price attempts to leave the range but cannot maintain the movement.
In a bearish example, price breaks above a balance area but fails to continue higher. It then moves back into the range and through the high-volume area near the middle. A buy iceberg appears, but the buying fails to hold price. This creates a Broken Ice event.
Once price moves one ATR below the event zone, the bearish direction is confirmed.
The setup combines a failed breakout with significant order flow activity rather than relying on the chart pattern alone.
Options Flow and Gamma Levels
Options flow is another important part of the strategy. Options dealers frequently need to buy or sell futures to hedge their positions. This activity can influence futures prices and create important areas where the market may react.
The strategy pays particular attention to zero-days-to-expiration (0DTE) options. These options expire on the same trading day and can create significant hedging activity. Tools such as SpotGamma and MenthorQ help identify important options-related levels.
Gamma Levels
Gamma levels identify areas where options positioning may create meaningful dealer hedging activity.
These levels can act as:
- Areas that attract price.
- Potential support or resistance.
- Targets for existing positions.
- Important areas to watch for new order flow events.
Significant 0DTE gamma levels can attract price during the trading session. However, these levels are not traded blindly.
A significant iceberg or stop-order event is still required to confirm the trading opportunity.
For example, if price reaches an important gamma level and a qualifying buy iceberg appears, the area can be evaluated for a potential long trade. The ATR rules then determine whether the market confirms the bullish direction.
Positive and Negative Gamma
Positive gamma conditions can contribute to more range-bound price movements. Dealer hedging may reduce price movement by creating buying pressure as price falls and selling pressure as price rises.
Negative gamma conditions can contribute to larger directional movements.
In these conditions, dealer hedging may amplify price movements rather than reduce them. Understanding the gamma environment helps identify whether the market may be more likely to range or trend.
Combining Gamma With Order Flow
Gamma levels become more useful when combined with significant iceberg or stop-order activity.
For example, price may move above an important gamma level that previously acted as resistance.
If the market holds above that level and a significant buy iceberg appears, the area may become support. A higher gamma level can then provide a potential profit target.
The purpose is to use options-related levels as additional information while keeping actual order flow activity at the center of the trade.
Using HIRO to Identify Market Reversals
HIRO is a SpotGamma tool that tracks the hedging impact of real-time options activity.
It helps identify whether options-related flows are supporting or opposing movements in futures.
Large Options Flow Movements
Significant changes in options-related notional exposure can influence futures prices. Movements of approximately $1 billion or more are treated as meaningful reference points. When options flow moves sharply lower, dealers may need to sell futures to hedge their positions.
When the flow moves higher, the hedging activity may create buying pressure. However, other market participants can sometimes absorb this activity. As a result, futures prices may not respond immediately.
HIRO Flow Alerts
HIRO flow alerts identify significant changes in options-related activity. These alerts can provide additional information when evaluating potential reversals.
For example, price may be extended away from an iceberg event while a significant options flow alert appears.
This can provide another reason to watch for a reversion toward the original event zone.
Identifying Divergence
A divergence occurs when futures prices and HIRO move differently. For example, futures may make a lower low while HIRO does not make a corresponding lower low.
This indicates that the options-related flow is not confirming the new futures low. The divergence can suggest that selling pressure is weakening and a bounce may develop.
When combined with a significant iceberg or stop-order event, this information can strengthen a potential reversal setup.
Algorithmic Trading and Price Change Signals
Algorithms can create repeated short-term price movements, particularly when the market is trading within a range.
These movements can cause price to reverse frequently, making it difficult to hold directional positions. The strategy uses Bookmap’s Market Pulse Price Change tool to identify this activity.
Understanding the Price Change Signal
The tool uses the following default settings:
- Five-minute measurement window.
- 70% price-change threshold.
When price moves far enough within the measurement window, the tool produces an alert. These alerts can identify areas where short-term reversals may occur. However, the signal does not guarantee that price will reverse at an exact level.
Using Price Change Signals to Manage Trades
Price-change signals can be used to scalp around an existing position. For example, a short position may be open with a larger downside target.
As price moves lower, a price-change signal may indicate a potential short-term reversal. Part of the short position can be closed. If price moves higher and then begins falling again, that portion can be re-entered.
A core position remains open in case the market continues toward the larger target. This approach allows the trader to take advantage of shorter-term movements without completely exiting the original position.
The price-change tool can also be used for independent scalping opportunities when the market is ranging.
Identifying Institutional Program Buying and Selling
Institutional program buying and selling occurs when large institutions buy or sell baskets of stocks.
This activity can create strong directional movements that continue much longer than normal.
During these periods, price may not return toward earlier trading areas as frequently as it does under ordinary market conditions.
Recognizing this activity is important because repeatedly trading against it can lead to significant losses.
Monitoring TICK Readings
NYSE and Nasdaq TICK readings help measure broad buying and selling pressure.
- Readings around positive or negative 500 are common reference points.
- Readings around positive or negative 1,000 are more extreme.
However, the important factor is whether TICK remains at an extreme level.
For example, if TICK reaches −1,000 and quickly returns toward zero, the selling pressure may be temporary.
If TICK remains near −1,000 for an extended period and reaches −1,300 or −1,400, it may indicate sustained institutional selling.
Monitoring Relative Volume
Relative volume measures current trading activity compared with normal volume.
The strategy compares the current five-minute volume with the same five-minute period over the previous 30 days.
A reading of 200% means the current period is trading approximately twice its normal volume.
Relative volume of 200% or higher can indicate unusually strong market participation.
Recognizing Program Selling
Program selling may be present when:
- Price continues moving sharply lower.
- TICK remains at extremely negative levels.
- Relative volume is unusually high.
- The market does not make its normal reversions.
These conditions suggest that significant institutional selling pressure may be driving the market.
The main rule is to avoid fading these moves.
Even if price reaches an ATR extension that would normally create a reversion opportunity, strong program selling may continue pushing the market lower.
The same principle applies during sustained institutional buying.
Risk Management and Position Sizing
Risk management focuses on defining the entry, stop-loss, and amount of capital at risk before entering a trade.
Define the Risk Before Entering
For Position Trades, the entry and stop are based on the 115% ATR rules. This establishes the distance between the entry and stop before the trade is executed. Position size is then calculated according to the selected risk amount.
Adjust Position Size
The number of contracts depends on the distance between the entry and stop. A wider stop requires a smaller position to maintain the same risk. A narrower stop allows a larger position while keeping the planned risk consistent.
Avoid Arbitrary Stop Adjustments
Stops should not be moved simply because a trade becomes profitable. For Position Trades, new qualifying order flow events provide references for trailing stops. This helps avoid premature exits during normal market pullbacks.
Use a Daily Loss Limit
A maximum daily loss should be established before trading. Broker-enforced limits can help prevent losses from exceeding the planned amount.
Focus on Execution Instead of P&L
Constantly watching profit and loss can influence trading decisions. Hiding the running P&L can help keep attention on the setup, market conditions, and predefined risk.
The Complete Trading Process
Step 1: Identify Important Price Areas
Mark the levels where a meaningful market reaction may occur. These may include support and resistance, gamma levels, VWAP, or other important areas.
Step 2: Wait for Significant Order Flow
Monitor iceberg orders and stop runs. Only consider events that meet the minimum contract threshold for the instrument.
Step 3: Mark the Event Zone
Identify the price area where the significant activity occurred. Use the 5-minute Wilder’s ATR to measure price movement around that zone.
Step 4: Select the Trading Model
For a Position Trade, wait for price to confirm a directional move away from the event zone.
For a Reversion Trade, wait for price to reach a measured ATR extension and evaluate a move back toward the original event.
For Back in Black, look for an additional important level near the ATR extension.
For A+ Reversion, look for a previous event zone supporting the potential entry.
Step 5: Evaluate Market Conditions
Check gamma levels, options flow, algorithmic price-change signals, TICK, and relative volume. These provide additional information about whether the market is ranging, trending, or experiencing strong institutional activity.
Step 6: Define Entry and Risk
For Position Trades, use the 115% ATR entry and stop rules.
For A+ Reversion, use the previous event zone as the stop reference.
For standard Reversion Trades, use the selected ATR extension and original event-zone target.
Determine position size based on the planned risk.
Step 7: Manage the Trade
For Position Trades, monitor important market levels and new qualifying order flow events. Trail stops using new events when appropriate.
For Reversion Trades, the target is the original event zone.
Price-change signals may also be used to manage portions of existing positions.
Step 8: Respect the Daily Loss Limit
Stop trading when the predefined daily loss limit is reached. The objective is to maintain consistent risk rather than increase position size or continue trading to recover losses.
Trade Breakdown
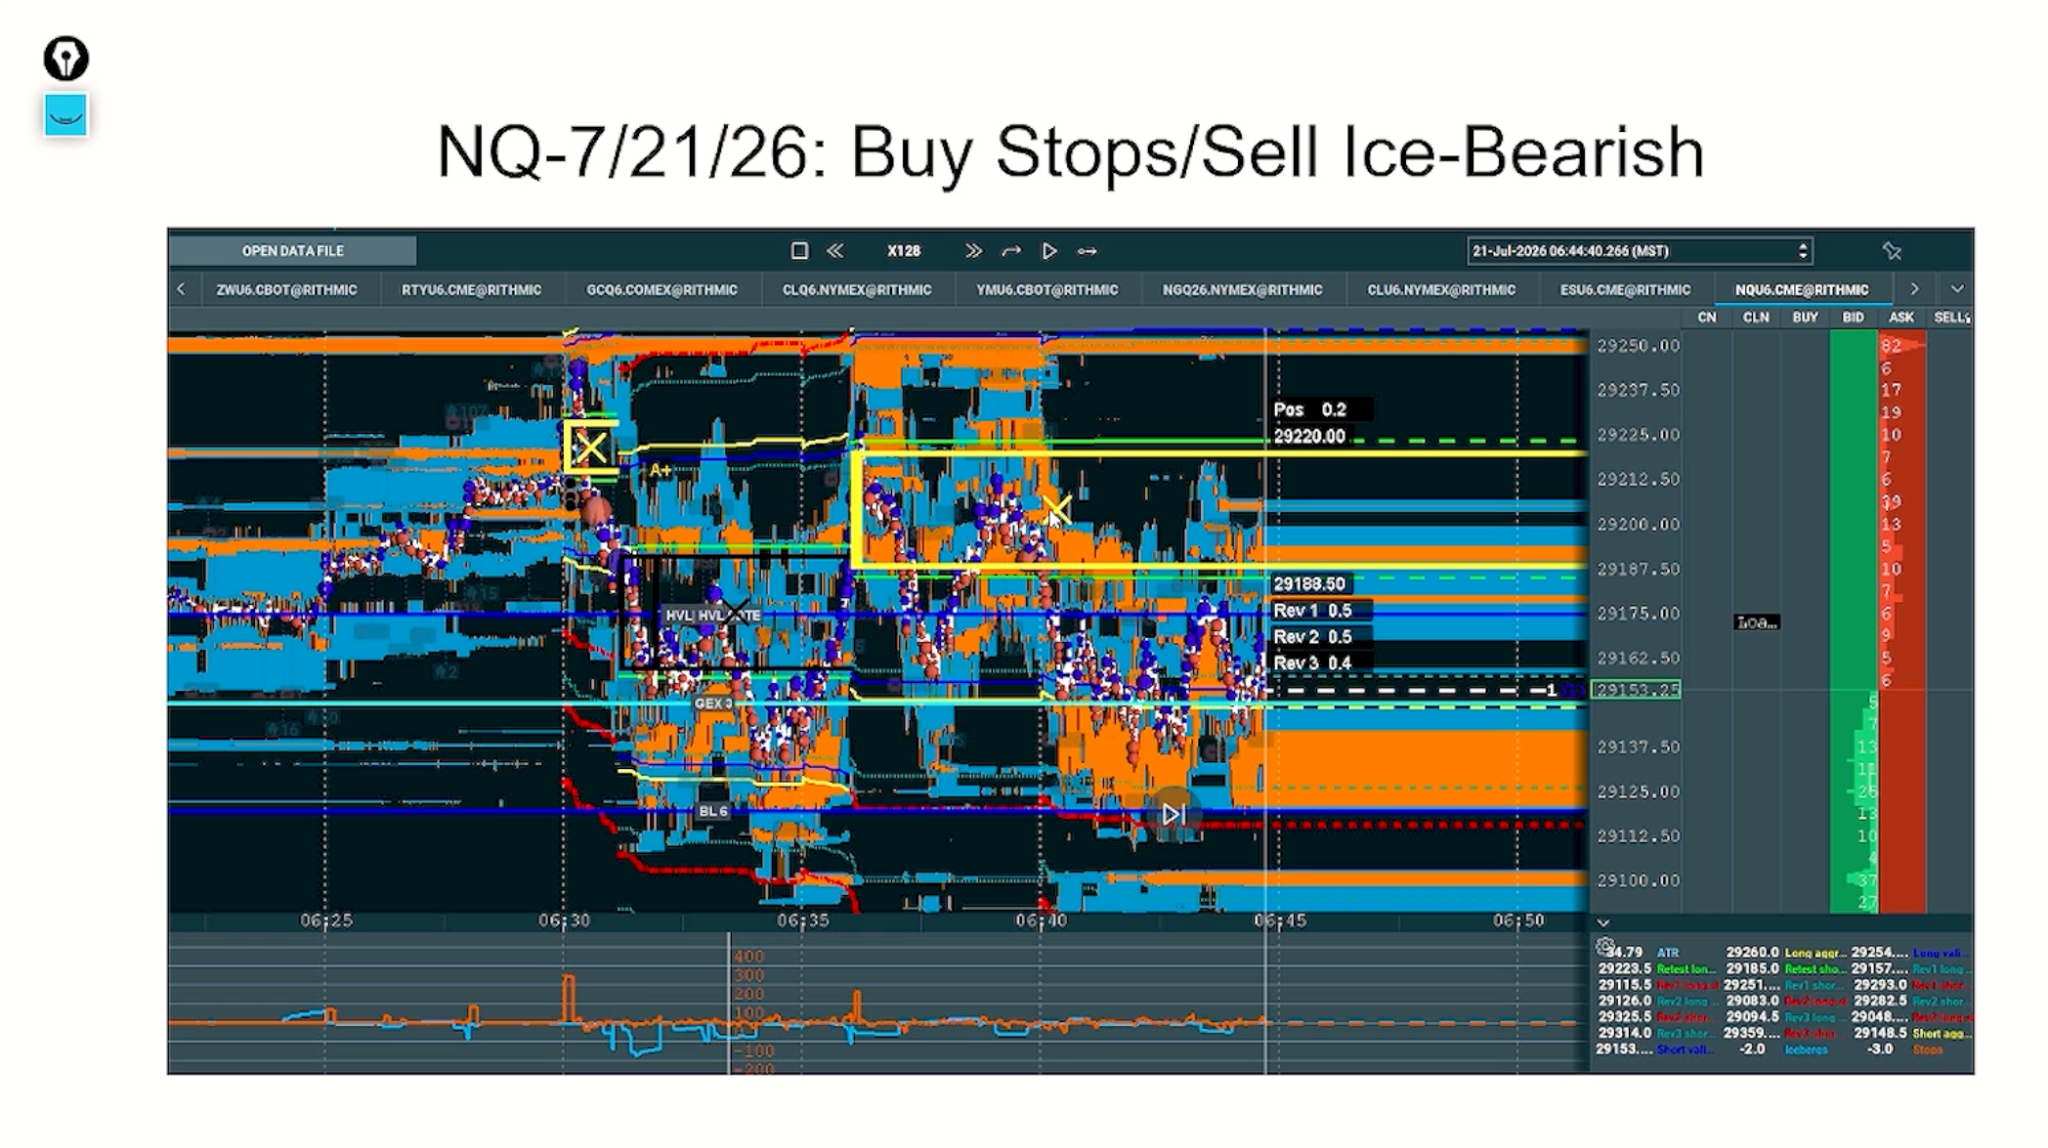
Trade Example 1: Nasdaq Short Trade Using Buy Stops and Sell Iceberg
This trade demonstrates how significant order flow activity can identify a bearish opportunity even when price initially appears to be moving higher.
Trade Setup
Nasdaq was moving higher, triggering buy stops as traders holding short positions exited their trades.
Although the upward movement appeared bullish, much of the buying came from traders closing their positions rather than new buyers entering the market.
Significant sell iceberg activity appeared around the same area, indicating that large sellers were active. The market initially attempted to move higher but failed to maintain the move.
Entry Confirmation
The significant order flow activity created an event zone. Rather than entering short immediately when the sell iceberg appeared, the setup required price to move one ATR below the event zone to confirm the bearish direction.
The short-entry level was positioned at 115% ATR below the event zone, using the 5-minute Wilder’s ATR.
Stop-Loss
The stop-loss was positioned 115% ATR above the opposite side of the event zone. This allowed price to move back toward the original trading activity without immediately invalidating the setup. The market briefly moved higher during the decline but did not reach the stop-loss level.
Trade Outcome
After the bearish confirmation, Nasdaq continued moving lower. Additional order flow activity appeared during the move, including a buy iceberg that failed to support price.
The market eventually declined approximately 200 Nasdaq points.
This example demonstrates how buy stops can create misleading upward movements and how significant sell iceberg activity, combined with ATR confirmation, can help identify bearish trading opportunities.
Trade Process:
Buy Stops Triggered → Sell Iceberg Appears → Bearish ATR Confirmation → Short Entry at 115% ATR → Stop Above Event Zone → Approximately 200-Point Decline
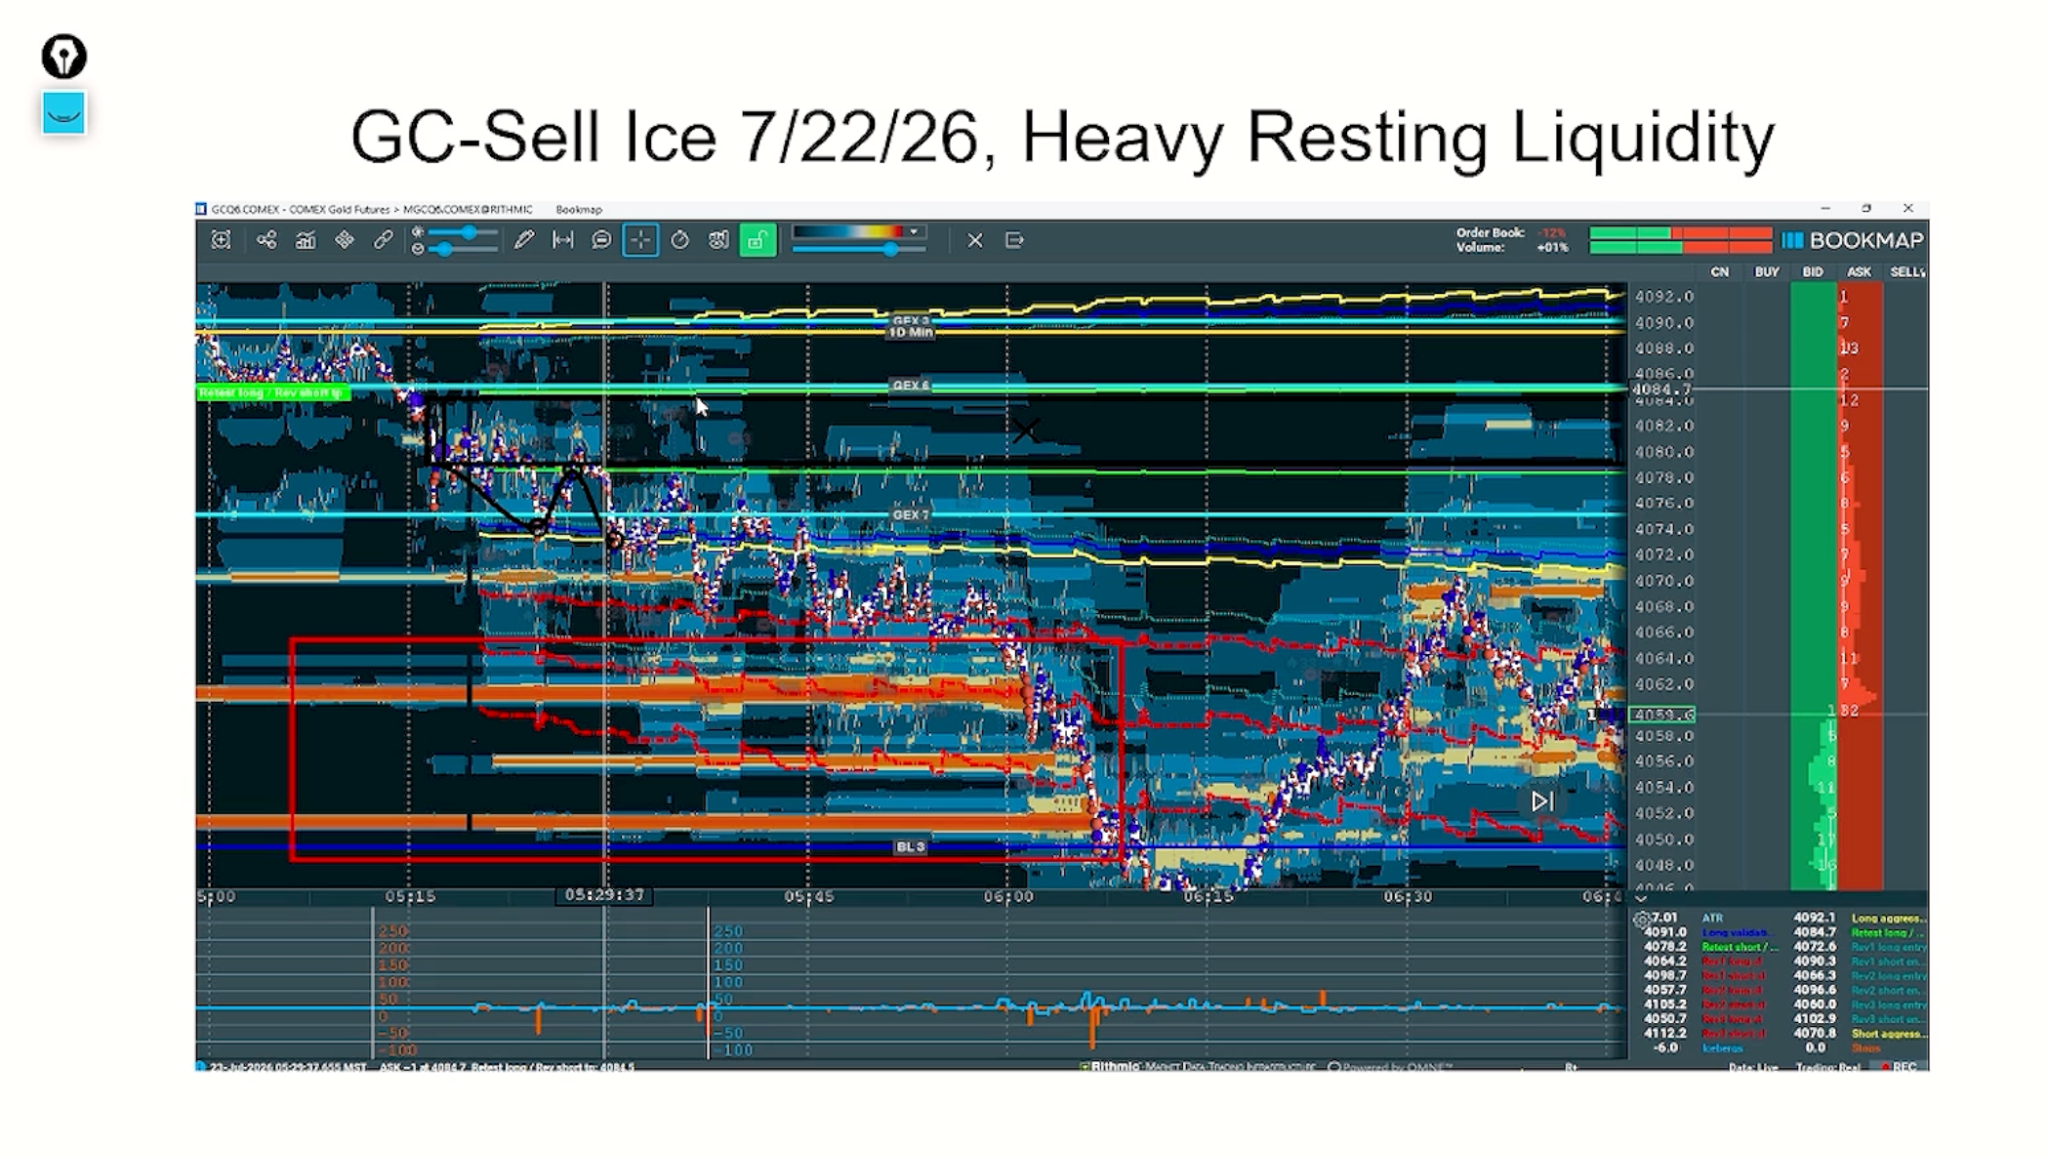
Trade Example 2: Gold Short Using Sell Iceberg and Gamma Levels
Trade Setup
Gold was trading near important gamma levels, where options-related hedging activity could influence price.
A significant sell iceberg appeared around these levels, showing that a large seller was active. The iceberg exceeded the minimum requirement of 150 contracts for Gold.
At the same time, large resting buy orders were visible below the market on the Bookmap heatmap. These orders represented areas of liquidity that could attract price.
Trade Confirmation
The sell iceberg provided confirmation that significant selling activity was occurring near the gamma levels. The resting liquidity below the market provided an additional reason to watch for a potential downward movement.
Rather than relying only on the gamma levels, the setup combined three important factors:
- Significant sell iceberg activity.
- Important gamma levels.
- Large resting liquidity below the market.
Trade Outcome
The example illustrated a potential bearish setup, with resting liquidity below the market acting as a possible downside objective.
The important point was that large resting buy orders do not necessarily mean price will reverse higher before reaching them. Instead, these orders can attract price as large participants seek to execute their trades.
Trade Process:
Important Gamma Levels → Significant Sell Iceberg → Resting Liquidity Below → Potential Bearish Movement Toward Liquidity