

Built For
Instruments: Stocks
Trading Style: Swing Trading
Strategy Overview
The Multiple Edge Trading System is built around a simple principle: never rely on a single reason to enter a trade.
A moving average, trendline, support level, breakout, or chart pattern can all work, but none of them is reliable enough to be used alone. Instead, the strategy looks for several independent edges coming together around the same area.
The basic setup starts with a strong momentum move. Once price breaks through an important level, the strategy does not chase the breakout. It waits for price to pull back toward the breakout area.
A previous resistance level may now become support. If that same area also lines up with a moving average, trendline, or another structural level, it becomes a Multiple Edge Trading Area.
A typical setup may look like:
Momentum Move → Breakout → Pullback → Multiple Edges Align → Entry
However, technical confluence is only the starting point.
The complete strategy also considers why the stock is moving, where institutional money appears to be flowing, whether the stock and its sector are showing strength, and whether the technical structure confirms the underlying thesis.
JLaw organizes these deeper factors into three main layers:
Cognitive Edge → Intuitive Edge → Technical Edge
These layers work together rather than as three rigid steps that must always happen in the same order.
The Core Multiple Edge Setup
The foundation of the strategy is a breakout followed by a pullback.
A stock first develops a base or another important resistance area. A strong momentum move then pushes price through that resistance.
Instead of buying immediately after the breakout, the strategy waits.
When price eventually pulls back, the previous resistance can become support. This becomes more interesting when another form of support is located around the same price.
For example, the pullback could reach:
- Previous resistance turned support
- The 10- or 20-period moving average
- A trendline or another important market-structure level
Each factor represents a separate edge.
When several of them overlap, traders using different methods may all become interested in approximately the same area. Moving-average traders see support, horizontal-level traders see support, and trendline traders may see support as well.
That concentration of interest is what creates the Multiple Edge Trading Area.
The first pullback following a strong breakout is one of JLaw’s preferred setups.
But the pattern does not always appear perfectly. Strong trends can produce fast breakouts, shallow pullbacks, overshoots, or support that only becomes visible on another timeframe.
For that reason, the strategy is based on context rather than requiring every setup to look identical.
Why One Technical Edge Is Not Enough
A major part of the framework is understanding why JLaw does not simply trade every breakout or chart pattern.
Traditional technical tools such as moving averages, trendlines, Fibonacci retracements, support and resistance, cup-and-handle patterns, and other formations are widely known.
The problem is that finding one of these signals does not automatically create a high-quality trade.
A trader who buys every breakout simply because a recognizable pattern appears can experience a very high failure rate.
JLaw explains that his own win rate is generally around 40%–50%, even after being selective.
This is why the objective is not to find a perfect indicator.
The objective is to stack independent reasons for the trade while maintaining favorable risk-to-reward.
Even multiple technical indicators, however, are still not enough to create the complete system. Technical analysis needs to be connected to the actual force driving the stock.
That is where the three deeper edges come in.
Edge 1 — Cognitive Edge
The cognitive edge is about understanding why the price movement exists in the first place.
A sustainable trend normally needs an underlying fundamental driver.
That driver often begins with a catalyst, such as:
- Earnings beating expectations
- Raised guidance or stronger future forecasts
- A significant new product
- A major business development
- An important change in the company’s future growth outlook
When the catalyst materially changes market expectations, price can move sharply.
JLaw refers to this as the momentum move.
This initial momentum is important because it shows that something meaningful has changed. Instead of searching every chart for a moving-average pullback, he first wants to see evidence of genuine demand.
Only after the momentum move develops does he begin looking for a Multiple Edge Trading Area that can provide a lower-risk entry.
High-Volume Breakout + Low-Volume Pullback
Volume adds another important layer to the cognitive edge.
A strong momentum move should ideally occur with significant buying volume. After that move, the strategy watches what happens during the pullback.
If price retraces while volume contracts significantly, there is an important imbalance:
Strong buying pressure on the move up + Weak selling pressure on the pullback
JLaw describes this as:
High-Volume Breakout → Low-Volume Pullback
This is one of the central components of his trading edge.
The breakout shows that buyers were willing to enter aggressively. The quieter pullback suggests that the market is not experiencing the same level of aggressive selling.
If that low-volume pullback then reaches a Multiple Edge Trading Area, the setup becomes considerably more attractive.
Edge 2 — Intuitive Edge
The intuitive edge is about identifying what the market currently cares about.
Instead of studying one company in isolation, the trader looks for themes, industries, and groups attracting capital.
When an important market theme becomes strong, it often does not move only one stock. Several companies connected to the same theme can begin showing momentum.
The trader therefore asks:
Why is this stock moving?
What theme or industry is behind the move?
Are related stocks moving as well?
Where does institutional capital appear to be flowing?
Once one stock begins moving, understanding the reason behind that move can lead to other opportunities in the same group.
This is what JLaw describes as being able to connect the dots and extrapolate.
If one company benefits from a particular development, the trader investigates which other companies or industries could logically benefit from the same development.
The charts then need to confirm that idea.
If several related stocks begin showing strength simultaneously, it provides stronger evidence that there is a genuine underlying force driving the group.
The intuitive edge therefore combines theme recognition, sector strength, group movement, and understanding where capital is flowing.
Edge 3 — Technical Edge
The technical edge goes beyond simply knowing how to draw a trendline or identify a moving average.
The objective is to understand what the price action is actually communicating.
Two concepts are particularly important:
Relative Strength
JLaw wants to find stocks that are outperforming the broader market.
A strong stock may behave like this:
Market rises → Stock rises faster
Market moves sideways → Stock continues higher
Market falls → Stock declines less, holds steady, or continues rising
That behavior suggests that demand for the stock remains unusually strong.
Relative strength becomes especially useful during corrections.
If the broader market breaks below important moving averages while the stock continues holding its own support, the stock may actually be demonstrating strength rather than weakness.
Market Structure
The second major technical constant is market structure.
In a healthy uptrend, price should continue producing higher highs and maintaining constructive structure.
Technical levels are then used to locate favorable entries within that trend.
These may include previous swing highs, moving averages, horizontal levels, trendlines, or other structural areas.
The important distinction is that the technical signal is confirming an existing thesis, rather than creating the entire thesis by itself.
Bringing the Three Edges Together
The three edges should not be treated as an inflexible checklist that must always appear in a particular order.
They constantly influence one another.
Sometimes the process starts with a catalyst.
Other times, a trader may first notice unusual technical strength and then investigate what fundamental development is causing it.
In another situation, strength across an entire industry may lead the trader toward a particular stock.
The important part is putting everything into context.
A strong setup could therefore combine:
Catalyst + Momentum + Relative Strength + Strong Sector + High-Volume Breakout + Low-Volume Pullback + Technical Support
But every trade does not require every possible edge.
How Many Edges Are Required?
There is no fixed number of edges required before entering.
This is an important part of JLaw’s framework.
The more conditions a trader requires, the fewer trades they will find. If five different edges must align perfectly, opportunities will naturally become rare.
If only two or three are required, trading frequency increases, but the trader also gives up some confirmation.
The strength of each individual edge therefore matters.
For example, an unusually powerful momentum move caused by a major catalyst may already represent an extremely strong edge. In that situation, two strong supporting factors may be sufficient.
The goal is not to count indicators. It is to understand the quality of the entire setup.
Contextual Thinking
Contextual thinking is one of the most important extensions of the cognitive edge.
Price should never be judged in isolation.
A stock may temporarily move below its 20-day moving average, but that does not automatically mean the setup has failed.
The trader needs to understand what the rest of the market is doing.
If the overall market is experiencing a sharp correction while the stock is falling much less, the stock may actually be demonstrating relative strength.
The strategy therefore compares:
Individual Stock → Industry Group → Broader Market
Volume should also be considered.
If price briefly breaks support during a market correction but does so on very light selling volume, the move may be an overshoot rather than a true breakdown.
This is why JLaw does not treat technical levels mechanically.
The question is always: Has the original reason for the trade actually changed?
Moving Averages and Support Are Zones
Moving averages and horizontal levels should not be treated as exact lines.
Price does not need to touch a moving average perfectly and immediately bounce.
Instead, the area surrounding the moving average should be treated as a support zone with a reasonable buffer.
JLaw specifically discusses using both the 20 EMA and the 20 MA, which can naturally create a range rather than one exact support price.
A temporary move slightly below that area does not automatically invalidate the setup.
A deep breakdown through the entire support zone, however, can indicate that the original setup has failed.
The same principle applies to horizontal support and resistance.
Volume and Stock Selection
JLaw wants genuine market participation behind the stocks he trades.
A single high-volume day can sometimes be difficult to interpret.
Several consecutive days of strong volume are more meaningful because large institutions generally cannot establish substantial positions all at once.
Continuous volume across two or three days can indicate sustained accumulation.
JLaw also prefers looking at dollar volume rather than simply counting the number of shares traded.
He discusses roughly $100 million or more in daily dollar volume as a useful reference.
A powerful catalyst can push smaller companies toward $500 million or more in daily dollar volume, while exceptionally active stocks can reach approximately $1 billion or more.
At those levels, participation from larger institutions and market participants becomes much more significant.
The exact number is not the strategy by itself.
The purpose is to confirm that the momentum move has genuine participation behind it.
Multi-Timeframe Analysis
JLaw describes himself primarily as a medium-term trader.
His main analysis is performed on the: Daily Chart + Weekly Chart
He may then use the hourly chart to improve the timing of an entry.
This becomes important because a Multiple Edge Trading Area may not be obvious on the daily chart.
A stock could appear to be trading below support on the daily timeframe while actually sitting directly on an important 20-period moving average or structural level on the weekly chart.
Higher-timeframe structure can influence what happens on the lower timeframe.
The same principle applies to shorter-term trading: Hourly → 5-Minute → 1-Minute
A support level on a higher timeframe can explain a reaction that appears to have no obvious reason when viewed only on the lower timeframe.
The trader should therefore remain flexible and move between relevant timeframes when necessary.
Entry Process
The preferred entry generally occurs after momentum has already been confirmed but after price has pulled back enough to create favorable risk.
The strategy does not want to chase a stock simply because it has produced a large breakout.
Instead:
- Identify the momentum move and understand its catalyst.
- Confirm meaningful volume, relative strength, or group strength.
- Allow price to pull back.
- Identify where multiple technical edges begin overlapping.
- Determine whether the original catalyst and broader thesis remain intact.
- Enter around the Multiple Edge Trading Area with a clearly defined invalidation level.
This provides a much more controlled entry than buying directly into an extended momentum move.
Stop-Loss Placement
Stops can be based on either technical structure or a mathematical percentage.
Technical Stop
A technical stop is placed beyond the level where the original setup would no longer make sense.
For example, imagine an entry where the 20-day moving average, previous resistance turned support, and trendline all overlap.
A stop can be placed below that entire area.
If price breaks deeply below all three supports, the reason for entering has been invalidated.
Mathematical Stop
A percentage-based stop can also be used when appropriate.
JLaw commonly discusses approximately 3%–5% stops, while especially precise setups may allow approximately 2% or slightly more.
After very large momentum gaps, a trader may use a fixed 5% stop or a tighter technical stop beneath the low created after the gap.
The tighter approach may result in more stop-outs, but it can also create a significantly larger potential reward relative to the risk.
Position Sizing and Account Risk
Position size is calculated from the amount of account equity the trader is willing to risk.
JLaw gives an example using a:
$100,000 account with a maximum loss of: 0.35% per trade
That equals $350 of account risk.
If the entry is $100 and the stop is $95, the trade risks $5 per share.
The position would therefore be: $350 ÷ $5 = 70 shares
If the stop needs to be wider, the position becomes smaller.
If the setup allows a tighter stop, the position can become larger while keeping total account risk unchanged.
The important principle is that position size adjusts to the stop and account risk, rather than allowing a larger position to create excessive account risk.
Risk-to-Reward Philosophy
The system does not depend on winning most trades.
JLaw states that his win rate is generally around 40%–50%.
The edge comes from keeping losses controlled while allowing successful momentum trades to produce much larger returns.
A setup might risk approximately: 3%–5% while attempting to capture: 25%+
The ideal target is around 5R when the opportunity allows it.
Not every successful trade will reach 5R. Some may produce approximately 3R, while particularly strong trends can produce considerably more.
This asymmetric relationship between losses and winners allows the strategy to work without requiring an extremely high win rate.
Trade Management and Exit Strategy
JLaw does not use one universal exit rule.
The correct exit depends on the type of company, the sustainability of the catalyst, the strength of the trend, and the trader’s conviction.
He explains three primary approaches.
1. Sell Into Strength
When price becomes extended, part of the position can be sold while the stock is strong.
This allows the trader to realize some profit while maintaining exposure if the trend continues.
The stronger the conviction in the company and its future growth, the less aggressively the position may need to be reduced.
2. Sell Into Weakness
For stocks primarily driven by short-term momentum, a more mechanical exit may be appropriate.
The 10- or 20-day moving average can act as a guide.
If price meaningfully loses the relevant moving-average area, the position can be reduced or closed.
Again, the moving average should be treated as a zone rather than an exact line.
3. Hold While the Long-Term Trend Remains Healthy
High-quality growth companies can require a different approach.
If the business has strong fundamentals and the trader has high conviction in its long-term growth, exiting at the first small technical weakness could mean missing a much larger trend.
As long as price continues behaving normally around the 10- and 20-period moving averages and the underlying thesis remains intact, the position can be held for a larger move.
Warning signs or abnormal price behavior can then be used to determine when exposure should be reduced.
Zero-Cost Risk Reduction
For certain high-conviction long-term growth companies, JLaw introduces a zero-cost strategy.
Once the position has appreciated substantially, the trader can sell enough shares that the realized profit equals the value of the remaining position.
In his example, after approximately a 70% gain, selling roughly 58.8% of the position would leave approximately 41.2% remaining with the initial capital effectively recovered.
This reduces the psychological pressure associated with holding the remaining shares and can make it easier to stay with a long-term trend.
However, this approach is not appropriate for every company.
JLaw looks for businesses with characteristics such as:
- A strong technological or competitive moat
- A critical position within their industry
- Long-term structural growth potential
- Participation in a growing rather than declining industry
- Strong management, vision, integrity, and execution
Stocks driven mainly by short-term hype or companies without durable business models should generally be managed more aggressively rather than treated this way.
Long and Short Setups
The Multiple Edge Trading System can be applied to both long and short trades.
The short setup is essentially the mirror image of the long setup.
For a long trade:
Strong Momentum Up → Breakout → Pullback → Support → Entry
For a short trade:
Strong Momentum Down → Breakdown → Bounce → Resistance → Short Entry
A major negative catalyst may cause a stock to gap sharply lower.
When price eventually bounces, previous support can become resistance.
If that resistance also aligns with a moving average or another technical level, it can create a Multiple Edge Trading Area for a short.
However, JLaw emphasizes that short selling is significantly more demanding.
Downside moves can happen extremely quickly, reaction time becomes more important, and unexpected news can cause a stock to gap sharply higher.
This is particularly dangerous in highly news-sensitive areas such as pharmaceutical stocks.
For that reason, the same framework applies to shorts, but short-side execution requires more experience and tighter risk control.
Complete Strategy Process
The Multiple Edge Trading System is not simply:
Find support + Buy the pullback.
The complete process is:
Understand the Catalyst → Identify the Momentum Move → Confirm Volume → Evaluate the Theme and Sector → Measure Relative Strength → Read Market Structure → Wait for the Pullback → Find Multiple Technical Edges → Check the Broader Context → Define Invalidation → Size the Position → Enter → Manage According to the Type of Stock
The most important principle is that every trade should have a genuine reason behind it.
Technical analysis determines where the opportunity may exist.
The catalyst and market theme help explain why the move exists.
Relative strength, volume, and market structure help confirm whether the market agrees.
Risk management determines whether the opportunity is worth taking.
That combination is what turns a basic technical pullback into JLaw’s Multiple Edge Trading System.
Trade Breakdown
Trade Example — Google
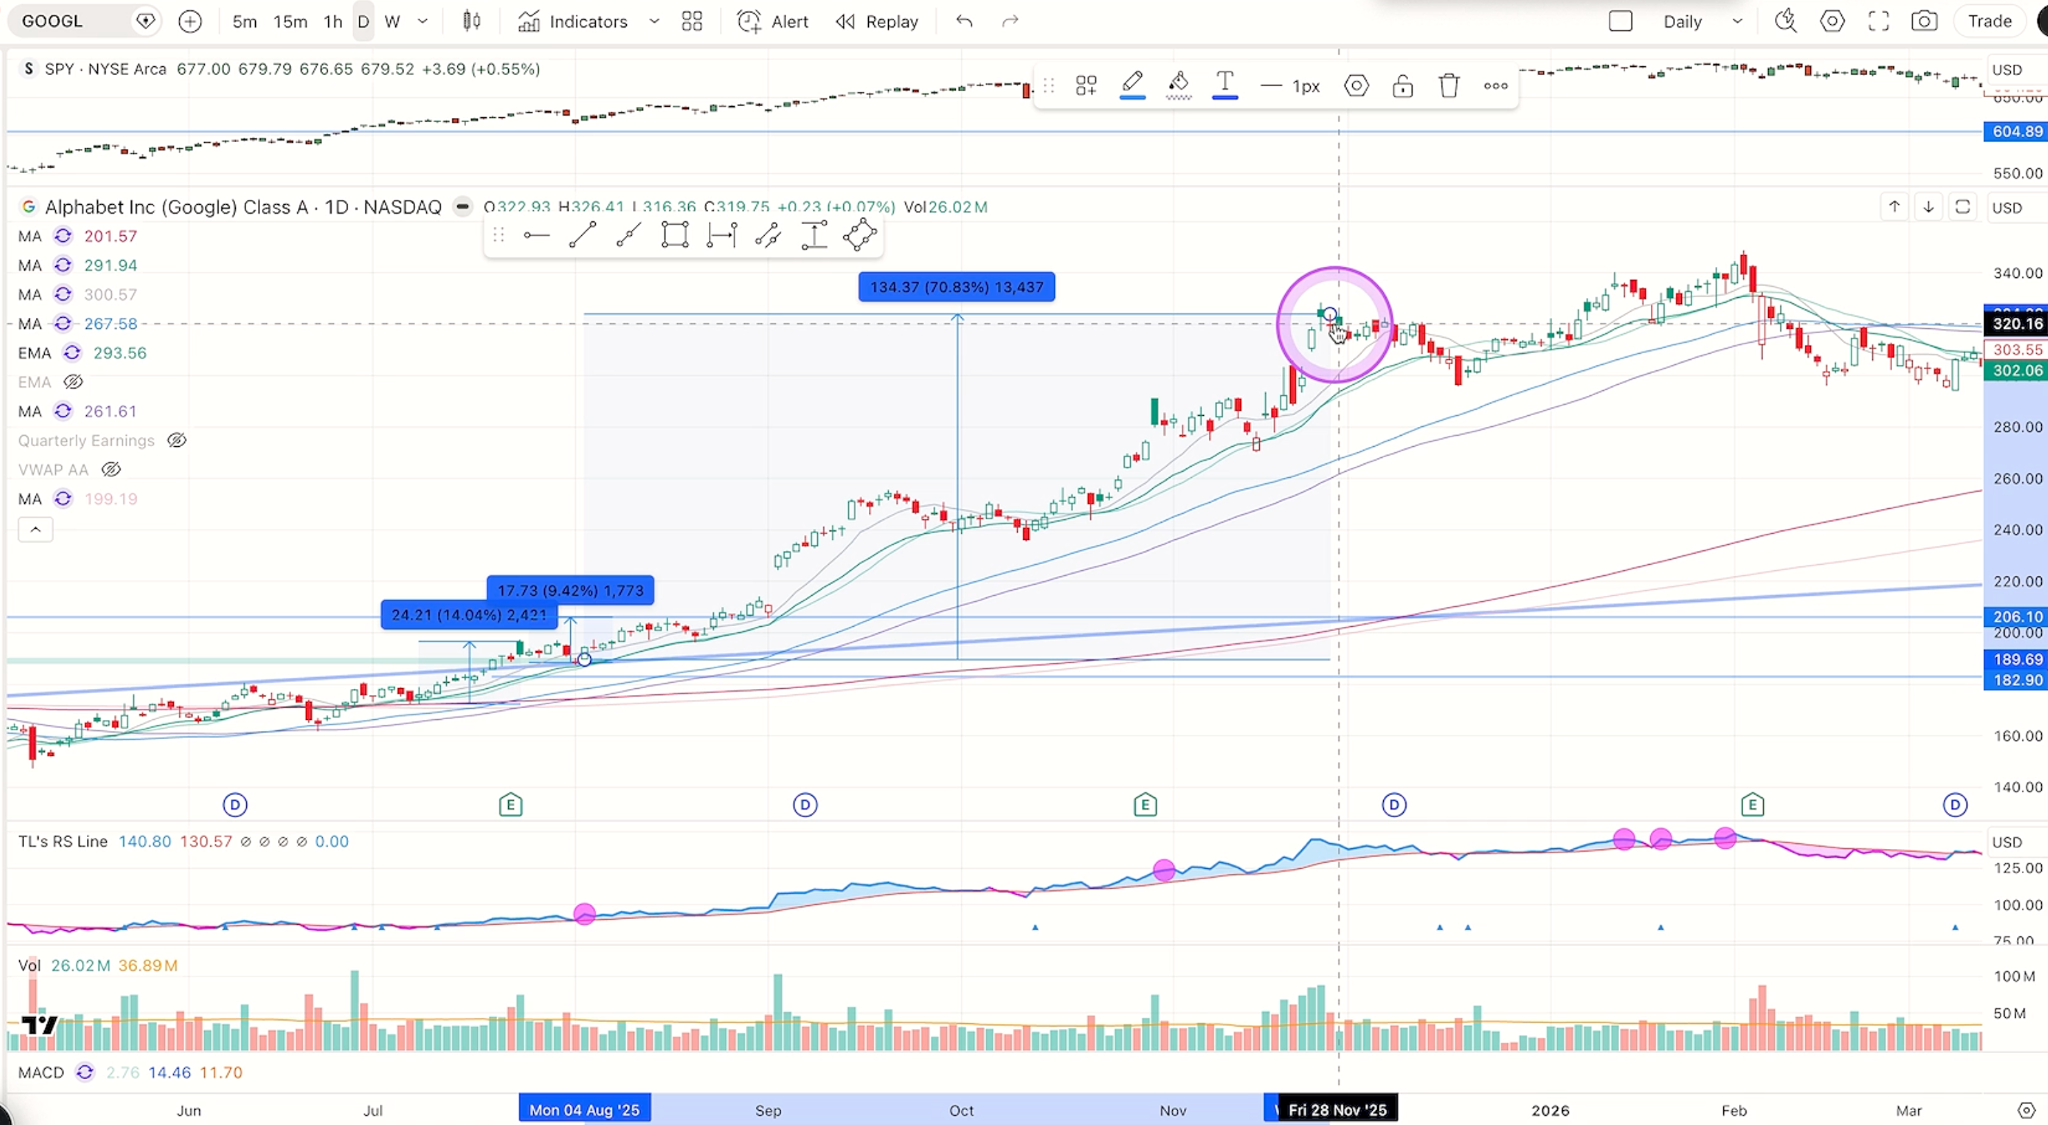
This Google trade shows how several different edges can come together around the same price area to create a higher-quality entry.
Before the setup formed, Google had been lagging behind the broader market. One of the main concerns was that AI could threaten Google’s search business and, in turn, its advertising revenue.
That started to change after the company’s earnings report. The results showed that Google’s search advertising business was still growing despite those concerns. The earnings release acted as an important catalyst and helped create a clear momentum shift in the stock.
Following earnings, Google gapped higher and continued climbing for several days. Instead of chasing that move, the strategy waited for a pullback.
The Pullback
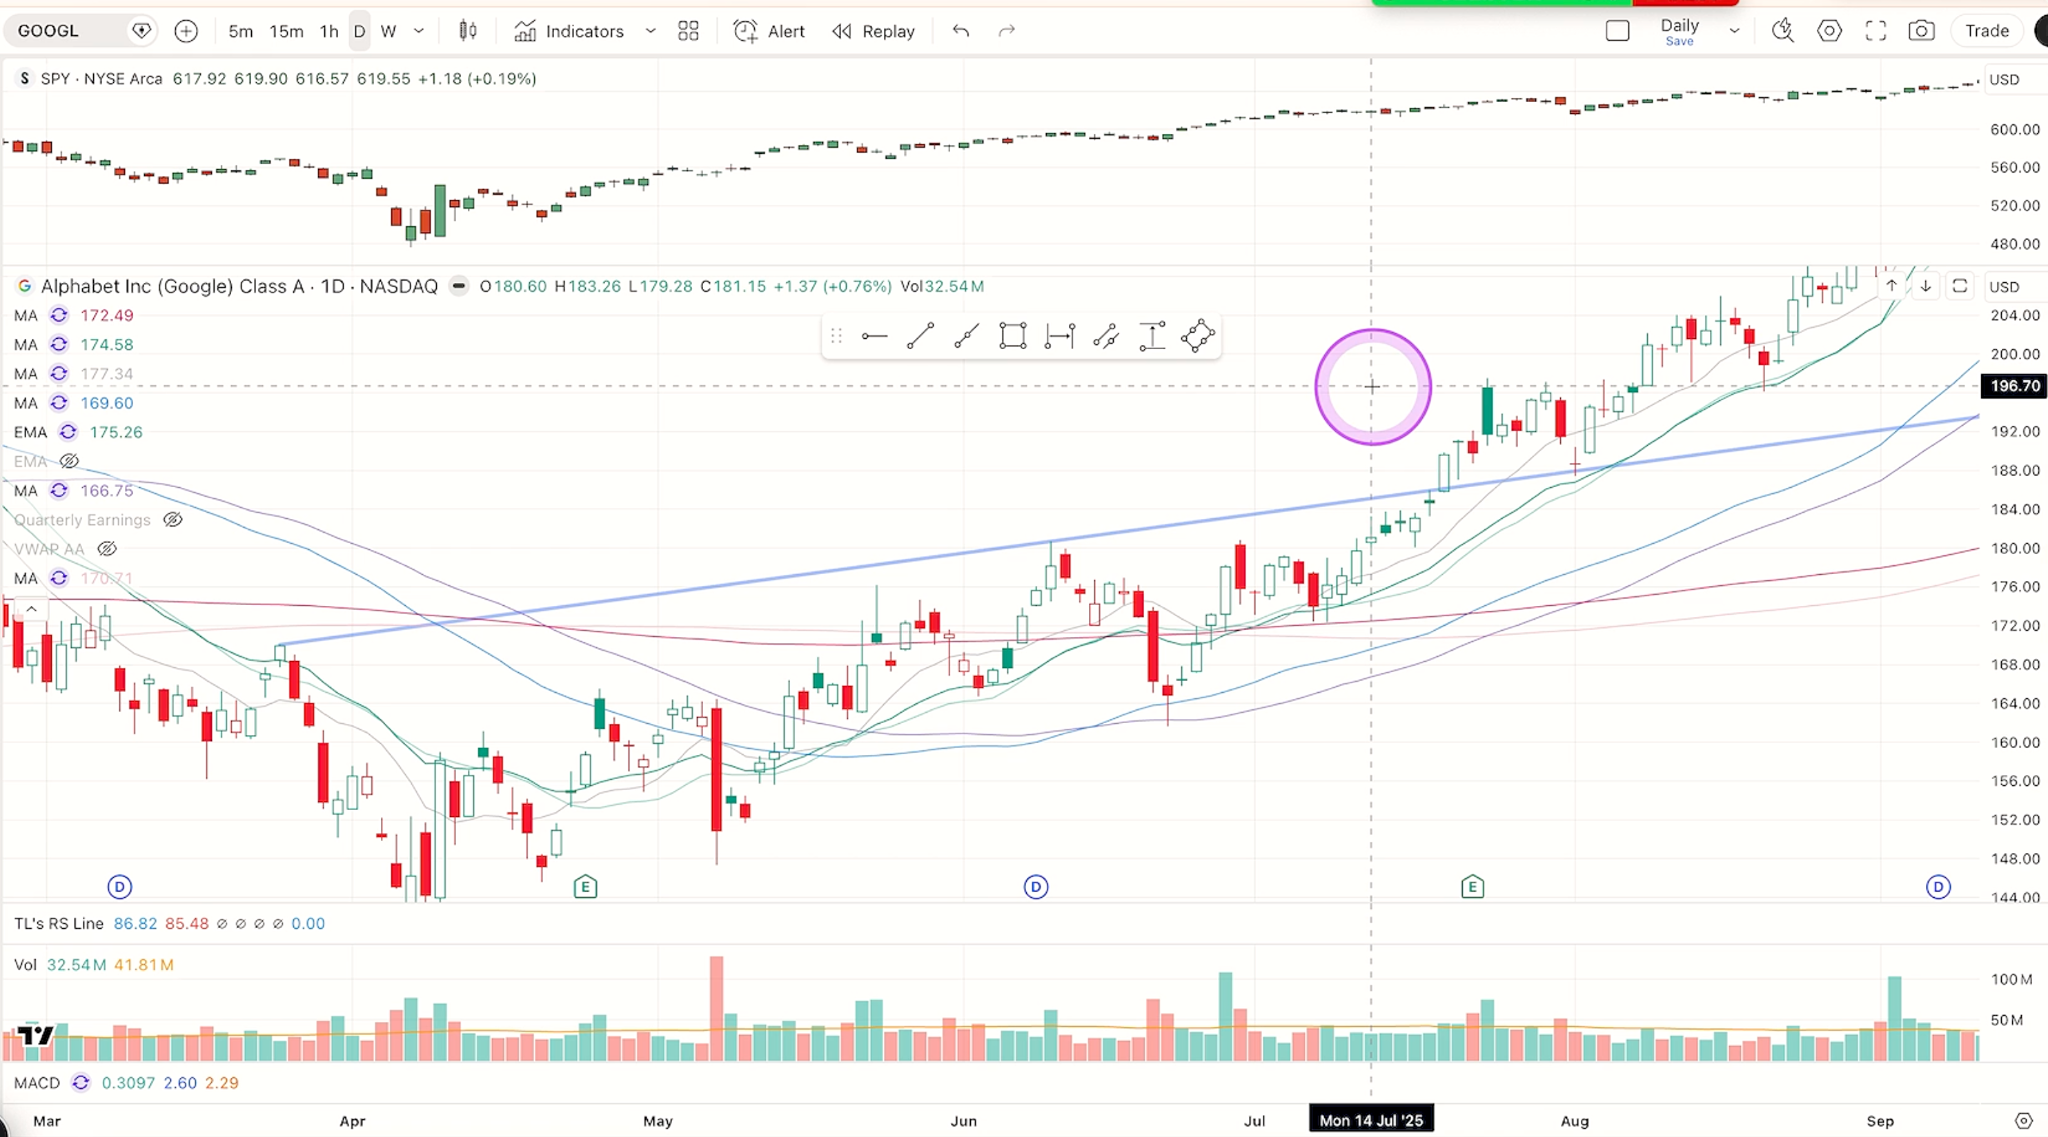
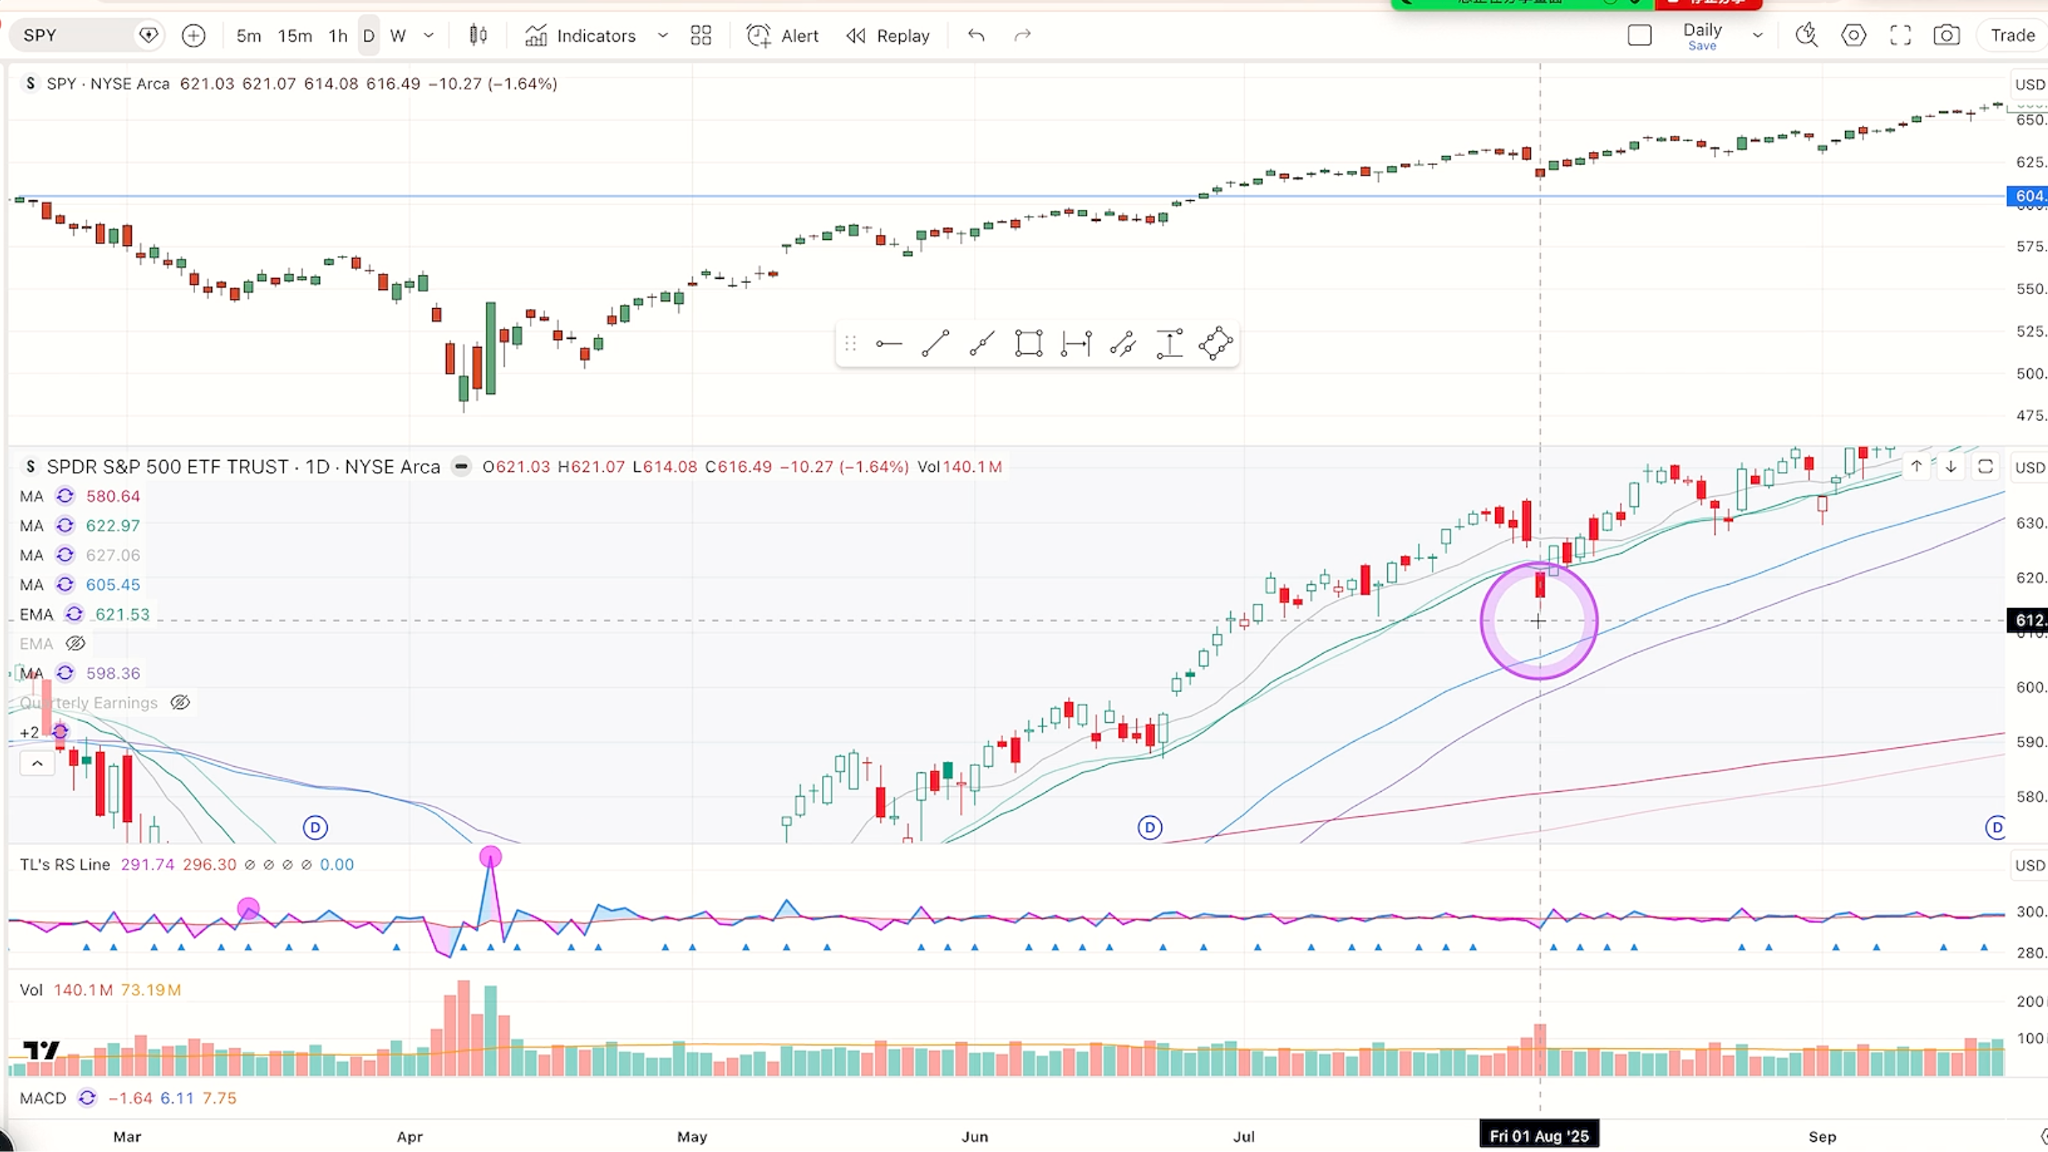
When Google eventually pulled back, the broader market was also declining.
On August 1, the S&P 500 fell approximately 1.64%, while Google declined around 1.44%. Google was therefore holding up relatively well compared with the broader market.
The technical structure also remained strong. While the broader market broke below its 20-day moving average, Google pulled back toward its own 20-day moving average and continued holding around that support area.
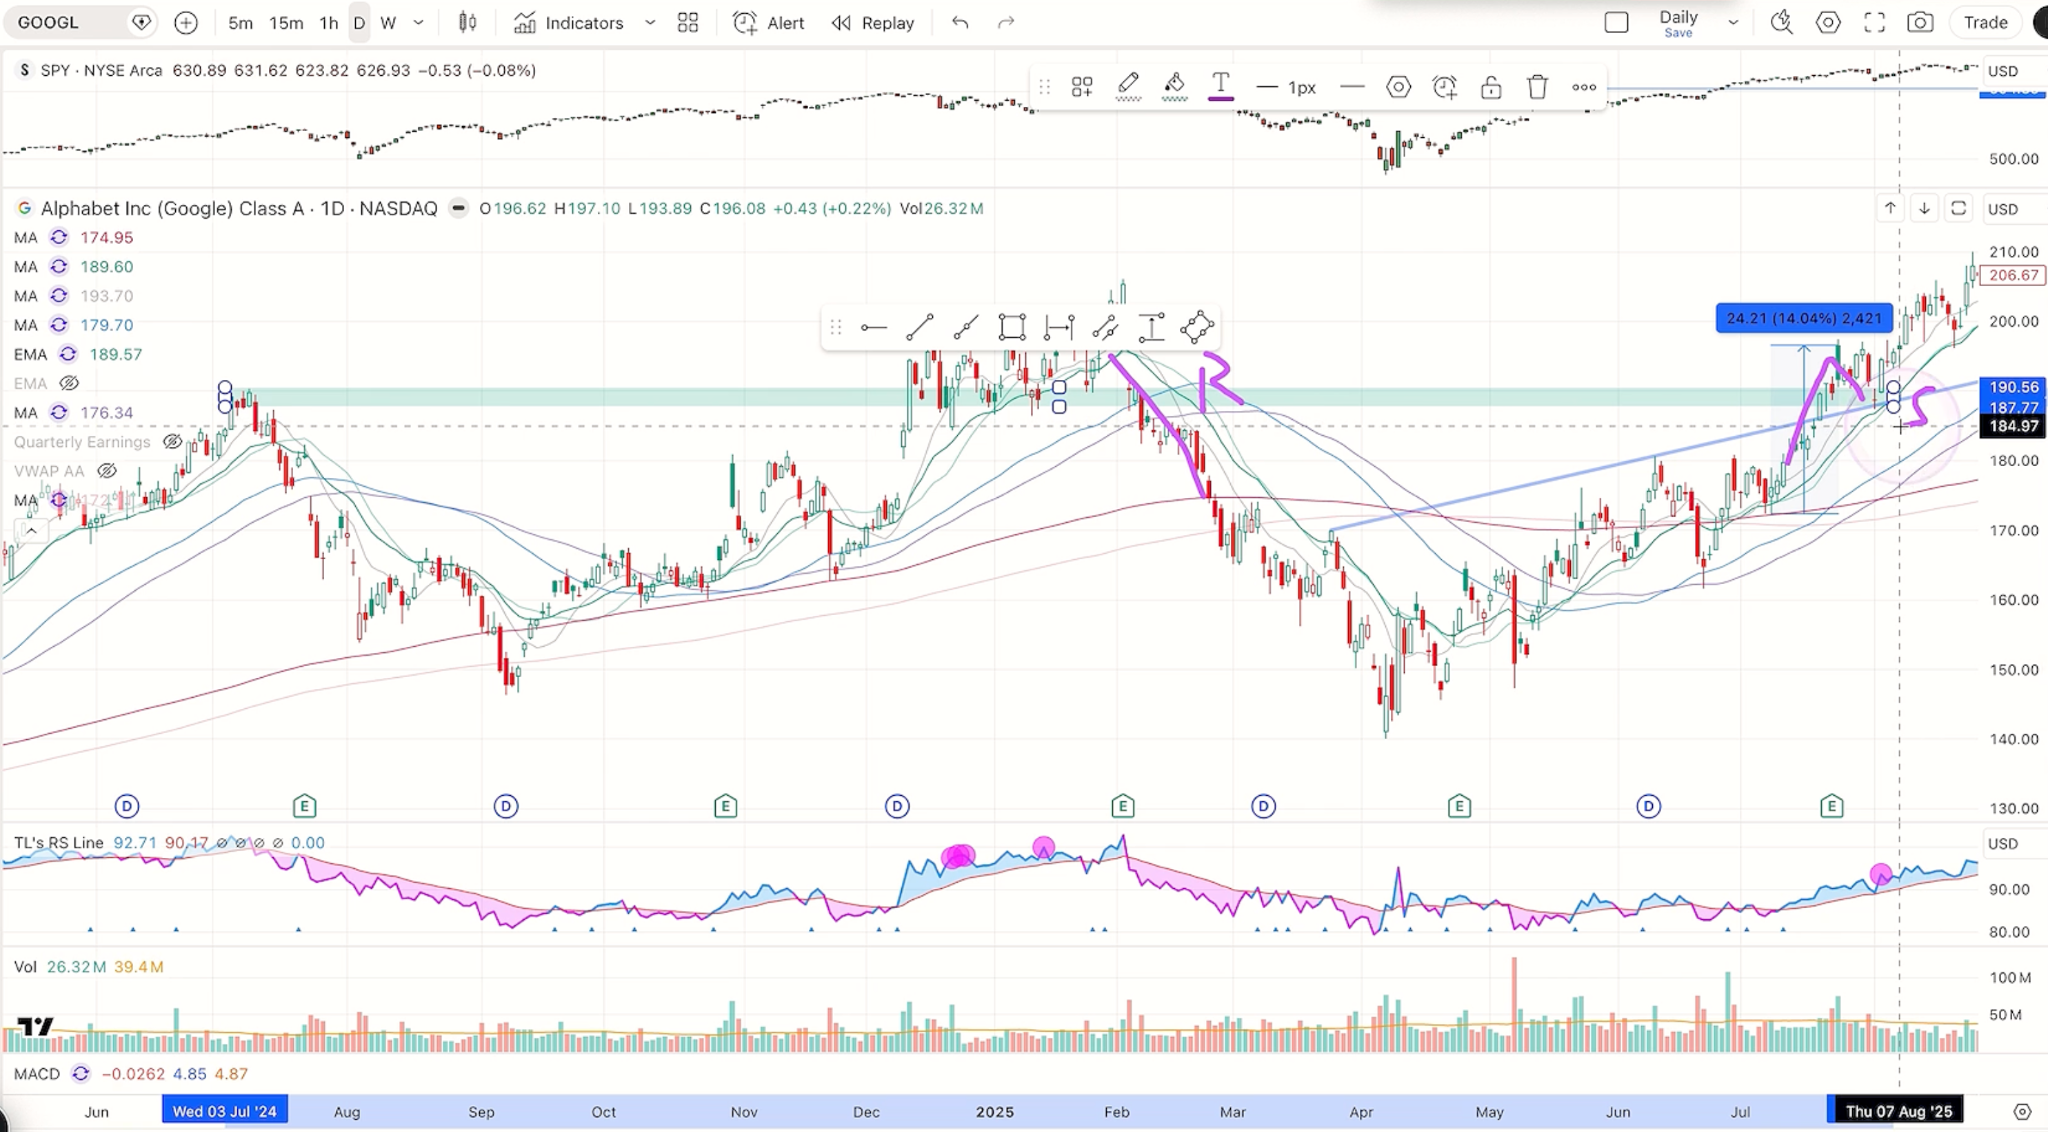
At the same time, the pullback brought price into an area where several additional edges were coming together.
The setup now had:
- Fundamental Edge: Earnings helped reduce concerns surrounding Google’s search and advertising business.
- Relative Strength: Google held up better than the broader market during the correction.
- Trendline Support: A previous resistance trendline had flipped into support.
- 20-Day MA Support: The pullback reached the moving-average support area.
- Volume Edge: Earlier buying occurred on stronger volume, while volume became much lighter during the pullback.
- Horizontal Support: A previous resistance level had broken and was now acting as support.
With all of these factors lining up around the same area, the pullback became a Multiple Edge Trading Area.
Entry and Stop Loss
The entry could be taken around this support zone rather than waiting for price to become extended again.
The stop was placed below the area where the setup would clearly become invalid.
This was important because a deeper move below the level would mean Google was no longer simply losing one support. It would be breaking below the 20-day moving average, trendline support, and the key structural support area that formed the basis of the trade.
Depending on how much room was given to the setup, JLaw explained that the stop could be approximately 1.6% to slightly above 2%.
A tighter stop allowed a larger position while maintaining the same account risk, while giving the trade more room required a smaller position.
Profit Potential
For a shorter-term target, the previous swing high could be used as the first logical objective.
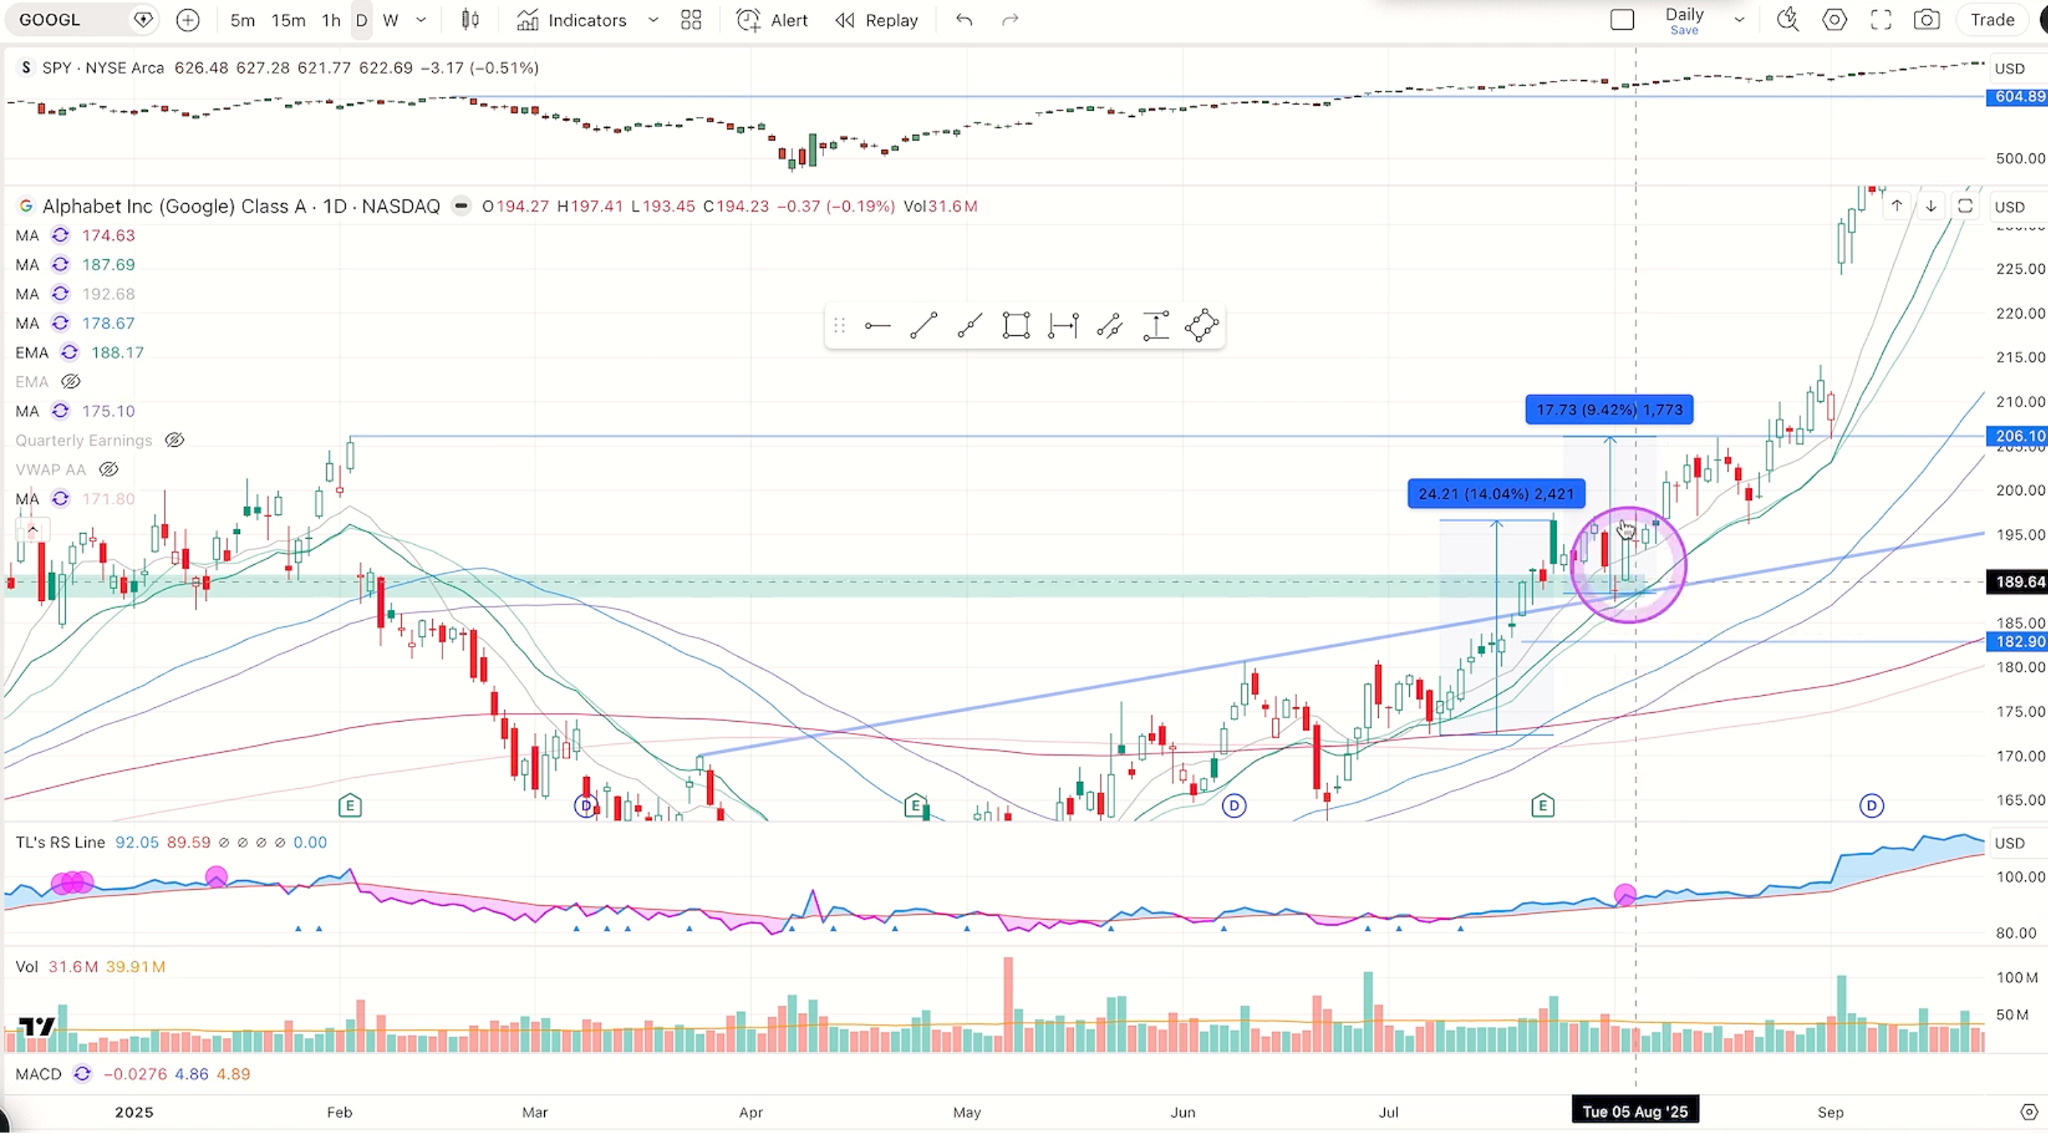
From the entry area, that represented approximately 9%–9.4% potential upside.
With only around 2% risk, the setup offered approximately a 4R–5R risk-to-reward opportunity even if the trade only returned to its previous high.
If the larger momentum trend continued, the potential reward could become significantly greater.
That is exactly what the Multiple Edge Trading System is designed to find: a stock with a genuine reason to move, strong relative strength, and several forms of support coming together at an entry where the downside can remain tightly defined.