Swing traders need different journal features than day traders: thesis documentation, multi-day trade notes, and holding period analytics matter more than high-volume import speed. This guide tests 3 platforms against real swing trading workflows and explains which reports actually improve swing trade performance.
class SampleComponent extends React.Component {
  // using the experimental public class field syntax below. We can also attach
  // the contextType to the current class
  static contextType = ColorContext;
  render() {
    return <Button color={this.color} />
  }
}
Last Updated: May 18th, 2026
The best trading journal for swing traders is a platform that prioritizes thesis documentation, multi-day trade lifecycle tracking, and performance analytics broken down by holding period and market condition. Unlike day trading journals that optimize for volume and speed, swing trader journals need to capture why you took the trade, what changed during the hold, and whether the original thesis played out. TradeZella is the best swing trading journal in 2026 because the Notebook feature handles thesis tracking, Zella AI analyzes your swing trading strategies automatically, and the analytics dashboard surfaces holding period performance that reveals whether you are cutting winners too early or holding losers too long.
Most "best trading journal" lists focus on day traders because day trading generates more volume, more data, and more obvious feedback loops. If you are looking for a general comparison across all trading styles, see the full best trading journal software ranking. This guide is specifically for swing traders, and the evaluation criteria are different.
Swing trading sits in an awkward spot for trading journals. Most platforms are built for day traders (high volume, tight feedback loops) or position traders (sparse data, long horizons). Swing traders fall in between, with 4 to 15 trades a week, holding times from 2 days to 3 weeks, and an analytical need that combines short-term execution review with longer-term thesis tracking. The journal features that matter for a swing trader are not the same ones that matter for someone taking 20 trades a session.
After testing every major platform against real swing trading workflows, the top three are TradeZella, Tradervue, and Edgewonk.
Our Commitment to Transparency
We built TradeZella to be the tool we wanted to use, and 100,000+ traders use it today. But we recognize different traders have different needs. Here is our honest assessment of the landscape.
TL;DR
TradeZella is best for swing traders who need thesis tracking, holding period analytics, and AI that tags and reviews automatically, starting at $29/month. Tradervue offers a free tier (30 trades/month) with basic thesis notes and community sharing for simple swing trading workflows. Edgewonk has the deepest psychological tagging and strategy analytics with automated imports from hundreds of brokers at $197/year.
What Does a Swing Trader Need From a Journal?
The most common mistake swing traders make is using a day trader journal. The best trading journal for day traders optimizes for auto-import speed, time-of-day analytics, and daily loss limit tracking. Swing traders do not need those features as their primary tools. The volume is too low to fill the analytics dashboards, and the features that matter (thesis tracking, multi-day notes, holding period analysis) are afterthoughts in day-trader-focused platforms.
A trading journal vs spreadsheet comparison matters even more for swing traders than for day traders. A spreadsheet can handle 8 trades a week in terms of volume. But it cannot prompt you to document your thesis at entry, attach timestamped mid-trade notes, or break down performance by holding period automatically. That is where dedicated journal software earns its value for swing traders.
Here is what actually matters:
Thesis documentation at entry. A swing trade is held for days or weeks. By the time you exit, the original thesis often blurs. A journal that prompts you to document why you took the trade at entry, then references it at exit, is doing 50% of the analytical work for you. This connects directly to your trading plan. If your plan says "enter breakout continuations above the 20-day moving average," the thesis note should document exactly which criteria were met and any concerns you had at entry.
Mid-trade journaling. Swing trades evolve. Earnings happen, news drops, technical levels break. A good journal lets you add timestamped notes during the holding period. Without mid-trade notes, you lose the context that explains why a winning trade almost got stopped out on day 3, or why you moved your stop on a losing trade when the thesis was already broken. This is where emotional trading patterns hide in swing trading. The decision to hold through a pullback looks rational in hindsight if the trade recovers. But the mid-trade note reveals whether you held because your thesis supported it or because you were afraid to take the loss.
Holding period analysis. A swing trader's optimal hold time is highly individual. Some perform best on 3 to 5 day trades and worse on 2-week trades. On a $50,000 account risking $500 per trade, the difference between a 2.1R average on short-duration trades and a 0.8R average on long-duration trades is $650 per trade in expected value. Your journal's holding period report tells you which duration range is actually working. Without it, you are guessing.
Market condition tagging. Swing trades depend heavily on broader market regime. A breakout setup that works in trending markets fails in choppy, range-bound conditions. If you track trading habits by tagging each trade with the market condition at entry (trending, range-bound, high volatility, low volatility), the analytics reveal which setups need a market condition filter. On a $50,000 account, cutting trades that only work in trending markets during range-bound conditions can save $1,000 to $2,000 per month.
Setup performance with adequate sample size. Swing traders accumulate data more slowly than day traders. A day trader might have 100 trades per setup in a month. A swing trader needs 2 to 3 months to reach 30 trades per setup. Your journal needs to show sample sizes alongside performance metrics so you do not make changes based on 12 trades.
Feature
TradeZella
Tradervue
Edgewonk
Thesis Tracking
Notebook attached to each trade
Basic trade notes
Trade notes with psychology tags
Mid-Trade Notes
Timestamped notes during hold
Edit notes anytime
Manual journal entries
Holding Period Analytics
WR, PF, avg R by duration
Basic duration breakdown
Hold time analysis
Setup Comparison
Strategies with side-by-side analytics
No strategy-based tracking
Detailed strategy module
Auto Broker Import
500+ brokers
~20 brokers
CSV upload only
AI Analysis
Zella AI + AI agents
None
None
Backtesting
11+ years data, bar replay
None
None
Psychology Tracking
Custom emotion tags + AI analysis
None
Tilt meter + emotional state
Pricing
$29/mo ($24 annual)
Free / $29.95 / $49.95
$197/year
#1: TradeZella: Best for Tracking, Holding Period Analytics, and AI
Price: $29-49/month
Best for: Swing traders who want thesis tracking, holding period analytics, AI-powered analysis, and deep setup comparison in one platform
Markets: Stocks, Options, Futures, Forex, Crypto
TradeZella ranks first because it handles the three things swing traders need most: thesis documentation, holding period analytics, and setup comparison, all inside one platform with AI that does the analysis work for you.
Thesis Tracking With the Notebook. The Notebook feature is purpose-built for the thesis documentation swing traders need. When you log a trade, the Notebook attaches to that trade and stays with it through entry, hold, and exit. You can write your entry thesis ("AAPL breaking out of 6-week base, above 20-day MA, earnings in 2 weeks, targeting $195"), add timestamped mid-trade notes ("Day 3: pulled back to breakeven, thesis still intact, volume declining"), and document your exit reasoning. At review time, the full story is there. You do not have to remember why you took the trade or what happened during the hold.
Holding Period Analytics. TradeZella's analytics break down win rate, profit factor, and average R-multiple by how long you held the trade. You can see whether your 3-day trades or your 10-day trades are pulling their weight. On a $50,000 account, if your 3 to 5 day trades average 2.1R and your 10+ day trades average 0.6R, that is a $750 per-trade difference in expected value. The holding period report makes the pattern obvious. Without it, most swing traders hold everything the same duration regardless of whether the data supports it.
Strategies for Setup Comparison. TradeZella's Strategies feature lets you define your swing trade setups (Breakout Continuation, Pullback to Moving Average, Range Reversal, Earnings Gap) and track performance per strategy side by side. You see the trading expectancy and risk-reward ratio for each setup, so you know which ones are earning their place in your rotation and which ones are dragging down your overall numbers.
Zella AI: Ask Anything, Automate the Tedious Work. Zella AI is a full AI trading assistant built into TradeZella's dashboard. You can ask it any question about your swing trading data in plain language. "Which of my setups performs best in trending markets?" "What is my average hold time on winning trades versus losing trades?" "Show me my worst month and tell me what went wrong." Zella AI pulls from your actual trade history and gives you a personalized answer.
Zella AI also takes action. You can tell it to tag your last 30 trades by market condition, find trades where you held longer than your optimal duration, or check your recent trades against your Strategies. On top of the conversational AI, TradeZella runs AI agents that work automatically: the Trade Auto-Tagger tags every imported trade based on your criteria, the Market Sentiment Briefing delivers a pre-session market overview customized to your watchlist, and the Session Review generates a structured analysis of your recent trading. For swing traders, the Auto-Tagger alone saves hours of manual work each week.
The Full Platform. All of this sits on top of TradeZella's complete trading dashboard: automated import from 500+ brokers, 50+ analytics reports, backtesting trading strategies with 11+ years of data, Trade Replay and Day Replay, custom tags for market conditions and catalysts, Calendar view for weekly P&L patterns, risk per trade tracking across every position, and Prop Firm Sync for funded accounts. You can analyze trading performance by any combination of strategy, time period, symbol, tag, and market condition.
Pricing: Essential at $29/month ($24/month billed annually), Pro at $49/month ($33/month billed annually). The Essential plan covers most swing traders. Pro adds Trade Replay and additional Strategies slots.
#2: Tradervue: Free Option for Simple Swing Trade Logging
Price: Free-$49.95/month
Markets: Stocks, Futures, Forex, Options
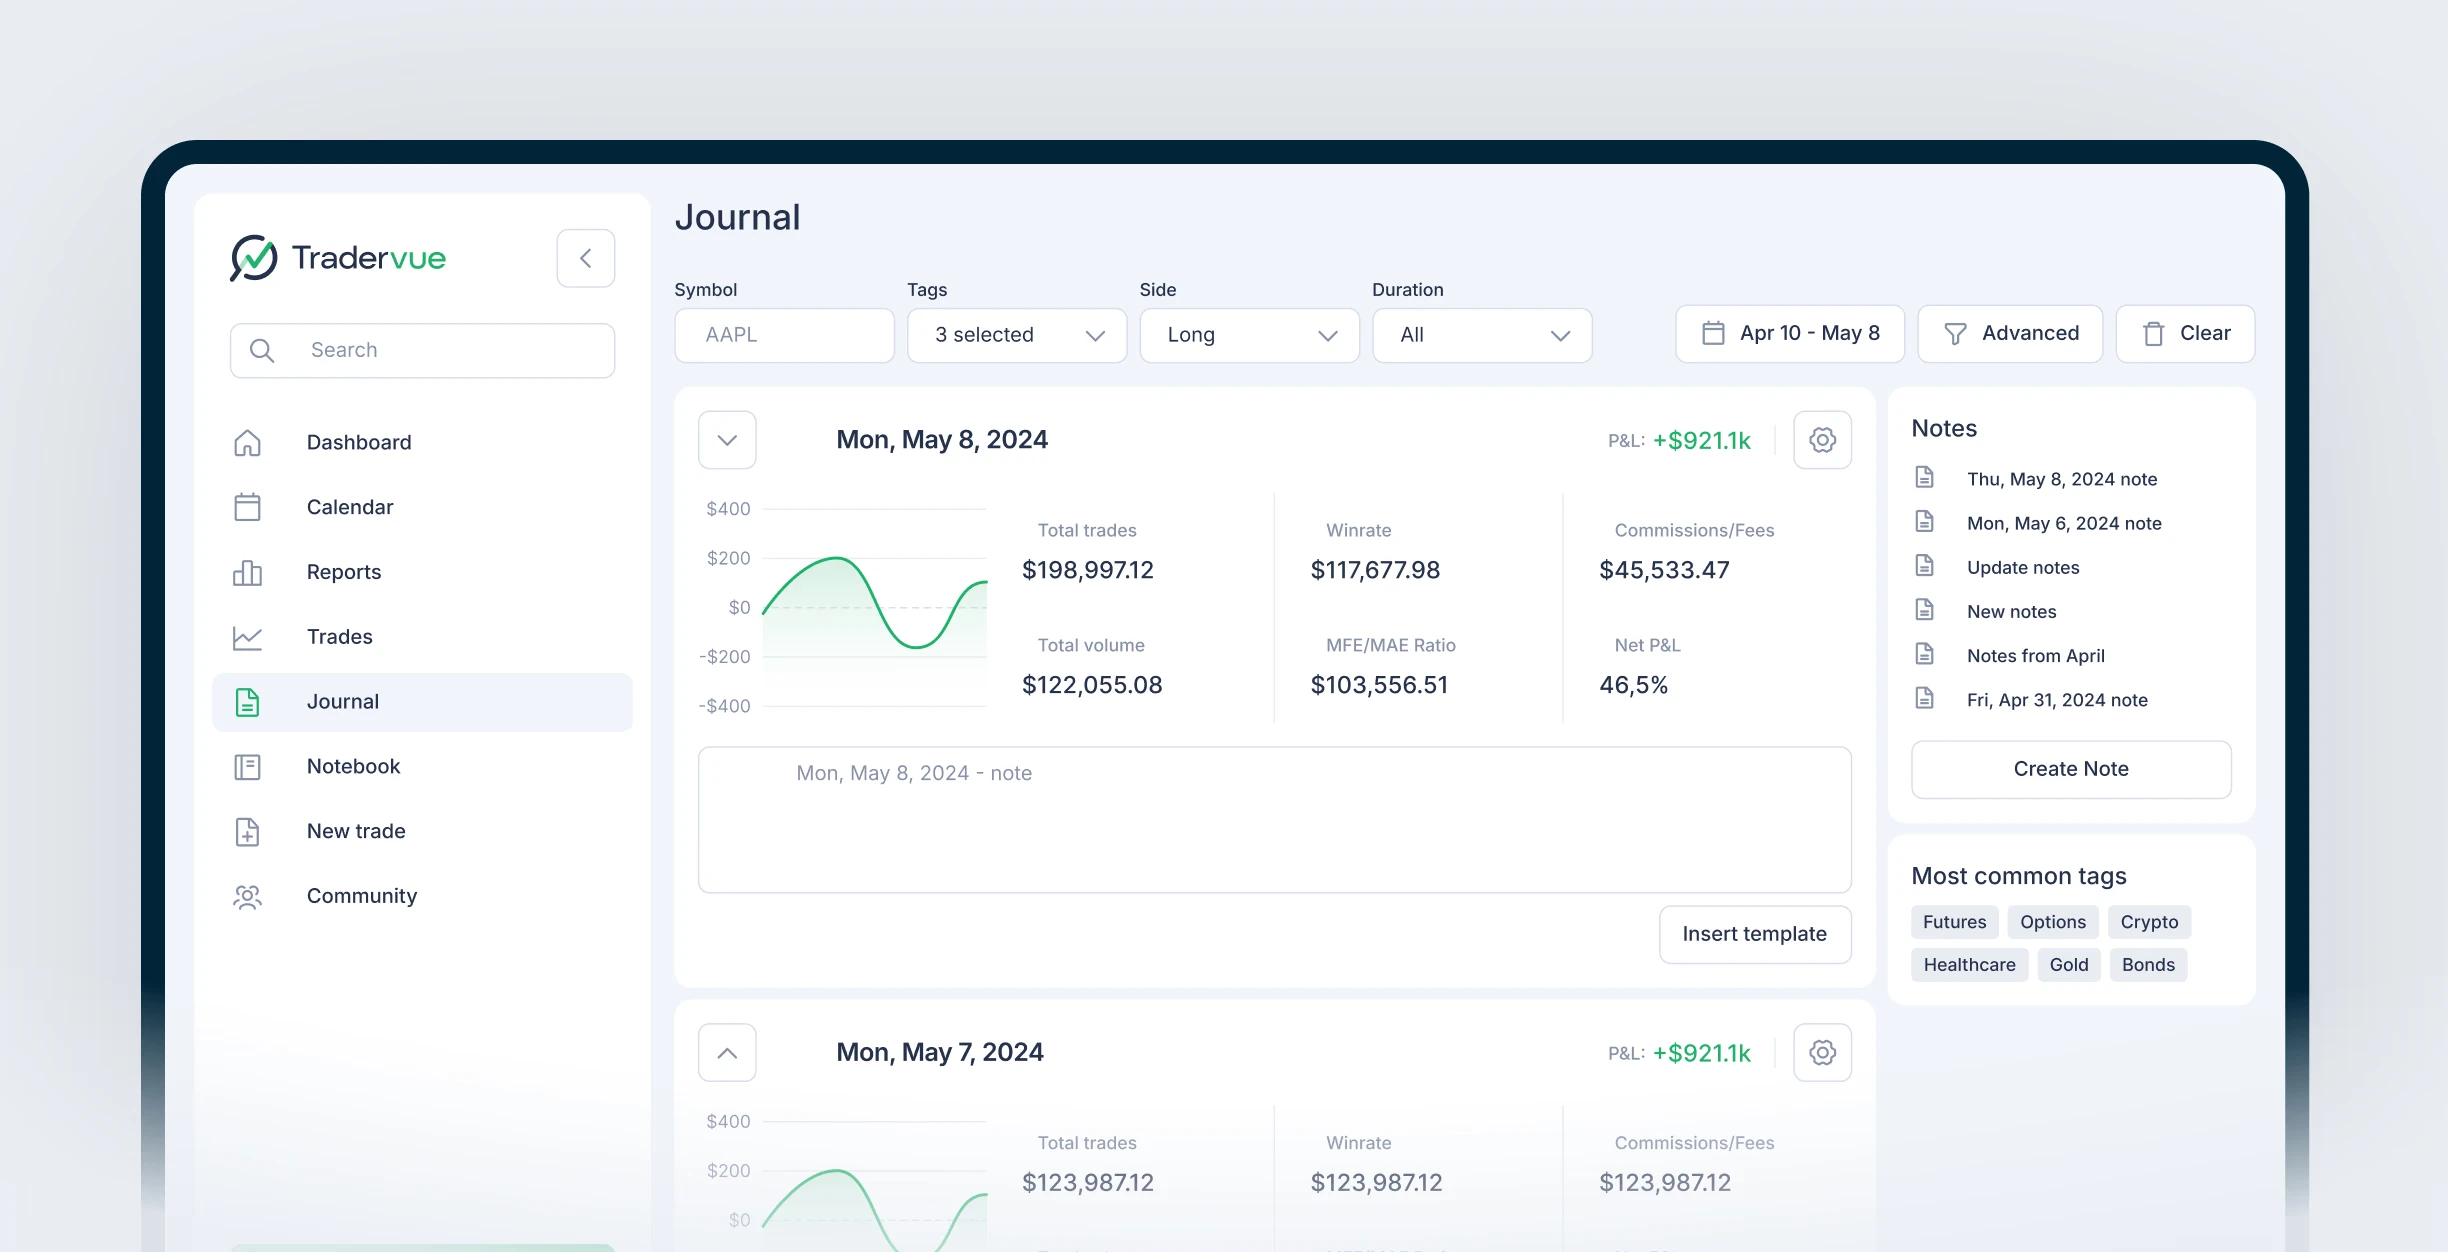
Tradervue is a trading journal with performance analytics. The trade notes feature lets you document your thesis at entry, and the reports include holding period breakdowns and setup performance. The shared trades feature adds a community learning dimension where you can see how other swing traders annotate their trades.
The free tier gives you 30 trades per month, which covers most swing traders running 6 to 8 trades a week. The interface is clean and straightforward to learn. For swing traders who want a simple journal without deep analytics, Tradervue works.
The analytics depth is noticeably shallower than TradeZella. Fewer report types, less granular filtering, and no strategy-based performance tracking. No backtesting feature. No trade replay. No AI analysis or agents. The broker integration list is smaller (primarily US brokers). The interface has not been significantly updated in years. For swing traders who want thesis tracking and basic reports, Tradervue is functional. For anyone who wants to go deeper into setup comparison, holding period optimization, or AI-powered analysis, TradeZella covers more ground.
Pricing: Free (30 trades/month), Silver at $29.95/month, Gold at $49.95/month.
#3: Edgewonk: Best for Deep Psychological Tagging and Strategy Analytics
Price: $197/year
Markets: Stocks, Forex, Futures, Crypto
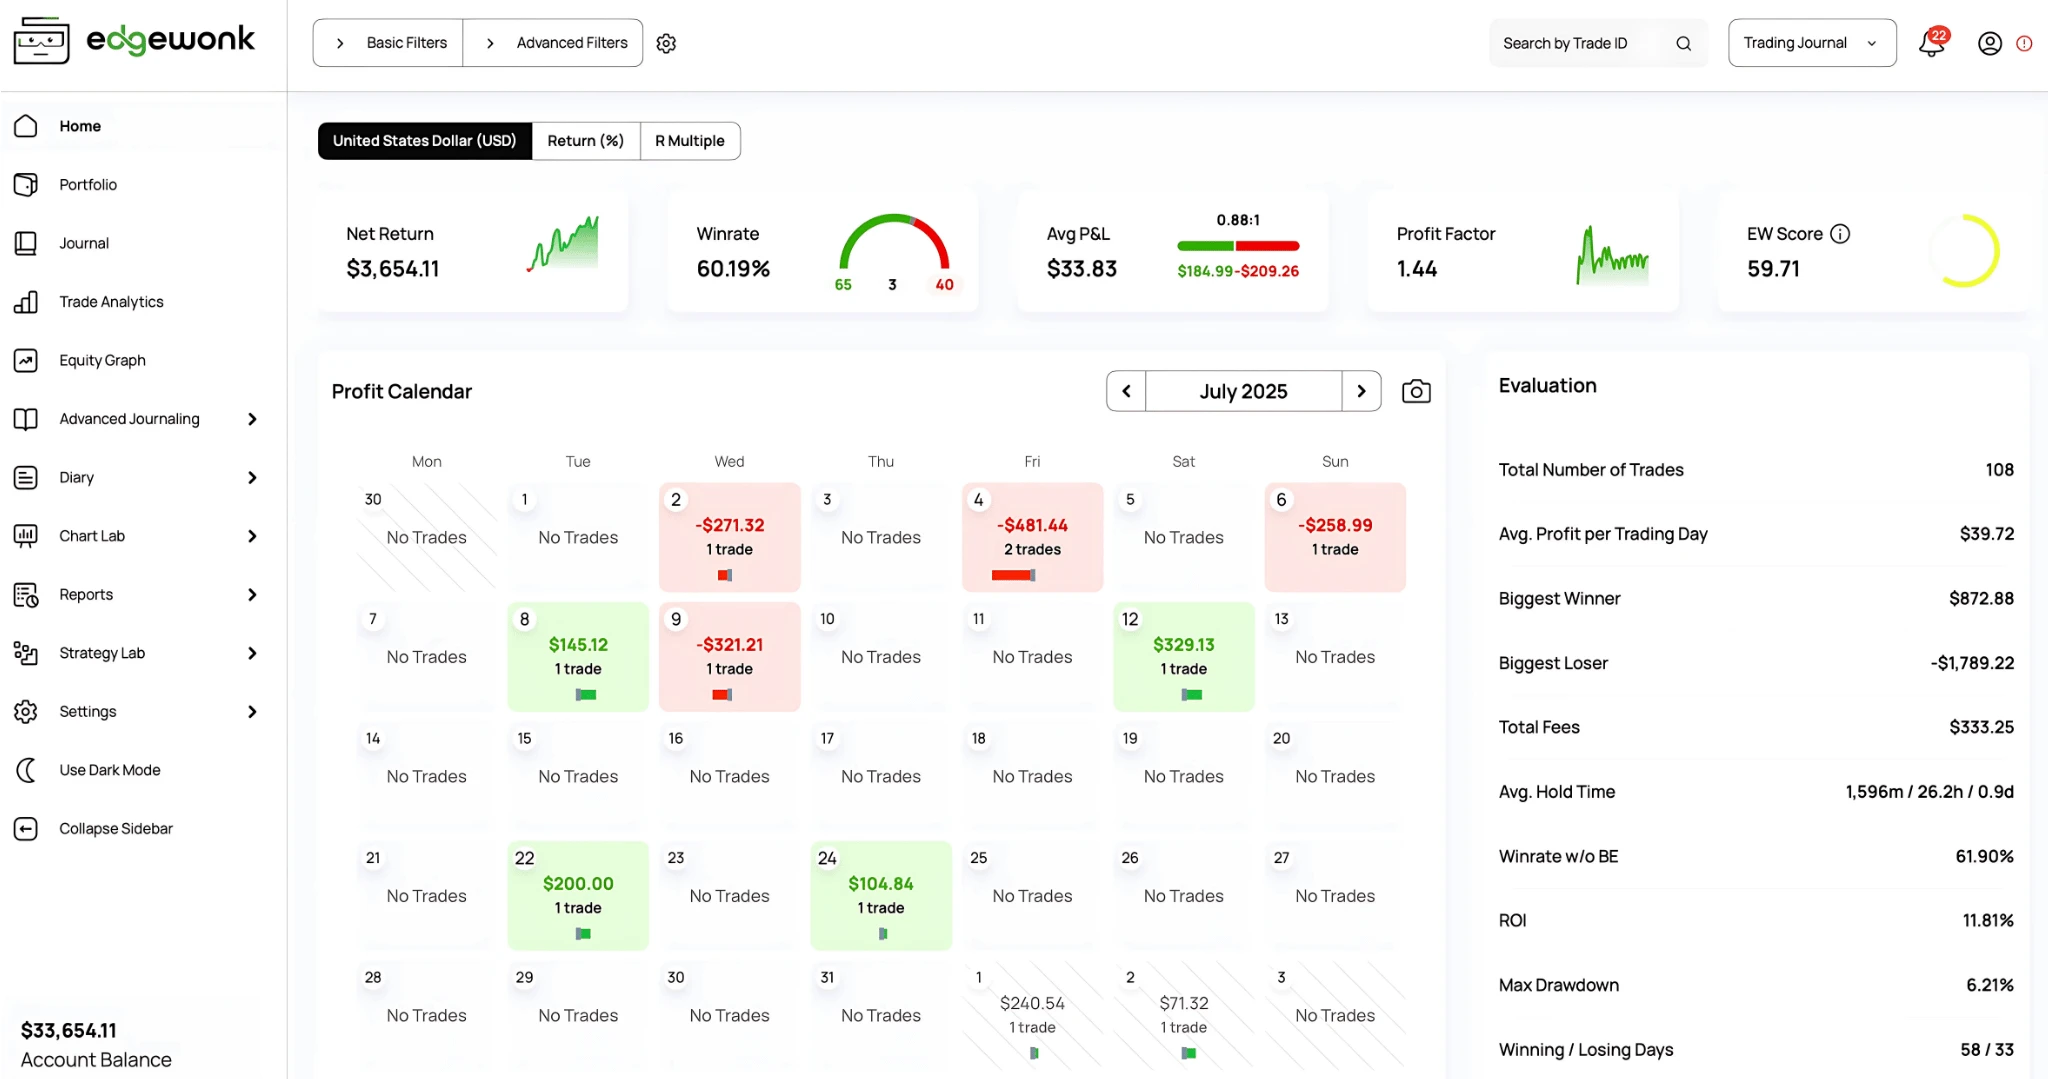
Edgewonk's strategy module is one of the most detailed in the industry. For swing traders who think systematically about strategy parameters, Edgewonk lets you define and track setups with granular psychological tagging at the trade level. The "tilt meter" and emotional state tracking are genuinely useful for identifying how your mental state affects swing trade decisions.
The trade-off for swing traders: no AI analysis, no AI agents, no conversational assistant that can answer questions about your data. No trade replay. No backtesting. No Notebook feature for thesis documentation during the hold. The psychology tagging is deep, but the platform does not connect that data to holding period analytics or market condition performance the way TradeZella does. For swing traders who want psychological depth as their primary focus, Edgewonk delivers. For traders who want thesis tracking, AI-powered session reviews, holding period optimization, and setup comparison in one platform, TradeZella covers more ground.
No AI analysis, no AI agents, no conversational assistant. No trade replay. No backtesting. No broker integration. The desktop-first design means you cannot add mid-trade notes from your phone easily. For swing traders who want deep psychological tracking and do not mind manual entry, Edgewonk is functional. For traders who want automated import, AI analysis, and a complete analytics platform, TradeZella offers more in every category except Edgewonk's psychology-specific tagging depth.
Pricing: $197/year subscription.
Which Journal Should Swing Traders Choose?
If you want the most complete swing trading journal, use TradeZella. Thesis tracking with the Notebook, holding period analytics, Strategies for setup comparison, Zella AI for automated analysis, and 500+ broker integrations. It handles everything swing traders need in one platform.
If you take fewer than 8 trades per week and want the simplest option, use TradeZella Essential at $29/month. The lower trade volume makes the Essential plan more than enough, and you get thesis tracking, holding period analytics, and AI agents from day one. The auto-import alone is worth the price compared to manual entry alternatives.
If psychology tracking is your primary focus, use TradeZella with custom emotion tags. Create tags for "confident entry," "hesitant entry," "held through fear," and "cut early out of anxiety." The Tags report shows exactly how your emotional state correlates with swing trade outcomes. Combine this with Zella AI to ask questions like "how do my hesitant entries perform versus confident entries?" and you get the psychology depth without sacrificing analytics or automation.
If you want to backtest swing strategies before trading them live, use TradeZella. The backtesting feature covers 11+ years of historical data across stocks, forex, crypto, and futures. Test your swing setups in bar replay mode, then compare backtest results against your live trading performance in the same dashboard. No other journal on this list includes backtesting.
What Reports Do Swing Traders Actually Need?
Swing traders do not need the same reports as day traders. Time-of-day analytics and daily loss limit tracking matter less when you are holding trades for days. These are the reports that drive swing trading improvement:
Holding period performance. Win rate and average R broken down by how long you held the trade. This single report has the highest diagnostic value for swing traders because it reveals whether you are cutting winners too early or holding losers past the point where your thesis broke. On a $50,000 account, if your 3 to 5 day trades produce 2.1R average and your 8+ day trades produce 0.4R average, you have a clear signal: your trading edge is concentrated in shorter-duration swings.
Setup performance with sample size. Profit factor and trading expectancy by strategy, with sample sizes visible. A "Breakout Continuation" setup showing a 2.8 profit factor on 42 trades is meaningful. The same number on 9 trades is noise. Swing traders accumulate data slowly, so sample size awareness is critical.
Market condition performance. Performance filtered by your market condition tags (trending, range-bound, high volatility, low volatility). This reveals which setups need a market filter. If your breakout setup has a 1.9 profit factor in trending markets and 0.7 in range-bound markets, you should stop trading breakouts in choppy conditions. That filter alone can save $800 to $1,500 per month on a $50,000 account.
Catalyst-based performance. Trades taken around earnings, FDA events, or sector catalysts perform differently than pure technical setups. Tag your trades by catalyst and filter. If earnings-related swing trades produce 0.3R average while your technical setups produce 1.7R, the data is telling you to stop trading around earnings.
Entry thesis vs. outcome tracking. Tag each trade at exit as "thesis confirmed" or "thesis broken." Over 50+ trades, this tells you whether your trade selection process is sound. If 70% of your winning trades had their thesis confirmed and 80% of your losers had a broken thesis before your stop was hit, your thesis process works but your exit timing on losers needs improvement. You can use TradeZella's analyze trading performance filters to cross-reference thesis tags with holding period and risk-reward ratio data.
The Swing Trader Weekly Review (30 Minutes)
This is a structured trade review process designed specifically for swing traders. Run it every Sunday. 30 minutes.
Step 1: Review every closed trade from the week (10 minutes). Read your entry thesis for each trade. Did the thesis play out? Tag the trade as "thesis confirmed" or "thesis broken." Look at your mid-trade notes. Was there a point where the thesis broke but you held anyway? That is the highest-cost pattern in swing trading.
Step 2: Review trades still open (5 minutes). For each open trade, refresh your thesis with current information. Has the original reason for the trade changed? If the thesis is broken, document why you are still holding. If it is still intact, document what would change your mind.
Step 3: Check setup performance over the last 30 days (5 minutes). Open TradeZella's Strategy comparison. Has any setup degraded? Is your breakout strategy still producing positive expectancy? Sample sizes may be small over 30 days, so look for directional signals rather than precise numbers.
Step 4: Check holding period performance (5 minutes). Is your average winning trade getting shorter (cutting winners) or longer (holding too long)? Look at the R-multiple distribution by holding period. The pattern you are looking for: are your best trades concentrated in a specific duration range?
Step 5: Write one observation in the Notebook (5 minutes). One pattern you noticed. One adjustment you want to test. One thing to watch next week. Over 3 months, these weekly observations become the raw material for refining your swing trading process.
The thesis-confirmation review in Step 1 is the highest-leverage part of the swing trader's week. Most losing swing trades have a broken thesis well before the stop is hit. The journal data shows you how often you hold through a broken thesis and what it costs.
What Are the Most Common Swing Trader Journal Mistakes?
Treating swing trades like day trades. Looking at entries and exits without context. A swing trade entry that looks bad in isolation might have been perfectly aligned with your thesis and market conditions. Without the thesis note, you cannot evaluate the decision quality.
Not documenting the thesis at entry. This is the single most common mistake. Without the entry thesis, you cannot evaluate whether you exited correctly, whether the trade worked for the right reasons, or whether your trade selection process is sound. Spend 60 seconds writing your thesis when you enter. It pays for itself at review time.
Holding without re-evaluation. A swing trade thesis can break mid-trade. If you do not add mid-trade notes, you will not catch the pattern of holding through broken theses. This is where revenge trading hides in swing trading. You refuse to exit a losing position because admitting the thesis broke feels like admitting a mistake. The Notebook mid-trade note forces you to articulate whether the thesis is still valid.
Ignoring holding period analytics. Swing traders often optimize entries while missing that they consistently hold too long or cut too early. On a $50,000 account risking $500 per trade, if your optimal hold is 3 to 5 days but you routinely hold for 10+ days, the drawdown management cost can reach $1,500 to $2,500 per month in trades that turn from winners to losers or from small losses to large ones.
Reviewing only the wins. The losing trades are where the thesis-breakdown patterns hide. Your winners confirm what you already know works. Your losers reveal the broken thesis patterns, the emotional holds, and the market conditions where your edge disappears. Spend more review time on losers than winners.
Not tagging market conditions. A swing setup that produces 2.3R in trending markets and -0.4R in choppy markets looks mediocre if you average everything together. Market condition tags separate signal from noise. Without them, you might abandon a profitable setup because your overall numbers are diluted by trades you should never have taken.
Swing traders need journals that prioritize thesis documentation, multi-day trade lifecycle tracking, and analytics broken down by holding period, setup, and market condition.
TradeZella is the strongest swing trader journal because the Notebook handles thesis tracking, Zella AI automates analysis and tagging, the Strategies feature compares setup performance side by side, and the holding period analytics show you exactly which trade durations are working.
The thesis-confirmation weekly review is the highest-leverage swing trading habit. Tag every trade as "thesis confirmed" or "thesis broken" at exit. Over 50+ trades, this single tag reveals whether your trade selection process works.
Holding period optimization is unique to swing trading. Your journal should show win rate, profit factor, and average R by how long you held each trade. Most swing traders discover their edge is concentrated in a specific duration range.
Market condition tags separate profitable setups from unprofitable conditions. A breakout setup with a 1.9 profit factor in trends and 0.7 in choppy markets needs a filter, not abandonment.
Frequently Asked Questions
Do swing traders need a different journal than day traders?
Yes. Day trader journals optimize for high-volume import speed, time-of-day analytics, and daily loss limit tracking. Swing trader journals need thesis documentation at entry, mid-trade notes during the hold, and holding period analytics that show which trade durations produce the best results. TradeZella handles both styles because the Notebook, Strategies, and analytics reports adapt to your trading frequency. But the features you prioritize as a swing trader are different.
How many trades do I need before swing trading journal analytics are useful?
Twenty to thirty trades per setup is the minimum for meaningful analytics. Swing traders accumulate data more slowly than day traders, so expect 2 to 3 months before you have enough trades per strategy to draw reliable conclusions. Overall portfolio analytics (holding period, market condition) become useful faster because they aggregate across all setups. Start journaling from your first trade so the data is there when you reach the sample size threshold.
What is the most important report for swing traders?
Holding period performance. This single report shows your win rate, profit factor, and average R broken down by how long you held each trade. Most swing traders discover their edge is concentrated in a specific duration range, typically 3 to 7 days. Trades held beyond that range often show declining returns. This insight alone can improve your results more than any other analytical adjustment.
Should swing traders track fundamental catalysts in their journal?
Yes. Performance by catalyst is often the most diagnostic analysis for swing traders. Create tags for "earnings setup," "sector rotation," "technical breakout," "news catalyst," and "no catalyst." Over 50 or more trades, the catalyst breakdown shows which types of swing trades produce the best risk-adjusted returns. Many swing traders discover that their pure technical setups outperform their catalyst-driven trades because catalyst timing is harder to control.
Is a free trading journal enough for swing trading?
Free journals provide basic trade logging and simple reports, but they lack the features swing traders need most: thesis-linked trade notes, holding period analytics, AI-powered analysis, and strategy comparison. TradeZella's Essential plan at $29 per month ($24 billed annually) gives you the full thesis tracking, Zella AI agents for automatic tagging and analysis, and the analytics depth that turns swing trade data into improvement. On a $50,000 account, identifying one broken pattern per month through better analytics pays for the platform many times over.
How often should swing traders review their journal?
Weekly. The 30-minute Sunday review works best for swing traders: review closed trades with thesis confirmation, check open positions, compare setup performance, check holding period trends, and write one observation. Monthly reviews (60 minutes) should zoom out to market condition performance and multi-month setup trends. Daily reviews are unnecessary for swing traders because trades are still open and the feedback cycle is longer.
Can I use TradeZella for both swing trading and day trading?
Yes. TradeZella's Strategies feature lets you define separate setups for swing trades and day trades, then compare performance independently. The analytics reports filter by strategy, so your swing trade data does not get mixed with your day trade data unless you want to see the combined view. Many traders run both styles in the same account, and TradeZella keeps the analytics separate while consolidating everything in one dashboard.