How to Backtest a Trading Strategy: The Complete Step-by-Step Process
How to Backtest a Trading Strategy: The Complete Step-by-Step Process
A complete walkthrough of the backtesting process from defining testable rules to running your test in TradeZella, calculating five key performance metrics, preventing forward bias, and validating results through forward testing before going live
class SampleComponent extends React.Component {
  // using the experimental public class field syntax below. We can also attach
  // the contextType to the current class
  static contextType = ColorContext;
  render() {
    return <Button color={this.color} />
  }
}
Last Updated: June 2, 2026
Backtesting is the process of applying a trading strategy's entry rules, exit rules, and risk parameters to historical price data to measure how the strategy would have performed across a large sample of trades. A proper backtest produces measurable metrics, including win rate, profit factor, expectancy, and maximum drawdown, that tell you whether a strategy has a statistical edge before you risk real capital.
Backtesting is how you find out if your trading strategy actually works before you put real money behind it. You take your entry rules, exit rules, and risk parameters, apply them to historical price data, and measure the results across dozens or hundreds of trades.
Most traders either skip backtesting entirely (and trade a strategy they've never verified) or do it wrong: scrolling through charts, cherry-picking the trades that confirm what they want to believe, and calling it "research." Both approaches lead to the same place: losing money on a strategy that was never proven to work.
A proper backtest answers two questions.
First, does this strategy produce a positive expectancy over a meaningful sample size?
Second, can you survive the drawdowns it produces along the way? A strategy that makes money over 100 trades but has a 15-trade losing streak in the middle is only useful if you can handle that streak without abandoning ship.
This guide walks through the entire backtesting process from start to finish. Not the theory. The actual steps, so you can follow along and apply the same process to any strategy you trade. For a broader overview of backtesting concepts, see our guide on backtesting trading strategies. TradeZella's backtesting tool makes this process practical. You scroll through 11+ years of historical data across stocks, forex, crypto, and futures with future price hidden. Every entry and exit you mark is logged automatically, your metrics calculate in real time, and your results are saved as a Strategy so you can compare backtest performance to live trading later.
Step 1: Define Your Rules Until Someone Else Could Trade Them
Before you open a chart, define your strategy rules clearly. In TradeZella, you can create a Strategy with your exact entry criteria, exit rules, and risk parameters built in. Every backtest trade gets logged against that Strategy automatically, and you can check whether you followed your rules on each trade. If you're not using a platform, write your rules on paper. The test: if you handed these rules to another trader, could they execute every trade identically to you? If the answer is no, your rules aren't specific enough to backtest.
What "not specific enough" looks like:
"Buy when the trend looks strong"
"Enter when price shows support"
"Take profit when it feels right"
These are judgment calls, not rules. They can't be tested because two traders would make different decisions on the same chart.
What testable rules look like:
Entry: Buy when the 20 EMA crosses above the 50 EMA on the 4-hour chart AND RSI(14) is above 50
Stop loss: 1.5x the 14-period ATR below entry price
Take profit: 3x the 14-period ATR above entry price (giving a 2:1 reward-to-risk)
Position size: Risk 1% of account per trade
Filter: No entries within 30 minutes of a major news release
Every component is defined. Entry trigger, stop placement, profit target, position sizing, and a filter for when NOT to trade. If any piece is missing, add it before you start testing. If you haven't built a complete rule set yet, our guide on how to create a trading plan walks through the six sections every plan needs. Once your rules are defined, save them as a Strategy in TradeZella. During your backtest, the platform tracks whether each trade followed your Strategy rules, so you get both performance data and a rule adherence score when you're done.
One rule most traders forget: the exit for trades that do nothing. If price hasn't hit your stop or your target after 10 bars (or whatever makes sense for your timeframe), what do you do? Close at market? Trail the stop? Let it run? Define this now, because "stuck" trades will happen in your backtest and you need a consistent rule for handling them.
Step 2: How to Run Your Backtest (The Process)
Here's the part most backtesting guides skip. Instead of just explaining the concept, let's walk through exactly what the process looks like from start to finish.
Choose your instrument and time period
Pick the instrument you plan to trade live. If you trade EUR/USD, backtest on EUR/USD. If you trade ES futures, backtest on ES. Testing on one instrument and trading another defeats the purpose.
For the time period, select at least 12-18 months of data that includes different market conditions: trending periods, ranging periods, and at least one high-volatility event. Testing only during a strong uptrend tells you nothing about how your strategy handles choppy or bearish conditions.
Set up your chart
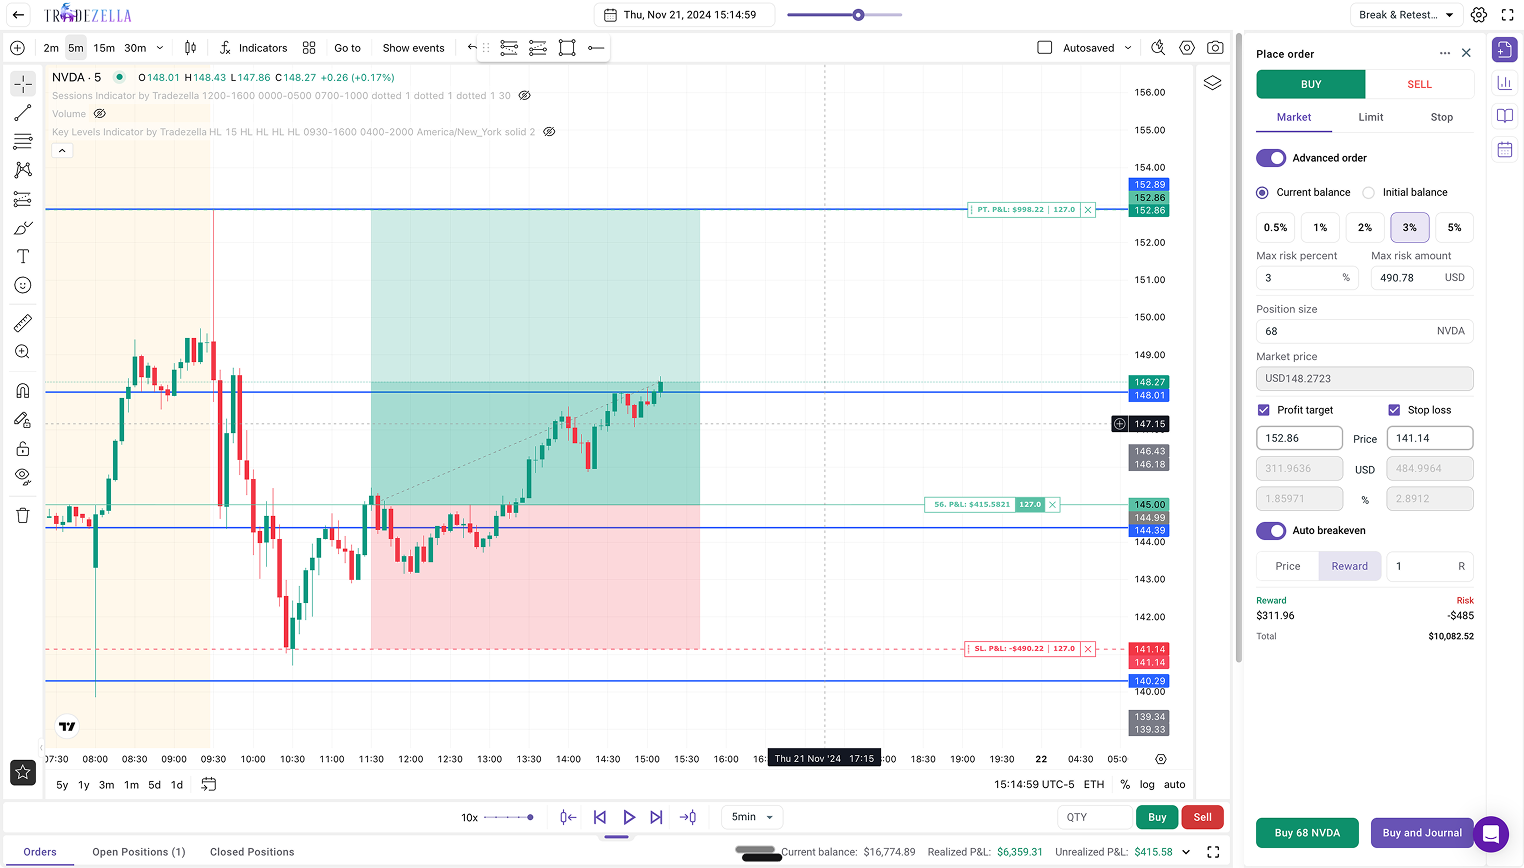
Open TradeZella's backtesting tool and load your instrument on the timeframe your strategy uses. Add your indicators (moving averages, RSI, ATR, or whatever your rules require). TradeZella loads 11+ years of historical data across stocks, forex, crypto, and futures, so you have plenty of range to work with.
The key: future price must be hidden. In TradeZella, the backtesting mode automatically hides future candles and lets you scroll forward one bar at a time. This prevents forward bias, which is the #1 backtest killer (more on that in Step 3).
TradeZella Backtesting Interface
Execute each trade mechanically
Scroll forward candle by candle. When your entry conditions are met, mark the entry on the chart. Calculate your stop loss and take profit based on your rules (for example, if your rule is 1.5x ATR for the stop and 3x ATR for the target, calculate those levels from the ATR value at entry). Mark your exit levels.
Continue scrolling. When price hits your stop or your target, the trade is closed. Log the result: winner, loser, or breakeven. Record the R-multiple (+2R for a full target hit on a 2:1 setup, -1R for a stop loss hit). In TradeZella, this logging happens automatically as you mark trades on the chart. Every entry, exit, and result is captured without manual spreadsheet work.
Repeat for every valid signal across your entire test period. Take every trade that meets your rules, even the ones that "don't look right." Skipping trades because of gut feeling is not backtesting. It's storytelling.
How many trades to expect
Most backtests on the 4-hour timeframe produce 40-70 trades over 18 months. On shorter timeframes (15-minute, 5-minute), you'll get more signals and can build a larger sample faster. On daily charts, expect fewer signals and a longer testing period. Aim for at least 50 trades regardless of timeframe. Expect the process to take 3-5 hours of focused chart scrolling for 50+ trades.
What your backtest log should look like
Whether you use TradeZella or a manual spreadsheet, every trade gets a row with these columns:
Trade number
Date and time of entry
Entry price
Stop loss price
Take profit price
Result (winner/loser/breakeven)
R-multiple (+2R, -1R, etc.)
Duration (how long the trade was open)
Notes (anything unusual about market conditions)
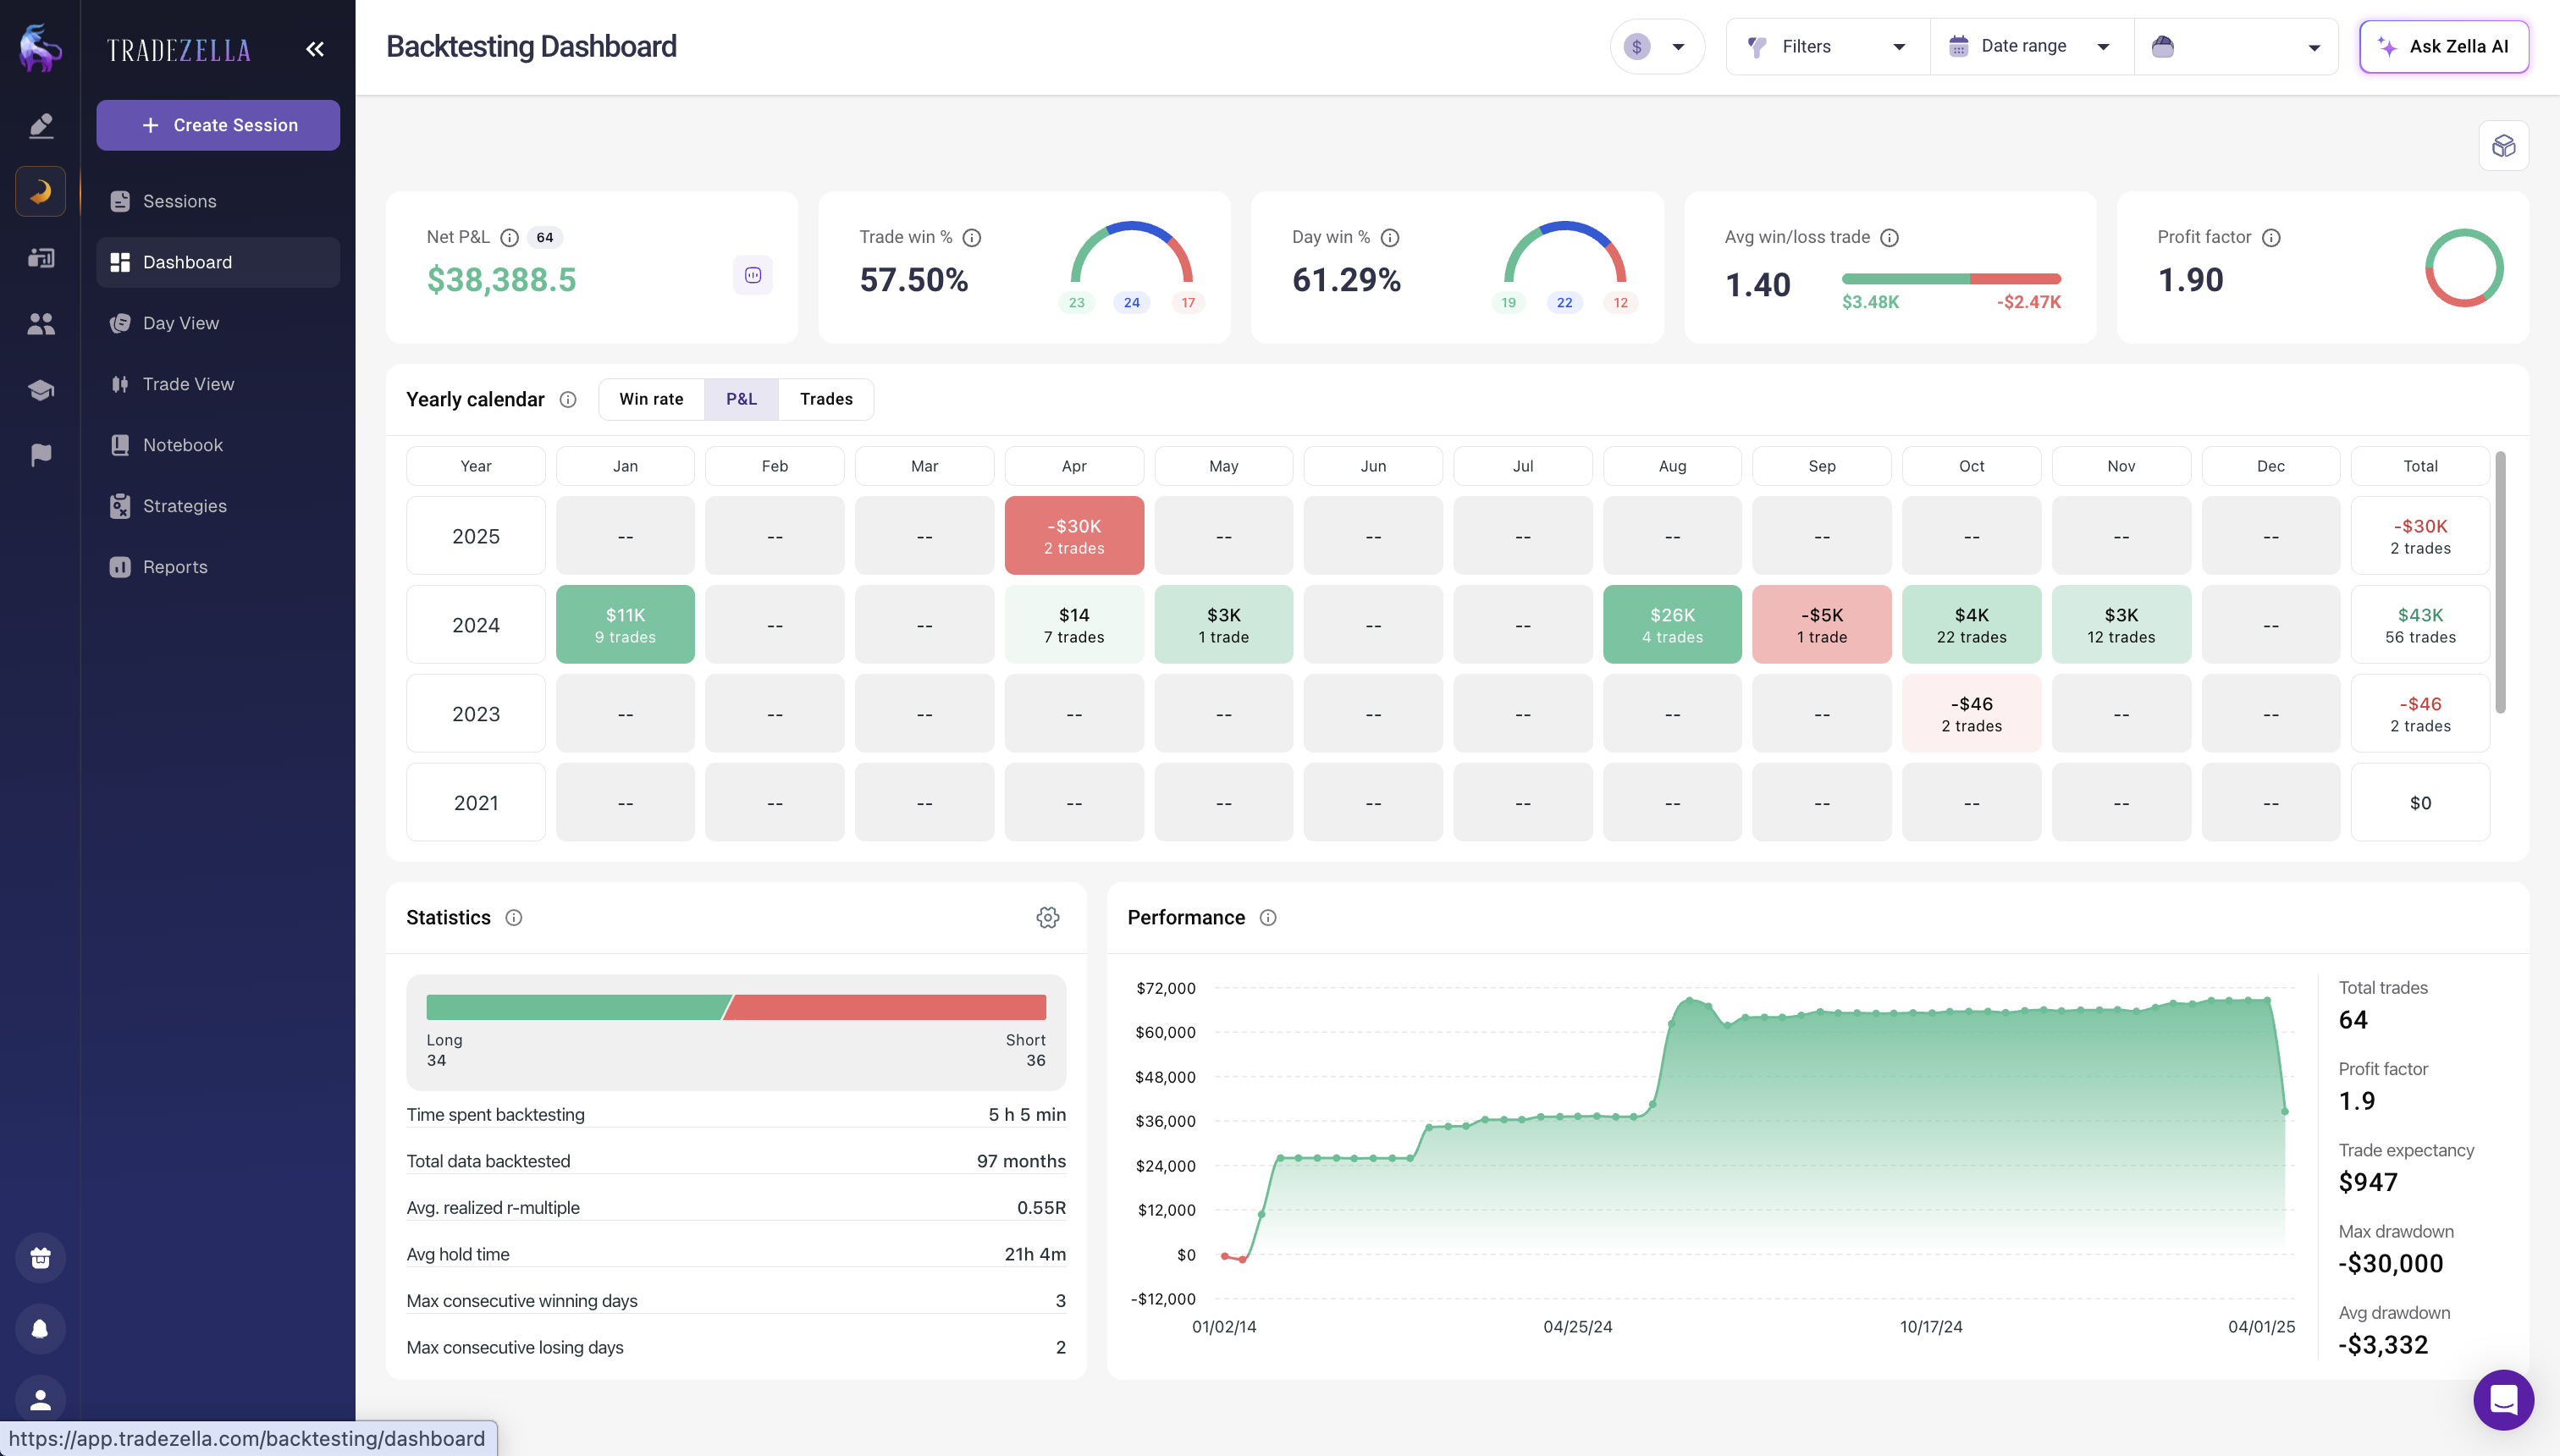
After 50 trades, this log is your raw data. It tells you everything about whether this strategy works. TradeZella's backtesting mode handles this logging automatically, and your results feed directly into the same analytics dashboard you use for live trading, so comparing backtest performance to live execution is one click.
Step 3: The #1 Backtest Killer (And How to Prevent It)
Forward bias will destroy your backtest results more than anything else. It works like this: when you're scrolling through a chart and you can see what happens next, your brain unconsciously skips trades that would lose and enters trades that would win. You don't even realize you're doing it. The result is a backtest that looks incredible on paper and falls apart the moment you trade it live.
How forward bias sneaks in:
You see a big red candle after a signal and "decide" the signal wasn't quite clean enough to take
You notice price rallied hard after entry and hold past your take profit "to let it run"
You skip a valid signal because you can see the news spike that's about to happen
You enter slightly earlier than your rules say because you can see the move is about to start
Every one of these decisions biases your results upward. After 50 trades with even minor forward bias, your backtest could show a 60% win rate when the real number is 45%.
How Many Trades Do You Need for a Reliable Backtest?
Ten trades tell you almost nothing. You could flip a coin 10 times and get 8 heads. That doesn't mean the coin is biased. It means 10 is too small a sample.
30 trades: The bare minimum to start seeing patterns. At 30 trades, you can get a rough sense of whether your strategy is wildly unprofitable or potentially viable. But the numbers can still swing dramatically. A strategy with a true 50% win rate could easily show anywhere from 37% to 63% over 30 trades just from normal variance.
50 trades: A solid working sample. The noise starts to settle. Your win rate, average win, and average loss are getting closer to their true values. Most traders can make a reasonable go/no-go decision at 50 trades.
100+ trades: Statistical confidence. At this point, your metrics are reliable enough to make real capital allocation decisions. If your strategy is profitable over 100 trades across multiple market conditions (trending, ranging, high volatility, low volatility), you have something real.
Why this matters practically: A strategy with a true 55% win rate can easily produce a run of 8 consecutive losses within 100 trades. That's not a broken strategy. That's normal variance. But if you only tested 30 trades and 8 of them lost in a row, you'd probably throw the strategy out. More data protects you from making bad decisions based on small samples. TradeZella's backtesting tool makes hitting larger sample sizes practical because it logs every trade automatically as you scroll, so there is no manual spreadsheet entry slowing you down.
How Do You Analyze Backtest Results?
You've completed 50 trades in your backtest. Now you need to know if this strategy is worth trading with real money. Here are the five metrics that answer that question. In TradeZella, all five calculate automatically as you mark trades, so you can watch your edge develop in real time instead of waiting until the end. For a deeper dive into each metric and how to filter by strategy, time of day, and custom tags, see our full guide on how to analyze your trading performance.
Metric
Formula
Example Result
Minimum to Pass
What It Tells You
Win Rate
Winners ÷ Total Trades
44%
Context-dependent
How often you win. Meaningless without reward-to-risk context. A 40% win rate with 2:1 R:R is profitable.
Avg Win vs. Avg Loss
Mean R of winners vs. mean R of losers
+1.85R / -1.0R
Winners > Losers
How much you make when right vs. how much you lose when wrong. Bigger ratio = more margin for error.
Profit Factor
Gross Profit ÷ Gross Loss
1.45
Above 1.3
For every dollar lost, how much you made back. Above 1.5 is solid. Above 2.0 is excellent. Below 1.0 means net loss.
Expectancy
(Win% × Avg Win) − (Loss% × Avg Loss)
+0.254R
Positive (> 0)
Your expected profit per trade. The single most important number. Negative = the strategy loses money over time.
Max Drawdown
Worst peak-to-trough decline in R
-6R (6%)
Within your tolerance
The worst losing streak you need to survive. If you can't handle this drawdown psychologically, reduce risk per trade.
1. Win Rate
Say your backtest produces 50 trades: 22 winners and 28 losers. That's a 44% win rate.
Your gut reaction is probably "44% is bad." It's not. Win rate means nothing without context. A 44% win rate with a 2:1 reward-to-risk is highly profitable. A 65% win rate with a 0.5:1 reward-to-risk is a slow bleed. Always evaluate win rate alongside average win and average loss.
2. Average Win vs. Average Loss
In this example, your 22 winners averaged +1.85R (some hit the full 2R target, a few were closed early due to a time-based exit rule). Your 28 losers averaged -1.0R (most hit the stop loss exactly).
This means your average winner was 1.85x the size of your average loser. When you win, you win almost twice as much as you lose when you're wrong.
3. Profit Factor
Total gross profit divided by total gross loss.
Gross profit: 22 winners x 1.85R average = 40.7R
Gross loss: 28 losers x 1.0R average = 28.0R
Profit factor: 40.7 / 28.0 = 1.45
What this means: for every dollar you lost, you made $1.45 back. Anything above 1.0 is net profitable. Above 1.5 is solid. Above 2.0 is excellent.
At 1.45, this strategy is profitable but not spectacular. You'd want to see it hold above 1.3 in live trading (where slippage and execution errors typically reduce performance by 10-20% from backtested results). In TradeZella, your profit factor updates in real time during the backtest, so you can see whether your edge is developing before you've even finished all 50 trades.
4. Expectancy Per Trade
This is the most important single number. It tells you how much you expect to make on average per trade.
Expectancy = (Win rate x Average win) - (Loss rate x Average loss)
Expectancy = (0.44 x 1.85R) - (0.56 x 1.0R)
Expectancy = 0.814R - 0.56R = +0.254R per trade
In plain English: every time you take this trade, you expect to make 0.254R on average. On a $25,000 account risking 1% per trade ($250 per trade), that's $63.50 expected profit per trade. Over 50 trades, that's $3,175. Over 200 trades in a year, that's $12,700.
If expectancy is negative, the strategy loses money over time regardless of how good individual trades feel. Stop trading it.
5. Maximum Drawdown
The worst peak-to-trough decline during your backtest. Say your worst stretch is 6 consecutive losers (-6R). On a $25,000 account risking 1%, that's a $1,500 drawdown (6% of your account).
Ask yourself: could you keep trading this strategy after losing 6 trades in a row? After watching your account drop 6% without a single win? If the answer is no, either reduce your risk per trade or find a strategy with a shallower drawdown.
In TradeZella, your backtest results are calculated automatically as you mark trades. Win rate, profit factor, expectancy, and drawdown update in real time so you can see whether a strategy is developing an edge as you test rather than waiting until you've finished all 50+ trades.
What to do: After completing your backtest, check these five metrics. If expectancy is positive and maximum drawdown is within your tolerance, move to forward testing. If expectancy is negative or drawdown exceeds what you can handle psychologically, adjust one rule at a time and retest.
A profitable backtest does not mean you should go live with real money tomorrow. There's a critical step in between: forward testing.
Forward testing means trading your strategy on a demo account in real-time market conditions for 2-4 weeks. You follow the exact same rules from your backtest, but now you're dealing with things backtesting can't simulate:
Execution hesitation. When a signal triggers and you have to actually click the button, your brain will find reasons not to. "This one doesn't look as clean." "Maybe I should wait for the next one." That hesitation didn't exist in your backtest. This is where FOMO works in reverse: instead of jumping into trades you shouldn't take, you freeze on trades you should.
Slippage and spreads. In a backtest, your entries execute at exactly the price you specify. In live markets, you might get filled 1-3 pips worse. Over 100 trades, that adds up.
Emotional drawdowns. Losing 6 trades in a row on historical data feels like a data point. Losing 6 trades in a row with money on the line feels like your strategy is broken. This is exactly where trading tilt kicks in. Loss tilt after a drawdown can trigger revenge trading, where you abandon your rules and overtrade to make back losses. Forward testing lets you experience the drawdowns before real capital is involved.
The forward testing process
Trade your backtested strategy on a demo account for 20-30 trades
Log every trade with the same columns as your backtest
Compare your live execution metrics to your backtest metrics
If win rate, average R, and profit factor are within 15-20% of your backtest numbers, the strategy translates to live trading
If performance is significantly worse, investigate why (execution errors? Skipping signals? Different market conditions?)
Only after forward testing confirms your backtest results should you go live. Start with the smallest position size that still feels meaningful, and scale up gradually as live results continue to match.
In TradeZella, your forward test trades import automatically from your broker. You can compare your live performance metrics side by side with your backtest metrics to see exactly how your real execution stacks up against the historical data. Use your trade review process to compare backtest expectations with live results weekly.
What to do: Create a Strategy in TradeZella for your backtested strategy. Name it something specific (like "EMA Cross 4H Longs"). Forward test for 20-30 trades, then pull up the Strategy analytics and compare to your backtest log. If the numbers are within range, you have a validated strategy.
What Mistakes Invalidate a Backtest?
Curve fitting. You run a backtest, see mediocre results, tweak one parameter, retest, tweak another, retest, and repeat until the numbers look great. The problem: you've optimized for past noise, not future signal. A curve-fitted strategy looks perfect on historical data and falls apart immediately in live markets. Limit yourself to 2-3 parameter adjustments max. If the strategy isn't profitable with reasonable rule variations, the edge isn't there. In TradeZella, you can run separate backtests on different time periods and compare the results side by side to catch this. If performance collapses on unseen data, you've overfit. You can also run your final parameters through the Monte Carlo Simulator on our free trading calculators page to stress-test for randomness.
Ignoring trading costs. Your backtest shows a 1.3 profit factor. But you didn't account for the $5 round-trip commission and 1-2 pips of slippage per trade. On a strategy averaging 30 pips per trade, that's 8-10% of your gross profit gone. Suddenly your 1.3 profit factor is 1.15, and your edge is razor-thin. Always subtract realistic costs from your backtest results.
Cherry-picking. "I would have skipped that trade because the candle didn't look right." If it met your rules, it counts. The entire point of mechanical rules is removing judgment. If you skip trades that meet your criteria because you don't like how they look, you're not backtesting. You're storytelling. TradeZella's bar replay mode helps here because you mark entries and exits as signals appear in real time. You can't scroll back and remove a trade after seeing the outcome. This is where trading discipline matters most. If you can't follow rules in a backtest where no money is on the line, you won't follow them live.
Testing in one market condition. Backtesting a trend-following strategy during a strong uptrend proves nothing. Of course it works. Test through at least: one trending period, one ranging period, one high-volatility event (like a Fed announcement week), and one low-volume period (like late December). If the strategy only works in one condition, you need a filter to identify that condition in real time. TradeZella's 11+ years of historical data gives you enough range to test across multiple market environments without switching platforms.
Changing rules mid-backtest. If you're on trade #25 and decide to change your stop loss from 1.5x ATR to 2x ATR, you have to start over from trade #1 with the new rule. You can't use the first 25 trades with one set of rules and the next 25 with another. That's two different strategies combined into one meaningless data set.
Key Takeaways
Backtesting applies your strategy rules to historical data and measures performance across dozens or hundreds of trades. It answers whether your strategy has a positive expectancy and whether you can survive its drawdowns.
Your rules must be mechanical enough that another trader could execute them identically. If any part requires "judgment," it can't be backtested reliably.
Forward bias (seeing future price action while testing) is the #1 backtest killer. Use bar replay mode or cover the right side of your chart.
Minimum 50 trades for a working sample, 100+ for statistical confidence. A 55% win rate strategy can still produce 8 consecutive losses within 100 trades from normal variance.
Five metrics determine if a strategy is viable: win rate, average win vs. average loss, profit factor (above 1.3 minimum), expectancy per trade (must be positive), and maximum drawdown (must be within your psychological tolerance).
After backtesting, forward test on a demo account for 20-30 trades before going live. Compare forward test metrics to backtest metrics. If they're within 15-20%, the strategy translates to live trading.
Common backtest killers: curve fitting (over-optimizing to past data), ignoring trading costs, cherry-picking trades, testing in only one market condition, and changing rules mid-test.
Apply this process to any strategy you trade, from scalping strategies on 1-minute charts to swing trading strategies on daily timeframes. The sample size and testing period change, but the five metrics and the forward testing step remain the same.
TradeZella's backtesting tool supports both manual bar-by-bar replay with automatic result tracking across 11+ years of data and automated backtesting, which lets you define your rules in plain English and run them across historical data automatically without scrolling through each candle.
Backtesting is the process of applying a trading strategy's rules to historical price data to measure how it would have performed. You scroll through past charts, take every trade that meets your criteria, and log the results. After 50 to 100 or more trades, you can calculate win rate, expectancy, and drawdown to determine if the strategy has a real edge. Platforms like TradeZella automate this entire process. You scroll through historical charts with future price hidden, mark your entries and exits, and the platform calculates all your performance metrics in real time.
How many trades do I need for a reliable backtest?
Thirty trades is the bare minimum for a rough baseline, but results at this sample size are unreliable. Fifty trades give you a solid working picture. One hundred or more trades across different market conditions provide statistical confidence. A strategy with a true 55% win rate can easily show anywhere from 37% to 63% over just 30 trades from normal variance. The more trades you test, the closer your metrics get to the strategy's true performance.
Can a strategy be profitable with a 40% win rate?
Yes. Win rate alone means nothing without knowing the reward-to-risk ratio. A 40% win rate with a 3:1 average winner-to-loser ratio has an expectancy of 0.60R per trade, which is an excellent strategy. What matters is expectancy, not win rate in isolation. Many professional trend-following strategies have win rates below 50% but remain highly profitable because their winners are significantly larger than their losers.
What is the most important backtesting metric?
Expectancy per trade. It combines win rate, average win, and average loss into a single number that tells you how much you can expect to earn per trade on average. The formula is: win rate multiplied by average win, minus loss rate multiplied by average loss. If expectancy is positive over 100 or more trades, the strategy has a statistical edge. If it is negative, the strategy loses money over time regardless of any individual wins.
How do I know if I am curve fitting?
If you have adjusted your strategy rules more than two to three times to improve backtest performance, you are likely curve fitting. The telltale sign is that your optimized strategy looks great on the historical data you tested but performs poorly on new, unseen data. To check, test your final rules on a separate time period you did not use for optimization. If performance holds, the edge is likely real. If it collapses, you have fit to noise rather than finding a genuine pattern.
Should I backtest manually or use software?
Both have value. Manual backtesting, which means scrolling through charts candle by candle, forces you to deeply understand your strategy's behavior and builds pattern recognition. Software backtesting is faster and eliminates some human bias. The best approach is to manual backtest your first 50 trades to internalize the strategy, then use software for larger sample testing. TradeZella's backtesting tool lets you scroll through 11+ years of historical data with automatic result tracking, combining the depth of manual testing with the accuracy of automated logging. TradeZella also offers automated backtesting, which lets you define your rules in plain English and run them across historical data automatically.
What is the difference between backtesting and forward testing?
Backtesting applies your strategy rules to historical price data to measure past performance. Forward testing, also called paper trading or demo trading, means trading your strategy in real-time market conditions without risking real money. Both are essential. Backtesting tells you whether the strategy has a statistical edge over a large sample. Forward testing reveals whether you can actually execute it under live conditions, where execution hesitation, slippage, and emotional drawdowns come into play. A strategy should pass both before you trade it with real capital.