How to Analyze Your Trading Performance (The Data-Driven Approach)
How to Analyze Your Trading Performance (The Data-Driven Approach)
Most traders look at their total P&L and call it analysis. Real performance analysis means understanding five core metrics, filtering them across five dimensions, and running a structured weekly review that turns raw numbers into specific decisions. This guide covers the complete framework with dollar examples, benchmarks, and the exact reports to use.
class SampleComponent extends React.Component {
  // using the experimental public class field syntax below. We can also attach
  // the contextType to the current class
  static contextType = ColorContext;
  render() {
    return <Button color={this.color} />
  }
}
Last Updated: April 21st, 2026
Trading performance analysis is the process of measuring your trading results using quantitative metrics, filtering those results across multiple dimensions, and using the patterns you find to make specific, data-driven improvements. Effective performance analysis goes beyond total P&L. It uses metrics like win rate, profit factor, expectancy, maximum drawdown, and average R-multiple to evaluate whether a trading strategy has a statistical edge, and then filters those metrics by setup type, time of day, day of week, ticker, and holding time to identify exactly where the edge exists and where it breaks down.
Most traders check their account balance and call it analysis. They know they are up $800 this month or down $1,200, but they cannot answer the question that actually matters: why? Performance analysis answers that question. It tells you which setups are making money and which are losing it. It tells you that your morning trades have a profit factor of 2.1 but your afternoon trades drop to 0.7. It tells you that your $500-risk trades outperform your $200-risk trades because you are more selective with the bigger positions.
This guide covers the five metrics every trader should track, the five filtering dimensions that reveal where your edge lives, a 30-minute weekly review process, and the four most common analysis mistakes that lead traders to the wrong conclusions. If you already have a tracker set up (see our best trading trackers comparison if you do not), this is how you actually use it.
Metric
Formula
Benchmark
What It Tells You
Red Flag
Win Rate
Winning trades ÷ Total trades
40-60% (day), 35-45% (swing)
How often you are right (meaningless without reward-to-risk context)
Below 30% with <2:1 R:R
Profit Factor
Gross profit ÷ Gross loss
>1.3 solid, >1.5 strong
Best quick health check: dollars won per dollar lost
Below 1.0 over 50+ trades
Expectancy
(Win% × Avg Win) − (Loss% × Avg Loss)
Positive = edge exists
Average dollars made per trade over time
Negative over 50+ trades
Max Drawdown
Largest peak-to-trough decline
<15% personal, <5-10% prop
Maximum pain between equity peaks (tradeability test)
>20% personal, >5% prop
Avg R-Multiple
Avg (trade P&L ÷ initial risk)
>0.2R profitable, >0.5R strong
Dollars returned per dollar risked (purest edge measure)
Negative over 50+ trades
What Are the Five Metrics That Actually Matter?
There are dozens of trading metrics. Most of them are noise. These five, measured together, tell you everything you need to know about whether your approach has a statistical edge and whether you are executing it properly.
1. Win Rate
Your win rate is the percentage of trades that close at a profit. If you take 100 trades and 45 are profitable, your win rate is 45 percent.
Benchmark: A 40 to 60 percent win rate is typical for most profitable day traders. Scalpers often run 55 to 70 percent with smaller reward-to-risk. Swing traders may sit at 35 to 45 percent with larger winners.
What it tells you: Win rate alone tells you almost nothing. A 70 percent win rate with a 0.5:1 reward-to-risk loses money. A 35 percent win rate with a 3:1 reward-to-risk is extremely profitable. Always measure win rate alongside profit factor and expectancy.
In TradeZella: The Trade Win % widget sits on your dashboard and updates in real time. You can also view win rate filtered by Strategy, time of day, ticker, and custom tags in the reports section. The Day Win % widget shows what percentage of your trading days end positive, which is a different (and sometimes more useful) perspective than per-trade win rate.
2. Profit Factor
Your profit factor is total gross profit divided by total gross loss. If your winners total $12,000 and your losers total $8,000, your profit factor is 1.5.
Benchmark: Above 1.0 means net profitable. Above 1.3 is solid. Above 1.5 is strong. Above 2.0 is exceptional (and rare over large sample sizes). Below 1.0 means you are losing money.
What it tells you: Profit factor is the single best quick health check for a strategy. It combines win rate and reward-to-risk into one number. A profit factor of 1.5 means you make $1.50 for every $1.00 you lose. It is the most reliable metric for comparing one strategy against another or one time period against another.
In TradeZella: Profit Factor is a dashboard widget and appears in every report category. Filter it by Strategy to compare setups: maybe your breakout strategy has a PF of 1.8 while your mean reversion strategy sits at 0.9. That single filter tells you exactly where to focus.
3. Expectancy
Trading expectancy is the average dollar amount you expect to make (or lose) per trade. The formula is: (Win Rate x Average Win) minus (Loss Rate x Average Loss).
Example: You have a 45 percent win rate. Your average win is $420. Your average loss is $280. Expectancy = (0.45 x $420) minus (0.55 x $280) = $189 minus $154 = $35 per trade. Over 100 trades, that is $3,500.
Benchmark: Positive expectancy means your system makes money over time. The dollar amount depends on your risk size. On a $50,000 account risking $500 per trade, an expectancy of $35 per trade means a return of 7 percent per 100 trades just from the math.
What it tells you: Expectancy answers the most important question in trading: does this approach make money? If expectancy is positive over 50 or more trades, you have a statistical edge. If it is negative, no amount of discipline will make the system profitable.
In TradeZella: Trade Expectancy is both a dashboard widget and a metric available in reports. It calculates automatically from your closed trades. Filter by Strategy to see expectancy per setup, or by date range to see if expectancy has changed over time (which might signal a market regime shift).
4. Maximum Drawdown
Maximum drawdown is the largest peak-to-trough decline in your account equity during a specific period. If your account peaks at $55,000 and drops to $49,500, your max drawdown is $5,500 or 10 percent.
Benchmark: Personal accounts: keep max drawdown under 15 percent. Prop firm accounts: most firms set hard limits at 5 to 10 percent. For a detailed breakdown of drawdown tiers and recovery protocols, see our drawdown management guide.
What it tells you: Drawdown tells you how much pain your strategy delivers between peaks. A system with 1.5 profit factor but 25 percent max drawdown is almost untradeable psychologically, even though it is technically profitable. Drawdown is the metric that determines whether you can actually stick with a strategy through the hard periods.
In TradeZella: Both Max Drawdown and Average Drawdown are dashboard widgets. The Drawdown chart widget shows drawdown across trading days visually, so you can see exactly when the worst periods happened and how long recovery took. For prop firm traders, the Challenge widget tracks drawdown against your firm's specific limits. The risk management connection is direct: if your drawdown exceeds your plan's threshold, reduce size using the Position Size Calculator until you recover.
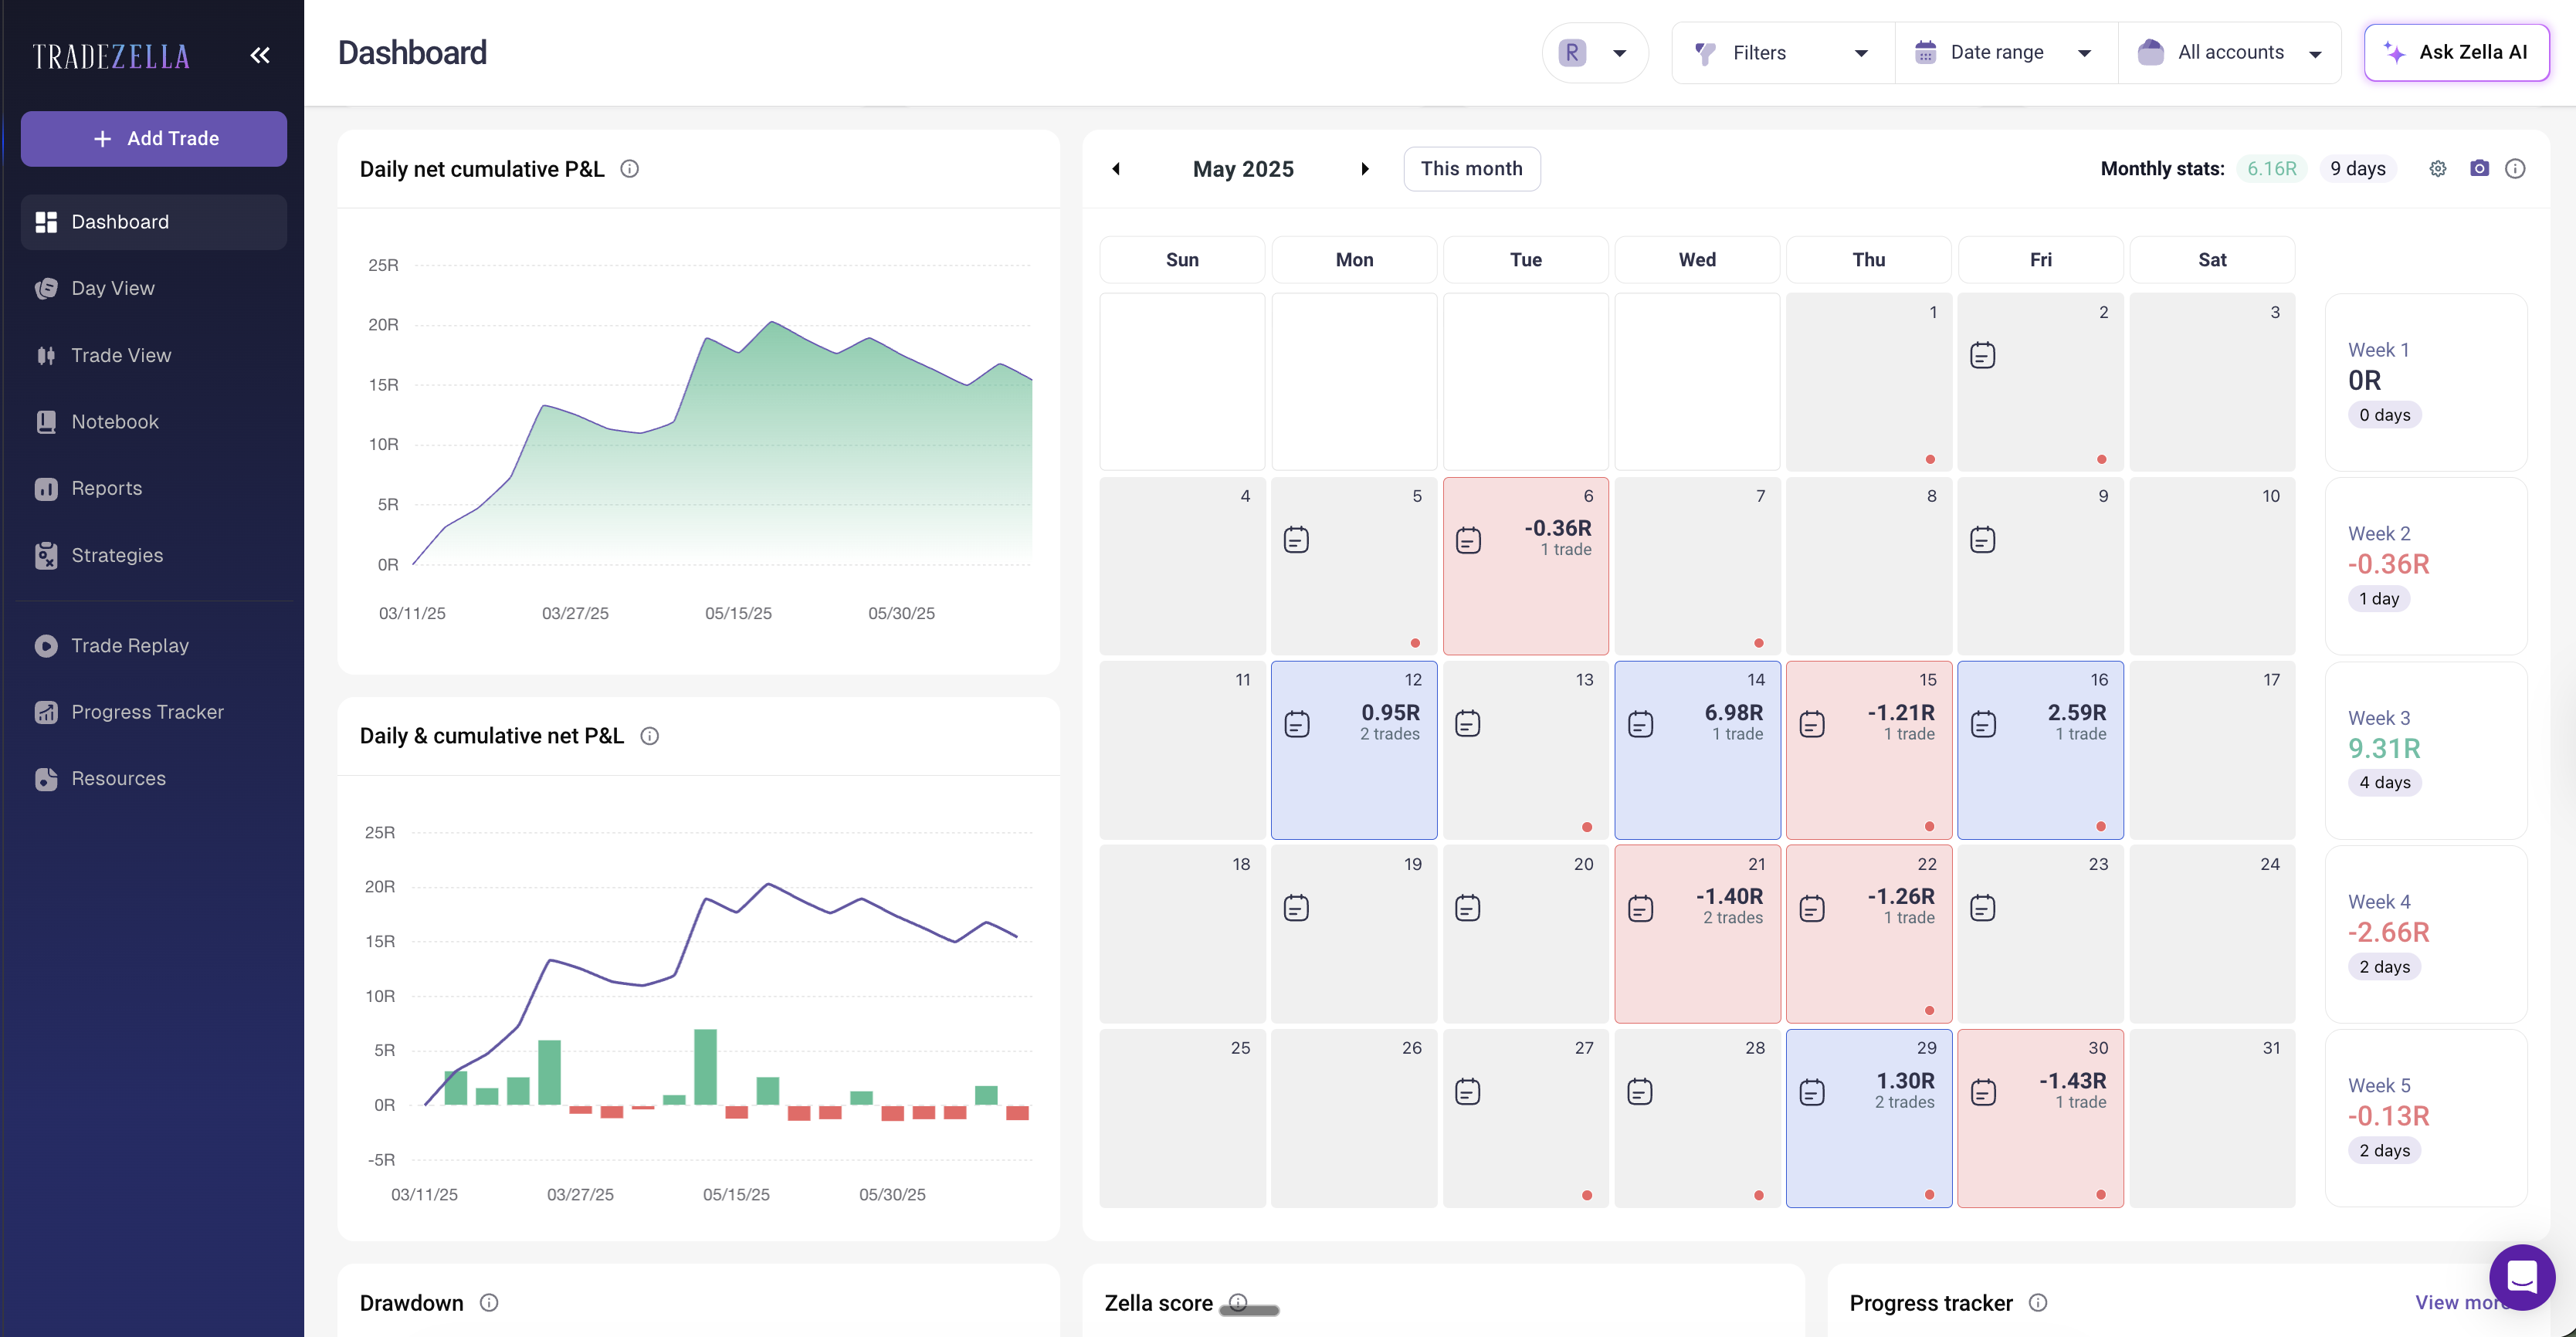
TradeZella Dashboard showing Profit Factor, Win Rate and Expectancy
5. Average R-Multiple
Your R-multiple measures each trade's return relative to the initial risk. If you risk $300 on a trade and make $600, that is a 2R winner. If you lose $300, that is a 1R loser.
Benchmark: An average R-multiple above 0.2R over a large sample means the system is profitable. Above 0.5R is strong. The best systems average 0.3R to 0.8R per trade over hundreds of trades.
What it tells you: R-multiple normalizes performance regardless of position size. It answers: for every dollar you risk, how many dollars do you make back on average? This is the purest measure of edge because it removes the noise of variable position sizing.
In TradeZella: Switch your dashboard to R-Multiple View to see every widget recalculated in R terms instead of dollars. This is especially powerful for traders who vary their position size. In dollar terms, a $1,000 winner on a $500 risk looks the same as a $1,000 winner on a $900 risk. In R-multiple terms, the first is a 2R winner and the second is a 1.1R winner. R-multiple view reveals the true quality of your trades.
How Do You Filter Your Data to Find Real Insights?
Aggregate metrics tell you whether your overall approach is working. Filtered metrics tell you specifically where it works and where it breaks. This is where most traders stop too early. They see a profit factor of 1.2 and think the whole system is marginal, when in reality one strategy has a PF of 2.0 and another has a PF of 0.6. The aggregate hides the insight. Filtering reveals it.
Filter 1: By Strategy (Setup Type)
This is the most important filter. If you trade multiple setups, your aggregate metrics blend them together. In TradeZella, use the Strategies feature to define each setup with specific entry rules. Then pull the Strategy report to see win rate, profit factor, and expectancy per setup independently.
Example: A trader on a $50,000 account has an aggregate profit factor of 1.1. Filtered by Strategy: "Opening Range Breakout" has a PF of 1.7 over 40 trades. "VWAP Reversal" has a PF of 0.7 over 25 trades. The fix is not to change the overall system. It is to stop trading the VWAP Reversal setup (or investigate why it underperforms) and focus on the breakout. This single filter could turn a breakeven month into a $2,000 gain.
Filter 2: By Time of Day
The Day & Time report in TradeZella breaks down performance by hour. You can plot up to three metrics side by side (Net P&L, Trade Count, Avg Hold Time) as bar or line charts to see exactly when you trade best.
Example: Trades taken between 9:30 and 10:30 AM have a PF of 1.9. Trades taken between 2:00 and 3:30 PM have a PF of 0.6. Most of the afternoon trades are tagged "Boredom" or "Revenge." The data says: stop trading after lunch. That is not a strategy problem. That is an overtrading problem that shows up only when you filter by time.
Filter 3: By Day of Week
Some traders are consistently profitable Monday through Wednesday and lose money Thursday and Friday. Others perform best on Fridays when markets compress. The Day & Time report also breaks down by day of week so you can see if specific days are costing you money.
What to do: If one day consistently shows negative expectancy over 30 or more trades, either reduce size on that day or investigate why. Often it is fatigue (Friday), overexcitement (Monday open), or economic calendar events that disrupt your setups.
Filter 4: By Ticker (Symbol)
The Symbol report in TradeZella ranks every instrument you trade by P&L, win rate, trade count, and more. This reveals whether you have an edge in specific names or if certain tickers consistently hurt you.
Example: You trade 8 stocks regularly. Six are profitable. Two (high-volatility meme stocks) lose money consistently because the spreads are wider and the price action is less predictable. Remove those two tickers from your watchlist and your aggregate PF jumps from 1.2 to 1.6.
Filter 5: By Holding Time (Trade Duration)
The Trade Duration Performance widget on your dashboard shows how long you hold trades and how those durations correlate with results. For scalping strategies ideal holds might be 2 to 15 minutes. For swing trades, 2 to 5 days.
What to look for: Are your winners held longer than your losers (good: you are letting winners run) or shorter (bad: you are cutting winners early and holding losers hoping they recover)? If your average winning hold time is 4 minutes but your average losing hold time is 12 minutes, you are doing the opposite of what works.
How Do You Build a Weekly Review Process?
The metrics and filters above are useless if you only look at them when something goes wrong. The traders who improve fastest run a structured weekly review, every week, whether they had a good week or a bad one. For the complete review framework, see our trade review process guide. Here is the 30-minute version focused specifically on performance analysis.
Step 1: Check Your Dashboard (5 minutes)
Open TradeZella and look at five numbers for the week: Net P&L, Trade Win %, Profit Factor, Trade Expectancy, and Max Drawdown. These are your vital signs. Compare them to the previous week and to your 30-day average. Are they improving, stable, or declining?
Also check your Zella Score, which combines essential metrics into a single performance score. It gives you a quick sense of overall trajectory without digging into individual numbers.
Step 2: Filter by Strategy (10 minutes)
Pull the Strategy report and compare each setup's PF and win rate for the week. Ask: did every strategy contribute positively? If one strategy lost money, was it a small sample (2 to 3 trades, normal variance) or a consistent pattern (10 or more trades, possible problem)?
In TradeZella, you can select any Strategy and instantly see its P&L, win rate, profit factor, average win/loss, and trade count. If a strategy is consistently underperforming over 30 or more trades, it might be time to either retire it or backtest modifications before trading it again live.
Step 3: Check Time, Day, and Symbol Filters (10 minutes)
Run the Day & Time report for the week. Any hours or days that consistently lose money? Check the Symbol report for any new tickers that underperformed. Check the Tags report: how many trades were tagged "Rules Followed" versus "Rules Broken"? What is your Rule Adherence Score for the week?
The Tags report in TradeZella shows performance filtered by any custom tag you have created. This is where you track trading habits quantitatively. If "FOMO Entry" tags have a win rate of 20 percent compared to 55 percent for "A+ Setup" tags, you have a clear, data-backed case for patience.
Step 4: Write One Action Item (5 minutes)
Based on Steps 1 through 3, write one specific change for next week. Not three changes. Not five. One. Examples:
"Stop trading after 11:00 AM. My afternoon trades lost $380 this week with a PF of 0.4."
"Only take Opening Range Breakout setups. VWAP Reversals have lost money 3 weeks in a row."
"Reduce risk to $250 per trade until my drawdown recovers to under 3 percent. Use the position size calculator to set the new size."
"Tag every trade for emotional state this week. I do not have enough data on when I am trading from FOMO versus plan."
Write this action in TradeZella's Notebook so it is attached to the week's data. Next week, check if you followed through. This is how you build a trading system that improves over time: one data-driven iteration per week.
What Are the Most Common Performance Analysis Mistakes?
Mistake 1: Analyzing Too Few Trades
Ten trades is not enough data for any conclusion. Twenty is barely enough. You need at least 30 to 50 trades before metrics become statistically meaningful. If you are making strategy decisions based on a 5-trade sample, you are reacting to randomness, not data.
Fix: Set a minimum threshold. Do not evaluate a Strategy until it has 30 or more trades. Do not change a rule based on a week with fewer than 15 trades. Let the data accumulate before acting on it.
Mistake 2: Ignoring the Filter Dimensions
Looking only at aggregate metrics is like a doctor checking only your temperature. You might have a fever of 100.2 (slightly elevated) while one organ is failing and the rest are fine. Aggregate PF of 1.1 might hide a 1.8 PF strategy and a 0.5 PF strategy. Without filtering, you will never see this.
Fix: Every weekly review should include at least Strategy and Time of Day filters. These two dimensions alone catch most hidden problems.
Mistake 3: Changing Too Many Variables at Once
After a bad week, some traders rebuild everything: new strategy, new risk rules, new time filters, new tickers. Then when next week improves, they have no idea which change helped. Or when it gets worse, they have no idea which change hurt.
Fix: One change per week. Track it. Measure for 20 trades. Then decide if it helped. This matches the iterative process in our trading plan guide: treat each adjustment as a hypothesis and test it with data.
Mistake 4: Confusing Execution Problems with Strategy Problems
Your strategy might be fine. Your execution might be the issue. If your backtest shows a PF of 1.6 but your live results show 0.9, the gap is not the strategy. It is how you are trading it. Check your Rule Adherence Score. If it is below 70 percent, the problem is discipline, not the setup.
Fix: Compare your live metrics to your backtest or forward test results. If the strategy metrics are solid but your live execution degrades them, the fix is behavioral: better pre-trade checklists, stricter daily loss limits, or managing your losing streaks with a protocol instead of emotion.
Which Dashboard View Should You Use?
TradeZella offers seven dashboard views, and choosing the right one matters for your analysis:
Dollars View (default): Best for understanding actual P&L impact. Use for weekly reviews and overall performance check-ins.
R-Multiple View: Best for evaluating trade quality regardless of position size. Use when comparing setups or when you vary your risk per trade.
Percentage View: Best for comparing performance across different account sizes or time periods.
Ticks/Pips/Points Views: Best for futures and forex traders who think in contract-native terms rather than dollars.
Privacy View: Hides dollar amounts. Useful when sharing your screen or reviewing in a public space.
The R-Multiple View is the most underused. If you are only ever looking at dollars, you are missing the normalized quality of your trades. Switch to R-Multiple View at least once per weekly review to see your edge in standardized terms.
Prop Firm Performance Analysis: If you trade prop firm accounts, add two extra metrics to your weekly review: daily drawdown versus your firm's limit, and consistency score (whether your best day exceeds a certain percentage of total profit). TradeZella's Challenge widget tracks your progress against prop firm rules, and the Prop Firm Sync feature consolidates multiple accounts into one view.
Key Takeaways
Five metrics, measured together. Win rate, profit factor, expectancy, max drawdown, and average R-multiple. No single metric tells the full story. Together, they tell you whether you have an edge and whether you can sustain it.
Five filters reveal the real insights. Strategy, time of day, day of week, ticker, and holding time. Your aggregate PF of 1.1 might hide a 1.8 setup and a 0.5 setup. Filtering shows you exactly what to keep and what to cut.
Weekly review, 30 minutes. Dashboard check (5 min), Strategy filter (10 min), time/day/symbol/tags (10 min), one action item (5 min). Consistency matters more than depth.
One change per week. Test it over 20 trades. Then review again. Multiple changes at once make results uninterpretable.
Separate strategy problems from execution problems. Compare live metrics to backtest. If the gap is large and your Rule Adherence Score is low, the strategy is not the issue.
Use R-Multiple View. It normalizes performance across different position sizes and reveals the true quality of your entries and exits.
How many trades do I need before I can analyze my performance?
At least 30 trades for any meaningful conclusion about a single metric. For Strategy-level filtering, 30 or more trades per setup. For time-of-day filtering, you need enough trades in each time slot to form a pattern, which usually means 2 to 3 months of trading data. Making decisions based on fewer than 20 trades is reacting to random noise, not identifying an edge.
What is the most important metric to track?
Profit factor is the best single metric because it combines win rate and average win-to-loss ratio into one number. A profit factor above 1.3 over 50 or more trades means your strategy is net profitable with a meaningful margin. However, no single metric tells the complete story. Profit factor does not account for drawdown, and a high profit factor with extreme drawdowns may still be untradeable. Track all five together.
How often should I review my performance?
Weekly, at minimum. A 30-minute review every weekend is the standard for active day traders. Do not review after every single trade because you will overreact to individual results. Do not wait a full month because problems compound. Weekly strikes the right balance between having enough data and catching issues early.
What if my backtest results are much better than my live results?
Check your Rule Adherence Score first. If it is below 75 percent, the problem is execution, not strategy. You are likely entering off-plan trades, moving stops, exiting early, or sizing incorrectly. If adherence is above 85 percent and live results are still significantly worse, the backtest may have been overfitted to historical data, or market conditions may have changed since the backtest period.
Can I analyze performance with a spreadsheet?
You can calculate the five core metrics manually. The limitation is filtering. A spreadsheet cannot easily show you profit factor by time of day, win rate by Strategy, or R-multiple by ticker without complex pivot tables and formulas that break at scale. If you take more than 5 trades per day, a dedicated tracker with built-in filtering saves hours per week and eliminates manual calculation errors.
What is the Zella Score in TradeZella?
The Zella Score is a composite metric that combines multiple essential performance indicators into a single number. It provides a quick overall assessment of your trading performance without requiring you to evaluate each metric individually. Think of it as a GPA for your trading: it aggregates profitability, consistency, and risk management into one score that trends over time.
Should I track the same metrics for swing trading and day trading?
The five core metrics apply to both styles. The filtering dimensions shift: day traders benefit most from time-of-day and trade duration filters, while swing traders benefit more from day-of-week and holding time analysis. The weekly review cadence stays the same, but swing traders may need to extend the sample period to 4 to 6 weeks to accumulate enough trades per filter for meaningful analysis.