How to Create a Trading Plan That You'll Actually Follow
How to Create a Trading Plan That You'll Actually Follow
About 90% of trading plans get written once and never opened again because they're too long, too vague, or never tested with real data. This guide gives you a one-page framework with six sections that covers everything from setups and risk rules to post-loss protocol, then shows you how to turn that plan into a trackable system your journal can actually measure.
class SampleComponent extends React.Component {
  // using the experimental public class field syntax below. We can also attach
  // the contextType to the current class
  static contextType = ColorContext;
  render() {
    return <Button color={this.color} />
  }
}
Last Updated: April 15th, 2026
A trading plan is a written set of rules that defines what you trade, when you trade, how you enter and exit, how much you risk, what you do after a loss, and how you review your performance. A good trading plan removes decision-making from live trading so you're executing a system instead of reacting to price. Traders who follow a documented plan consistently outperform those who trade on instinct because the plan turns emotional decisions into repeatable processes that can be measured and improved.
About 90% of trading plans get written once and never opened again. They're 15-page documents full of lofty goals and vague rules that sound great on a Sunday night but fall apart at 9:31 AM on Monday. The problem isn't the trader's commitment. It's the plan itself.
A practical trading plan fits on one page and covers six things: what you trade and when, your setups, your entry and exit rules, your risk rules, what you do after a loss, and how you review. If your plan can't be summarized in those six sections, it's too complicated to follow under pressure. You can download the Trading Plan Template on our tools page as a starting point, then customize each section with your own rules.
Why Do Most Trading Plans Fail?
They're too vague. "I will follow my strategy and manage risk appropriately" is not a plan. It's a wish. A real plan says "I will risk 1% of my account per trade, which on a $50,000 account means my maximum loss per trade is $500." That's specific enough to verify. The vague version lets you rationalize any decision in the moment.
They're too complex. A 20-page plan with 15 rules creates decision paralysis. When you're watching a setup form at 9:45 AM, you don't have time to flip through a document. The best plans have 3 setups or fewer. Each setup has clear entry rules, a defined stop, and a target. That's it. If you can't hold your entire plan in your head during a live session, it's too long.
They never get tested. Most traders rewrite their plan after every losing week, never accumulating enough data to know whether it works. A plan needs at least 50 trades of data before you can judge whether a setup has edge. Rewriting after 8 trades is not adapting. It's guessing. Your trading expectancy only becomes meaningful with a real sample size.
What Are the 6 Sections of a One-Page Trading Plan?
Section 1: What I Trade and When
Markets: US equities (NYSE and NASDAQ listed stocks priced between $10 and $200, with average daily volume above 1 million shares).
Trading hours: 9:30 AM to 11:30 AM Eastern, Monday through Friday. No trading during the first 2 minutes after open.
No-trade days: FOMC announcement days, first 30 minutes after major economic data releases.
This section eliminates 90% of the decisions you'd otherwise make during the day. If it's 11:35 AM, you're done. If it's FOMC day, you don't open your platform. There's no judgment call involved, which is the point. Scalping strategies might narrow this window even further to just the first 30 minutes, while swing trading strategies might widen it to end-of-day only. The window depends on your style, but having one is non-negotiable.
Section 2: My Setups (Max 3 to Start)
Setup 1: Opening Range Breakout. Stock gaps up or down at least 0.5% from previous close. Price consolidates within a defined range during the first 15 minutes. Entry on breakout above range high (longs) or below range low (shorts) with volume confirmation.
Setup 2: VWAP Pullback. Stock trends in one direction, pulls back to VWAP, and bounces. Entry on the first green candle after the VWAP touch, with at least 2:1 reward-to-risk.
Notice both setups are specific enough that another trader could look at the same chart and agree on whether the setup triggered. That's the test. If your setup description includes words like "looks strong" or "feels right," it's not a setup. It's a feeling. Every setup in your plan should be verifiable, which is also what makes it backtestable.
Section 3: Entry and Exit Rules for Each Setup
Entry: Buy/short when price breaks the 15-minute opening range with a volume surge. Enter within the first candle close beyond the range.
Stop loss: Place stop at the opposite side of the opening range.
Target: First target at 1.5R (take 50% off). Trail remaining position. Close everything at 11:00 AM.
Writing exit rules is harder than writing entry rules because exits require you to decide in advance what you'll do when you're in profit and don't want to leave money on the table. That's exactly why you write them now, before the trade is live. A trader without exit rules is a trader who holds too long on winners and too long on losers.
Section 4: Risk Rules
Per-trade risk: Maximum 1% of account equity. On a $50,000 account, that's $500 maximum loss per trade. Use a position size calculator to convert that dollar risk into the correct number of shares or contracts based on your stop distance.
Daily loss limit: 3%. If I hit this, I shut down. On a $50,000 account, that's $1,500. Three full-risk losers in a row hits this limit. This rule exists to prevent a bad morning from becoming a blown week. Your daily risk rules are the guardrails that keep a drawdown manageable.
Weekly loss limit: 5%. If I hit this, I review before Monday. This connects directly to your drawdown management protocol. A 5% weekly loss is your Tier 2 threshold, the point where you reduce size and slow down instead of trying to dig out.
Position sizing: Never more than 2 positions open simultaneously.
Section 5: What I Do After a Loss
After 1 loss: Normal. Continue.
After 2 consecutive losses: Mandatory 15-minute break. Review both trades in journal.
After hitting daily loss limit: Shut down immediately. Tag each trade. Write a one-paragraph reflection.
This section is the most underrated part of any trading plan. Without a post-loss protocol, losses trigger an emotional chain: the first loss creates frustration, the second creates urgency to recover, and the third becomes a revenge trade with oversized risk. FOMO kicks in because you feel like you're falling behind. Overtrading follows because doing nothing feels worse than losing more. Your post-loss rules break that chain before it starts.
Section 6: How I Review
Daily review (5 minutes): Tag every trade. Note emotional state. Record Rule Adherence Score. The Rule Adherence Score is simple: did you follow every rule in your plan for this trade? Yes = 1. No = 0. After a month, your average score tells you whether your problem is the plan or your execution of it.
Weekly review (30 minutes): Compare rules-followed versus rules-broken performance. Check win rate by setup.
Monthly review (1 hour): Full performance review by setup, time of day, and conditions. This is where you look at profit factor per setup, your R-multiple distribution, and whether your plan-following trades outperform your plan-breaking trades. If they do (and they almost always do), you have data proving your plan works and your deviations cost money. That's the most powerful feedback loop in trading.
Your review process is what turns a static document into a living system. The plan tells you what to do. The review tells you whether you did it, and whether it worked.
How Do You Turn Your Plan Into a Trackable System?
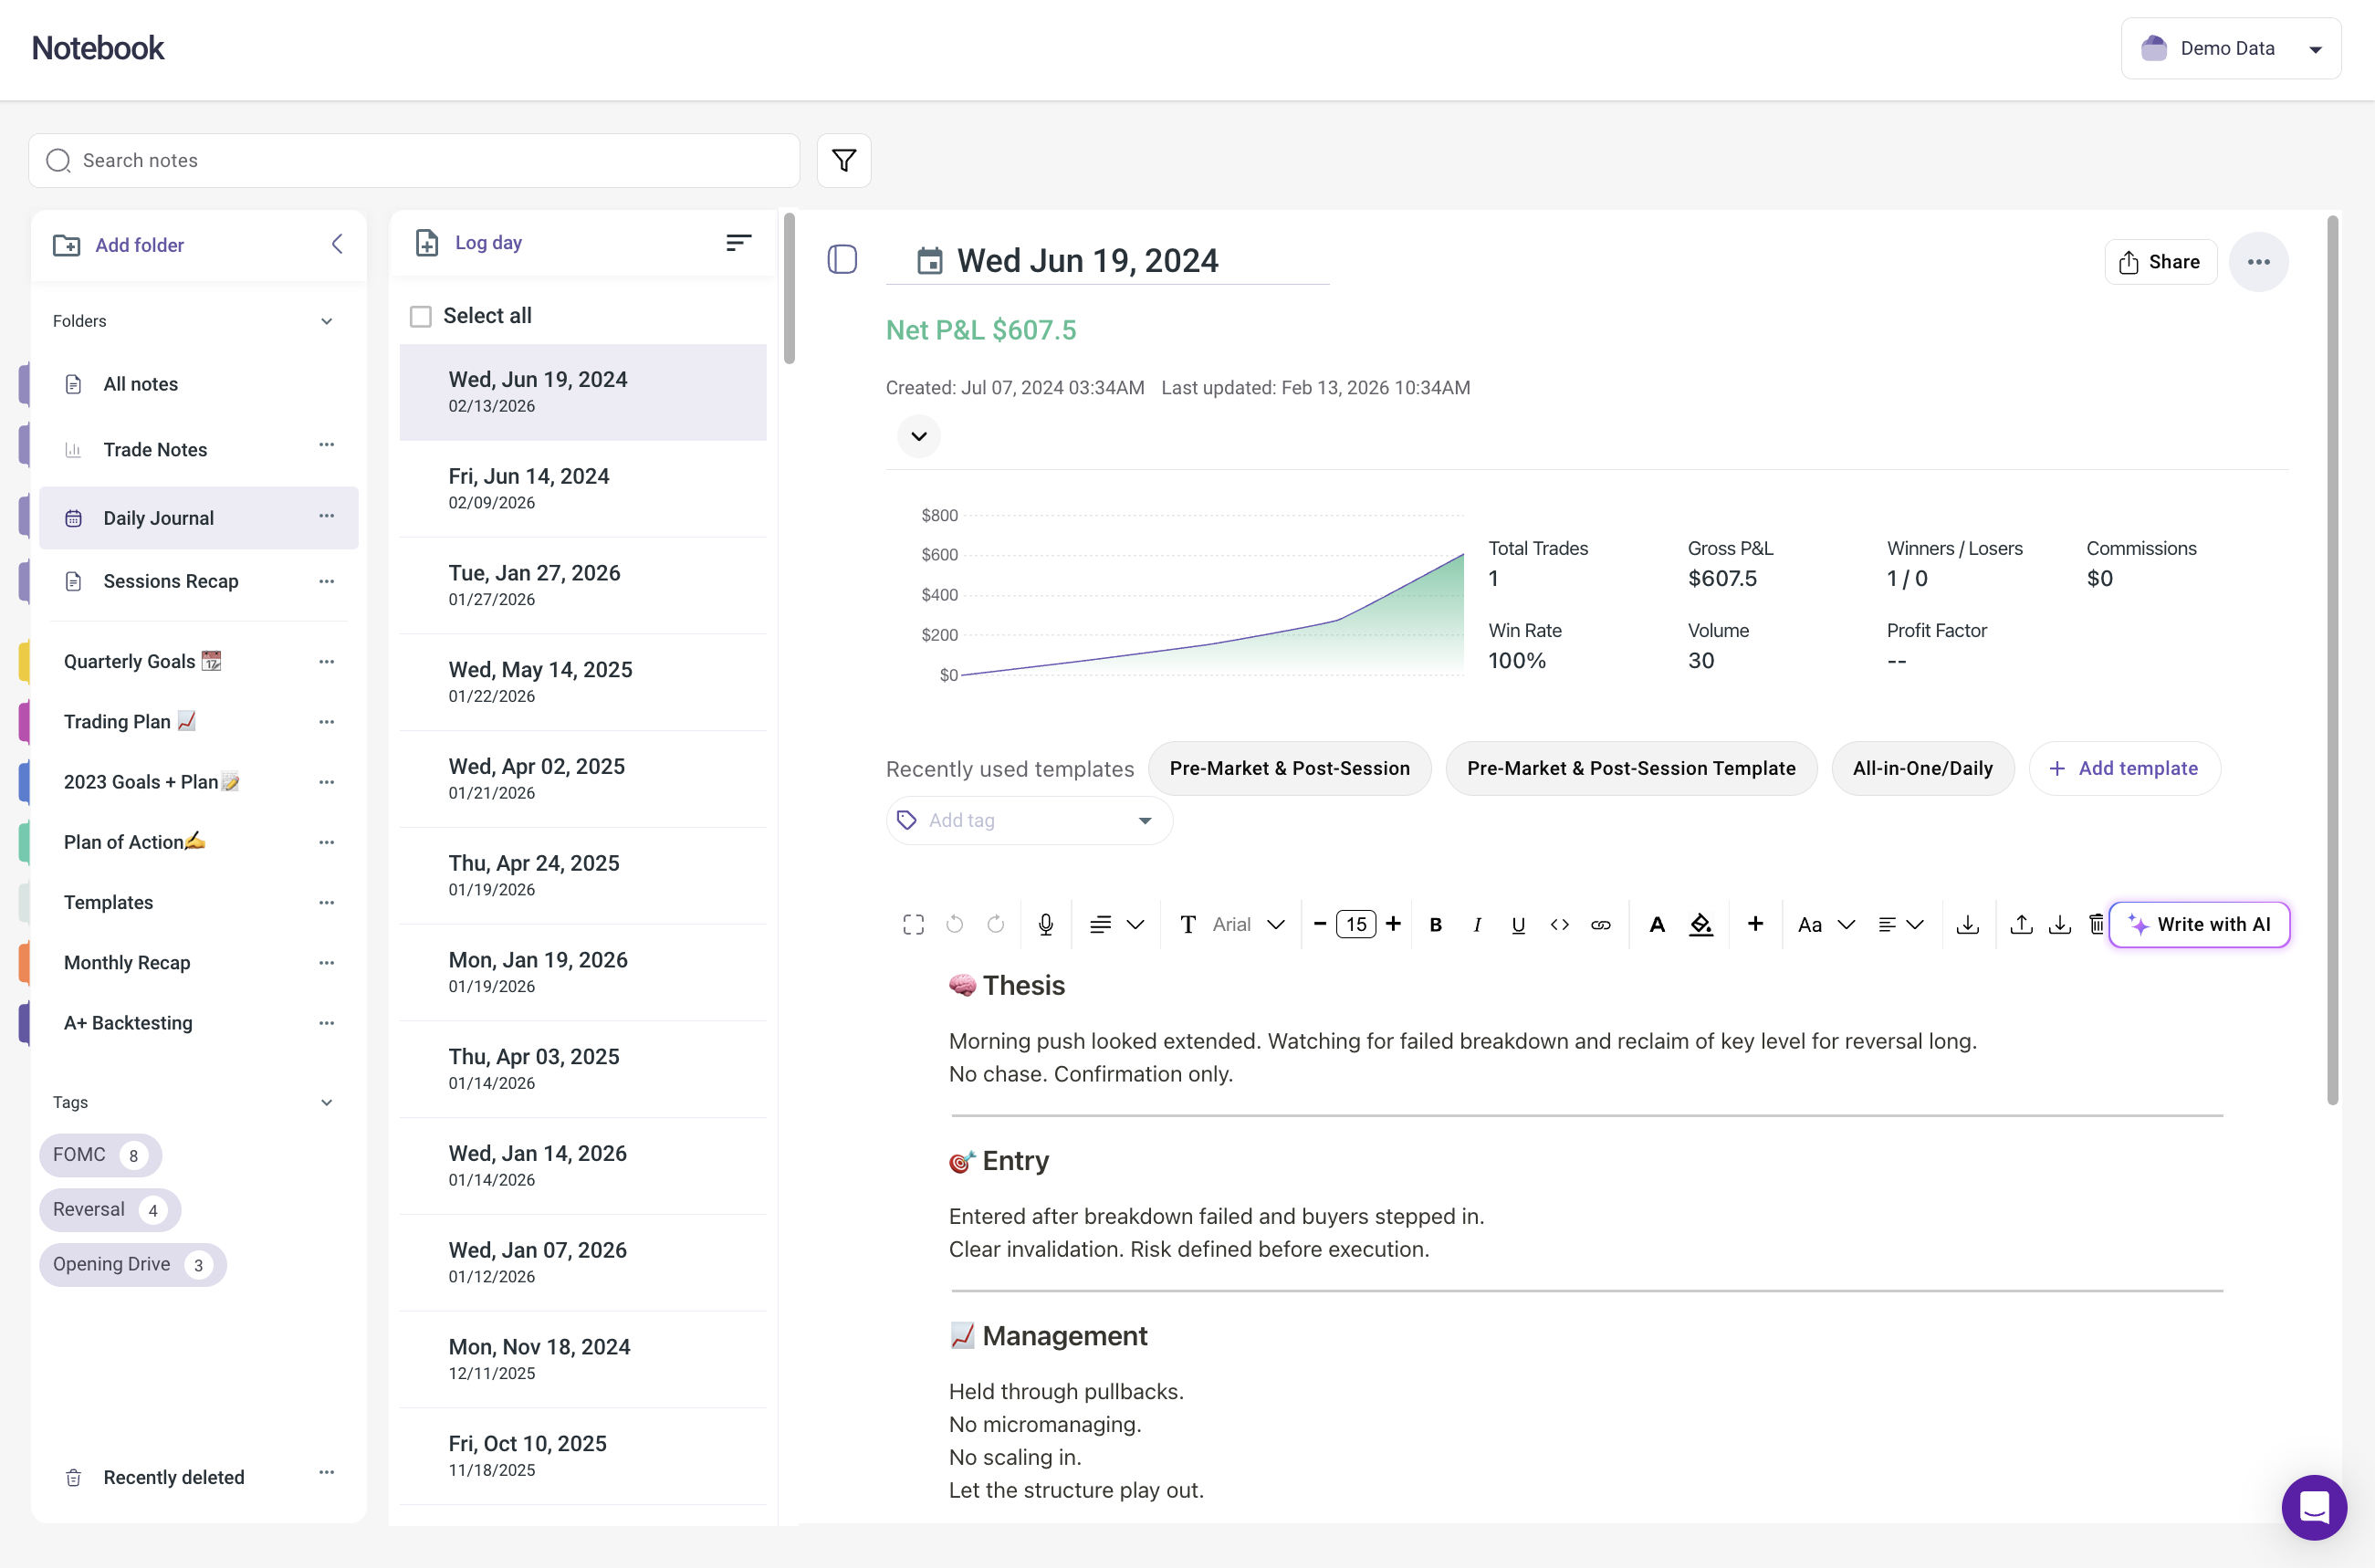
In TradeZella, Strategies translate your plan into trackable, measurable units. Each Strategy represents one setup. You define the entry criteria, exit rules, and risk parameters, and every trade gets assigned to one.
What to do: Create a Strategy for each setup in your plan. When you log trades, assign each one to its Strategy. After 30 trades, your Strategy analytics tell you whether each setup is producing an edge. This is where the plan stops being a document and starts being a dataset. A plan you can measure is a plan you can improve.
TradeZella Strategies Report
How Do You Use Your Journal to Validate the Plan?
Your trading plan is a hypothesis. Your journal data is the experiment.
In TradeZella, your analytics dashboard lets you filter by Strategy, date range, time of day, and custom tags. After 50+ trades, you can answer: Is my setup profitable? Is it better in the morning or afternoon? Does it work better on gap days? Tracking your habits alongside your plan rules shows you exactly where discipline breaks down. Maybe your plan works, but your execution at 11:00 AM doesn't.
What to do: After your first 30 trades, run a full analysis by Strategy. Compare each setup's performance against expectations. If your ORB Strategy shows a 55% win rate and 1.6 profit factor, your plan is working. If your VWAP Pullback Strategy shows a 38% win rate and 0.9 profit factor, you have data to investigate. It's not time to delete the setup yet, but it is time to look at which conditions it loses in.
If you're not using a dedicated journal yet and want to start simple, the free trading journal template gives you a structure to log trades against your plan. Once you outgrow it, a tool like TradeZella automates the tracking so you spend your time reviewing instead of entering data. The journal versus spreadsheet comparison breaks down where manual tracking stops scaling.
When Should You Change Your Trading Plan?
Don't change after a losing streak of fewer than 15 trades.
Don't change based on one bad day.
Do change when you have 50+ trades showing a setup with profit factor below 0.8.
Do change when market conditions fundamentally shift. But document the change in your journal.
In TradeZella, the Notebook is ideal for documenting plan changes.
What to do: Before making any change, write out the change, the reason, and the data supporting it. If you can't point to specific data, don't make the change yet. This prevents the most common plan failure: rewriting rules based on emotion after a losing day instead of evidence over a meaningful sample.
How futures traders should adapt this plan: If you trade futures, your plan needs additional sections for contract specifications and session windows. The ES morning session and the overnight session are effectively different markets. A futures trading journal captures these differences automatically so your plan review accounts for session-specific performance.
How Do You Backtest Your Trading Plan Before Going Live?
Before risking real capital on a new plan, test it. Take your setups, entry rules, and exit rules and run them against historical data. If your Opening Range Breakout setup produces negative expectancy over 200 backtested trades, you know before you lose a dollar live.
Backtesting your strategies is the fastest way to validate whether your plan has edge. It doesn't replace live testing, because backtests assume perfect execution and zero psychology. But it eliminates setups that have no historical basis, which saves you weeks of live losses.
The loop works like this: backtest your setups to confirm historical edge, trade them live with your plan rules, log every trade in your journal, and compare your live results to the backtest. If they match, your plan and execution are aligned. If they don't, your journal data shows where the gap is.
What Does a Complete One-Page Trading Plan Look Like?
Markets: US equities ($10-$200, 1M+ avg volume). Hours: 9:30-11:30 AM ET.
Setups: (1) Opening Range Breakout with volume confirmation. (2) VWAP Pullback with 2:1 R minimum.
Entry/Exit: ORB: enter on range breakout, stop at opposite range, target 1.5R. VWAP PB: enter on bounce candle, stop below VWAP, target 2R+.
Risk: 1% per trade. $500 max loss on a $50K account. 3% daily limit. 5% weekly limit. Max 2 open positions.
After a loss: 1 loss = normal. 2 losses = 15-min break. Daily limit = shut down and journal.
Review: Daily tag and score. Weekly analytics comparison. Monthly full review.
Section
What It Covers
Why It Matters
Most Common Mistake
1. Markets & Hours
Which instruments you trade, your session window, and no-trade days
Eliminates 90% of daily decisions before the market opens
Leaving hours open-ended ("I'll trade when I see something")
2. Setups (Max 3)
Specific, verifiable entry criteria for each setup you trade
Makes your plan backtestable and gives your journal data clear categories
Describing setups with subjective language ("looks strong")
3. Entry & Exit Rules
Exact entry trigger, stop placement, and target levels for each setup
Removes emotion from live execution. You already decided what to do.
Writing entry rules but skipping exit rules (then holding too long)
4. Risk Rules
Per-trade risk %, daily loss limit, weekly loss limit, max open positions
Keeps a bad day from becoming a bad month. Protects your capital.
Setting limits but not enforcing them ("just one more trade")
5. Post-Loss Protocol
What you do after 1 loss, 2 consecutive losses, and hitting your daily limit
Breaks the loss-revenge-overtrade chain before it starts
Not having one at all (most traders skip this section entirely)
Turns a static document into a living system backed by data
Logging trades but never reviewing them (building a database nobody reads)
Key Takeaways
A good trading plan fits on one page and covers 6 sections: markets/hours, setups, entry/exit rules, risk rules, post-loss protocol, and review process.
Keep it specific enough that another trader could verify whether any given trade followed your plan.
Start with a maximum of 3 setups. Add more only after data confirms which ones work.
Translate your plan into journal Strategies so your data can test the hypothesis.
Don't change your plan after a short losing streak. Wait for 50+ trades of data.
Simple plans get followed. Complex plans get ignored.
Frequently Asked Questions
How detailed should a trading plan be?
Detailed enough that entry and exit rules are unambiguous, but simple enough to fit on one page. Each rule should be testable and specific. For example, "risk 1% per trade with a stop at the opposite side of the 15-minute opening range" is a good rule. "Manage risk appropriately" is not. If another trader could read your plan and take the same trades you would, it's detailed enough.
Do I need a different trading plan for each market?
Yes, if the setups, hours, or risk profiles differ. A stock day trading plan and a futures scalping plan have different instruments, different session windows, and different position sizing math. Create separate one-page plans for each market or timeframe you trade. Trying to combine everything into one plan creates the complexity that causes plans to fail.
How often should I update my trading plan?
Review monthly. Update only when you have 50 or more trades of data showing a rule or setup is not working. Document every update with the change, the reason, and the supporting data. If you find yourself rewriting your plan every week, you're reacting to short-term noise instead of long-term patterns.
What is the biggest mistake people make with trading plans?
Making them too complicated and then abandoning them entirely. A simple plan with three setups and clear risk rules that you follow every day beats a detailed 20-page plan that you ignore after the first losing week. The second most common mistake is changing the plan too early, before collecting enough trades to know whether it works.
Can I use a template or do I need to build from scratch?
Use the six-section framework as structure, then customize with your specifics. Your setups, hours, and risk tolerance must be yours. A template gives you the format. You fill in the rules based on your market, your strategy, and your account size. The Trading Plan Template on the TradeZella tools page is a good starting point.
How do I know if my trading plan is working?
Track every trade in a journal and assign each one to a Strategy. After 50 or more trades, look at your win rate, profit factor, and expectancy per Strategy. If your plan-following trades are profitable and your plan-breaking trades are not, your plan works and your job is to improve execution. If both are losing, the plan needs changes backed by data, not guesses.
Should I include psychology rules in my trading plan?
Yes. Section 5, the post-loss protocol, is a psychology rule. It tells you exactly what to do after consecutive losses so you do not make emotional decisions. Other useful psychology rules include a maximum number of trades per day, a mandatory break after hitting your daily loss limit, and a rule against trading during the first two minutes of market open when volatility is highest and FOMO is strongest.