Backtest Any Trading Strategy: Results in Seconds, Not Months
Backtest Any Trading Strategy: Results in Seconds, Not Months
Most traders spend months manually backtesting strategies, or give up before reaching a meaningful sample size. This guide shows how to write plain English rules and test any strategy across years of historical data in seconds, with every individual trade visible and full analytics on the results.
class SampleComponent extends React.Component {
  // using the experimental public class field syntax below. We can also attach
  // the contextType to the current class
  static contextType = ColorContext;
  render() {
    return <Button color={this.color} />
  }
}
Last Updated: June 24, 2026
Backtesting a trading strategy means running your entry and exit rules against historical market data to see how they would have performed before you risk real capital. The goal is statistical proof: does this strategy make money over a large enough sample of trades, or does it just feel like it should? TradeZella automated backtesting lets you write rules in plain English and test them across years of stock, futures, and forex data in seconds, with every individual trade visible and full analytics on the results.
Most traders know backtesting matters. Fewer actually do it. The reason is simple: traditional backtesting is slow, tedious, and often requires coding skills most discretionary traders do not have. Manual bar replay takes 2 to 4 hours for 50 trades. Learning Pine Script or Python takes weeks before you can run a single test. The result is that most traders skip backtesting entirely and trade strategies they have never validated with data.
This guide covers how to backtest any trading strategy, across any asset class, in seconds instead of months. Whether you trade scalping strategies on ES futures, swing trading strategies on stocks, or gap and go setups on small caps, the process is the same: define your rules, choose your data, and let the engine do the work. For a broader comparison of platforms, read our best backtesting software guide.
What Does It Mean to Backtest a Trading Strategy?
Backtesting is running a set of trading rules against historical price data to measure how those rules would have performed. You define your entry conditions, exit conditions, and risk parameters, then the backtesting engine applies them trade by trade across months or years of market data. The output is a complete trade log with metrics like win rate, profit factor, trading expectancy, maximum drawdown, and R-multiple distribution.
The point is not to predict the future. Markets change. A strategy that worked in 2023 might struggle in 2026. The point is to answer a narrower question: does this strategy have a statistical edge under the conditions I tested? If it does, you have something worth trading live. If it does not, you saved yourself weeks or months of losses by finding out with historical data instead of real money.
For a deeper conceptual walkthrough of what backtesting is and why it matters, read our backtesting trading strategies guide. For a complete explanation of what is automated backtesting and how it differs from manual testing, that guide covers the fundamentals.
Why Does Traditional Backtesting Take Most Traders So Long?
There are four common ways traders backtest, and three of them are painfully slow.
Manual bar replay means scrolling through historical charts one candle at a time, making entry and exit decisions as if you were trading live. It builds execution skill, but 50 trades can take 2 to 4 hours depending on the timeframe. Most traders need 100 or more trades for statistical confidence, which means 8 to 16 hours of screen time for a single strategy on a single instrument. If the results are mediocre, you start over with a new variation. Months can pass before you validate anything.
Coding (Pine Script, Python, NinjaScript, MQL5) is powerful but has a steep learning curve. A trader who has never written code needs 20 to 40 hours of learning before they can build, debug, and run their first backtest. Even experienced coders spend 1 to 4 hours per strategy iteration dealing with syntax, data formatting, and edge cases. The output is precise, but the time cost locks out most discretionary traders.
Spreadsheet analysis means exporting your past trades and filtering them manually. It is not true backtesting because you are only analyzing trades you already took, not testing rules against trades you might have taken. Sample sizes are limited to your actual trading history, and there is no way to test variations without going back and trading them live.
Plain English automated backtesting is the fastest method. You write rules in natural language, choose your instrument and timeframe, and the engine runs them across years of data in seconds. No coding. No candle-by-candle scrolling. Every individual trade is visible, and you can analyze results immediately. For a full comparison of these approaches, read manual vs automated backtesting.
How Can You Backtest Any Strategy in Seconds?
TradeZella automated backtesting replaces coding and manual replay with plain English rules. You describe your strategy the way you would explain it to another trader, and the engine translates it into executable logic.
The process works in six steps:
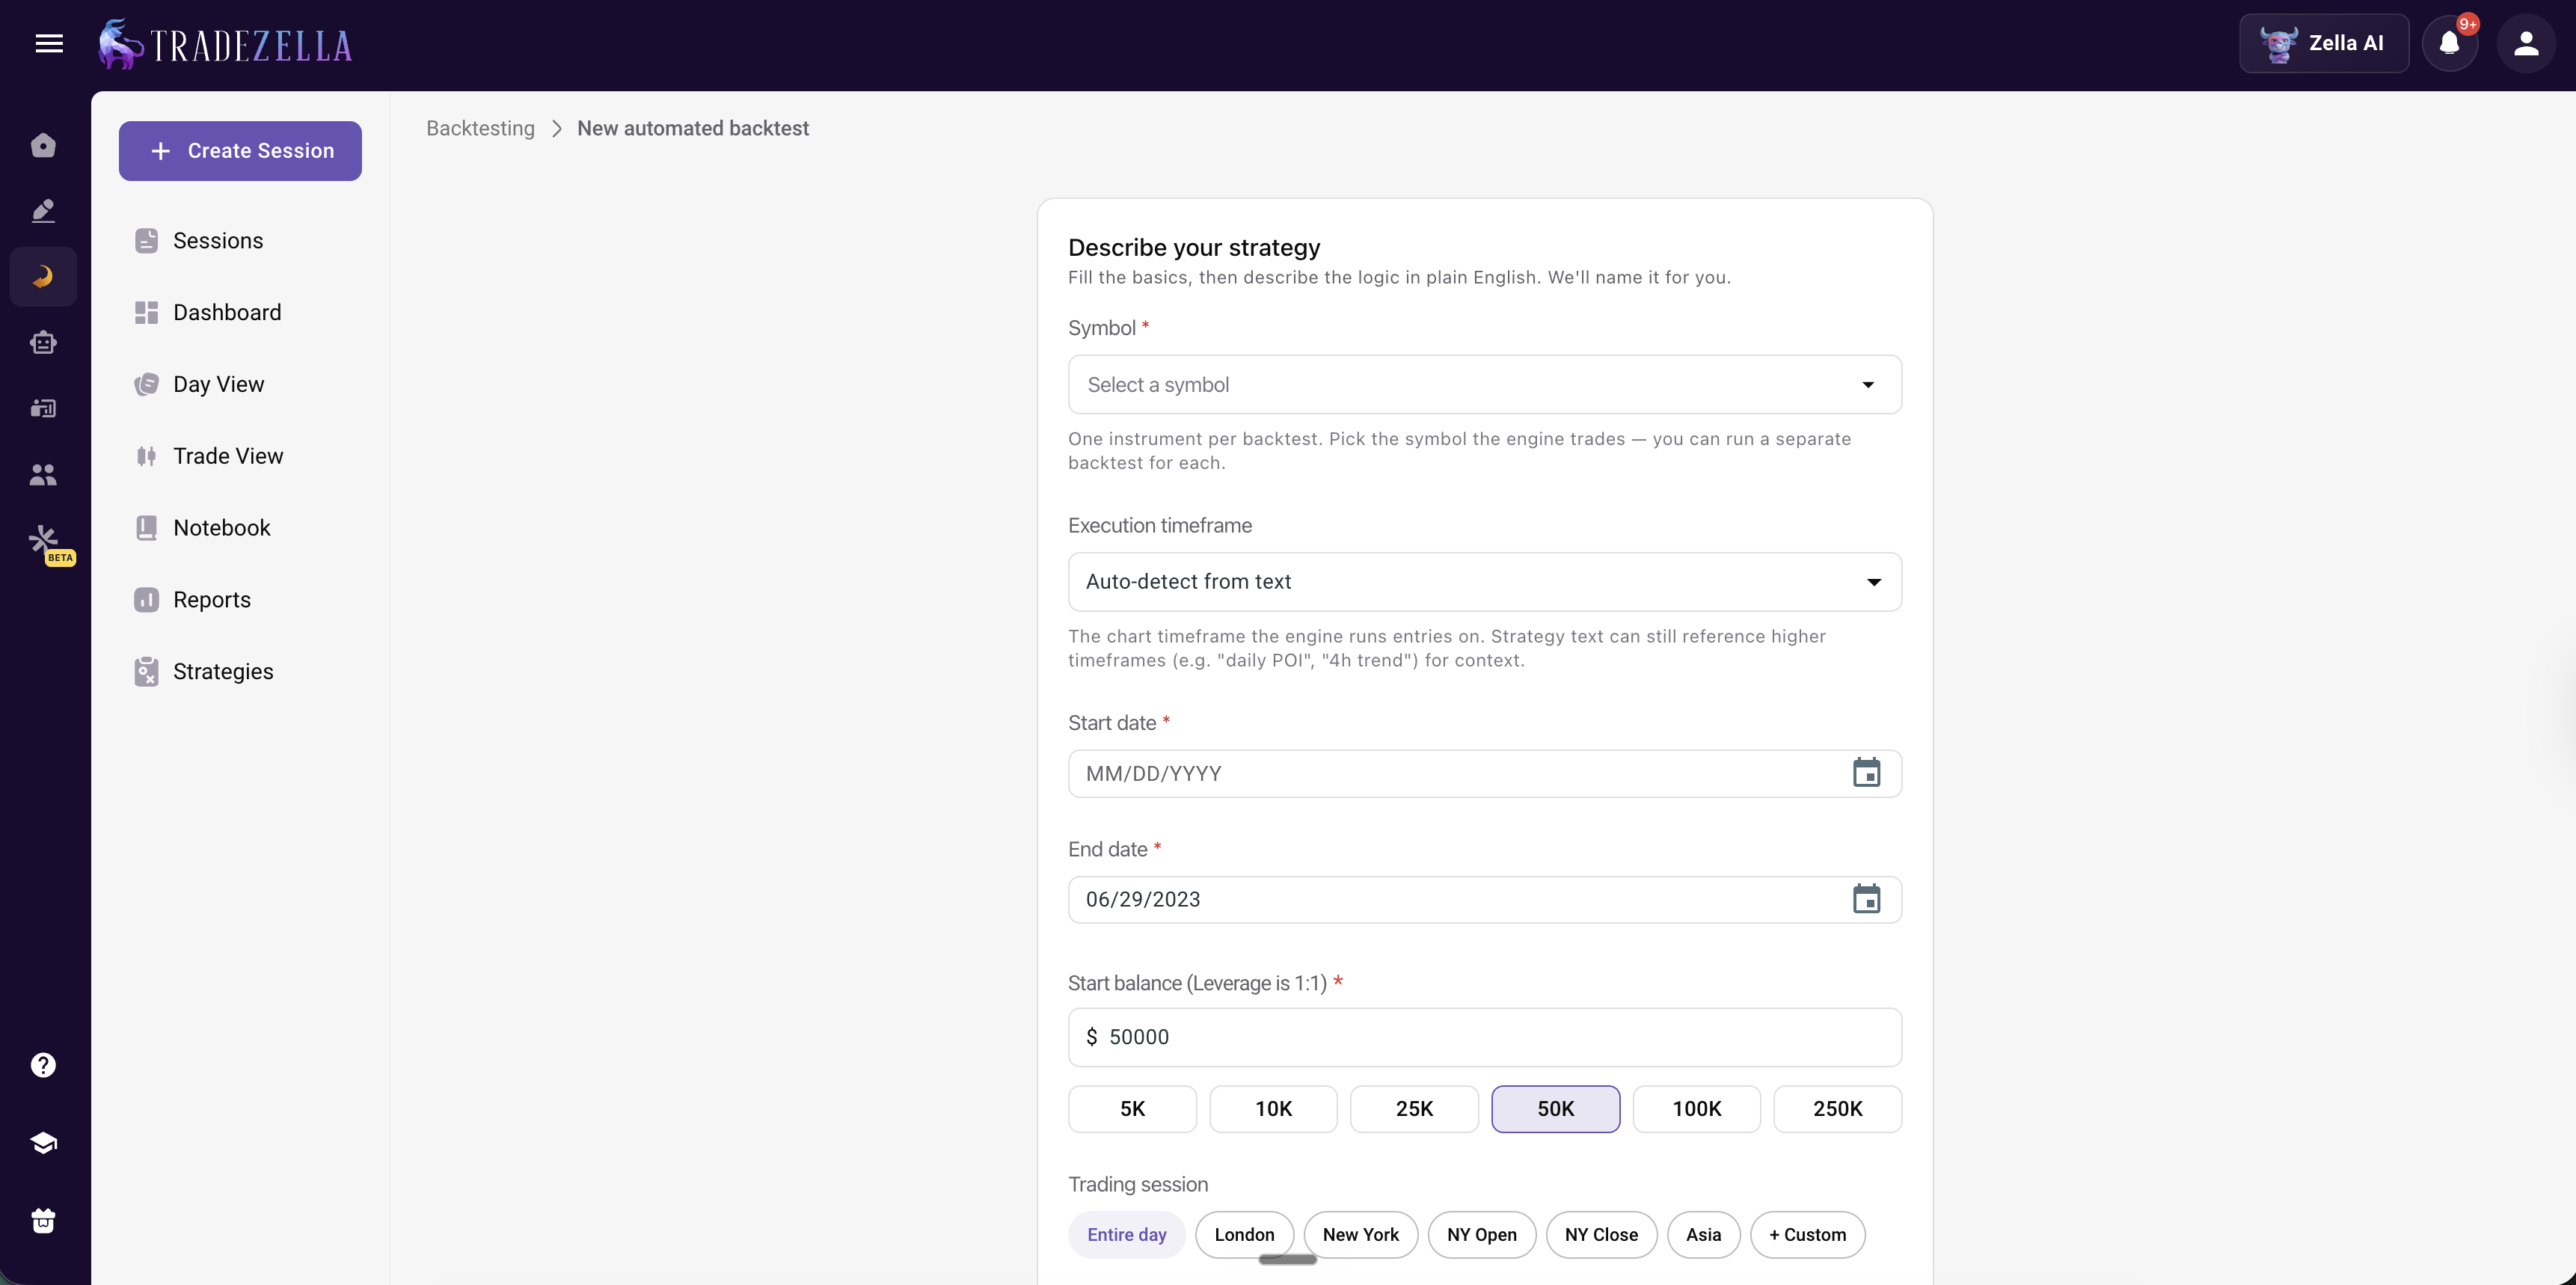
Step 1: Choose your instrument. Pick any stock, futures contract, or forex pair from TradeZella's historical data library. One symbol per backtest keeps results clean and focused.
Step 2: Set your timeframe. Select the chart timeframe that matches your strategy. A scalping strategies setup on the 1-minute chart produces different results than the same logic on a 15-minute chart. TradeZella supports timeframes from seconds to daily.
TradeZella Automated Backtesting
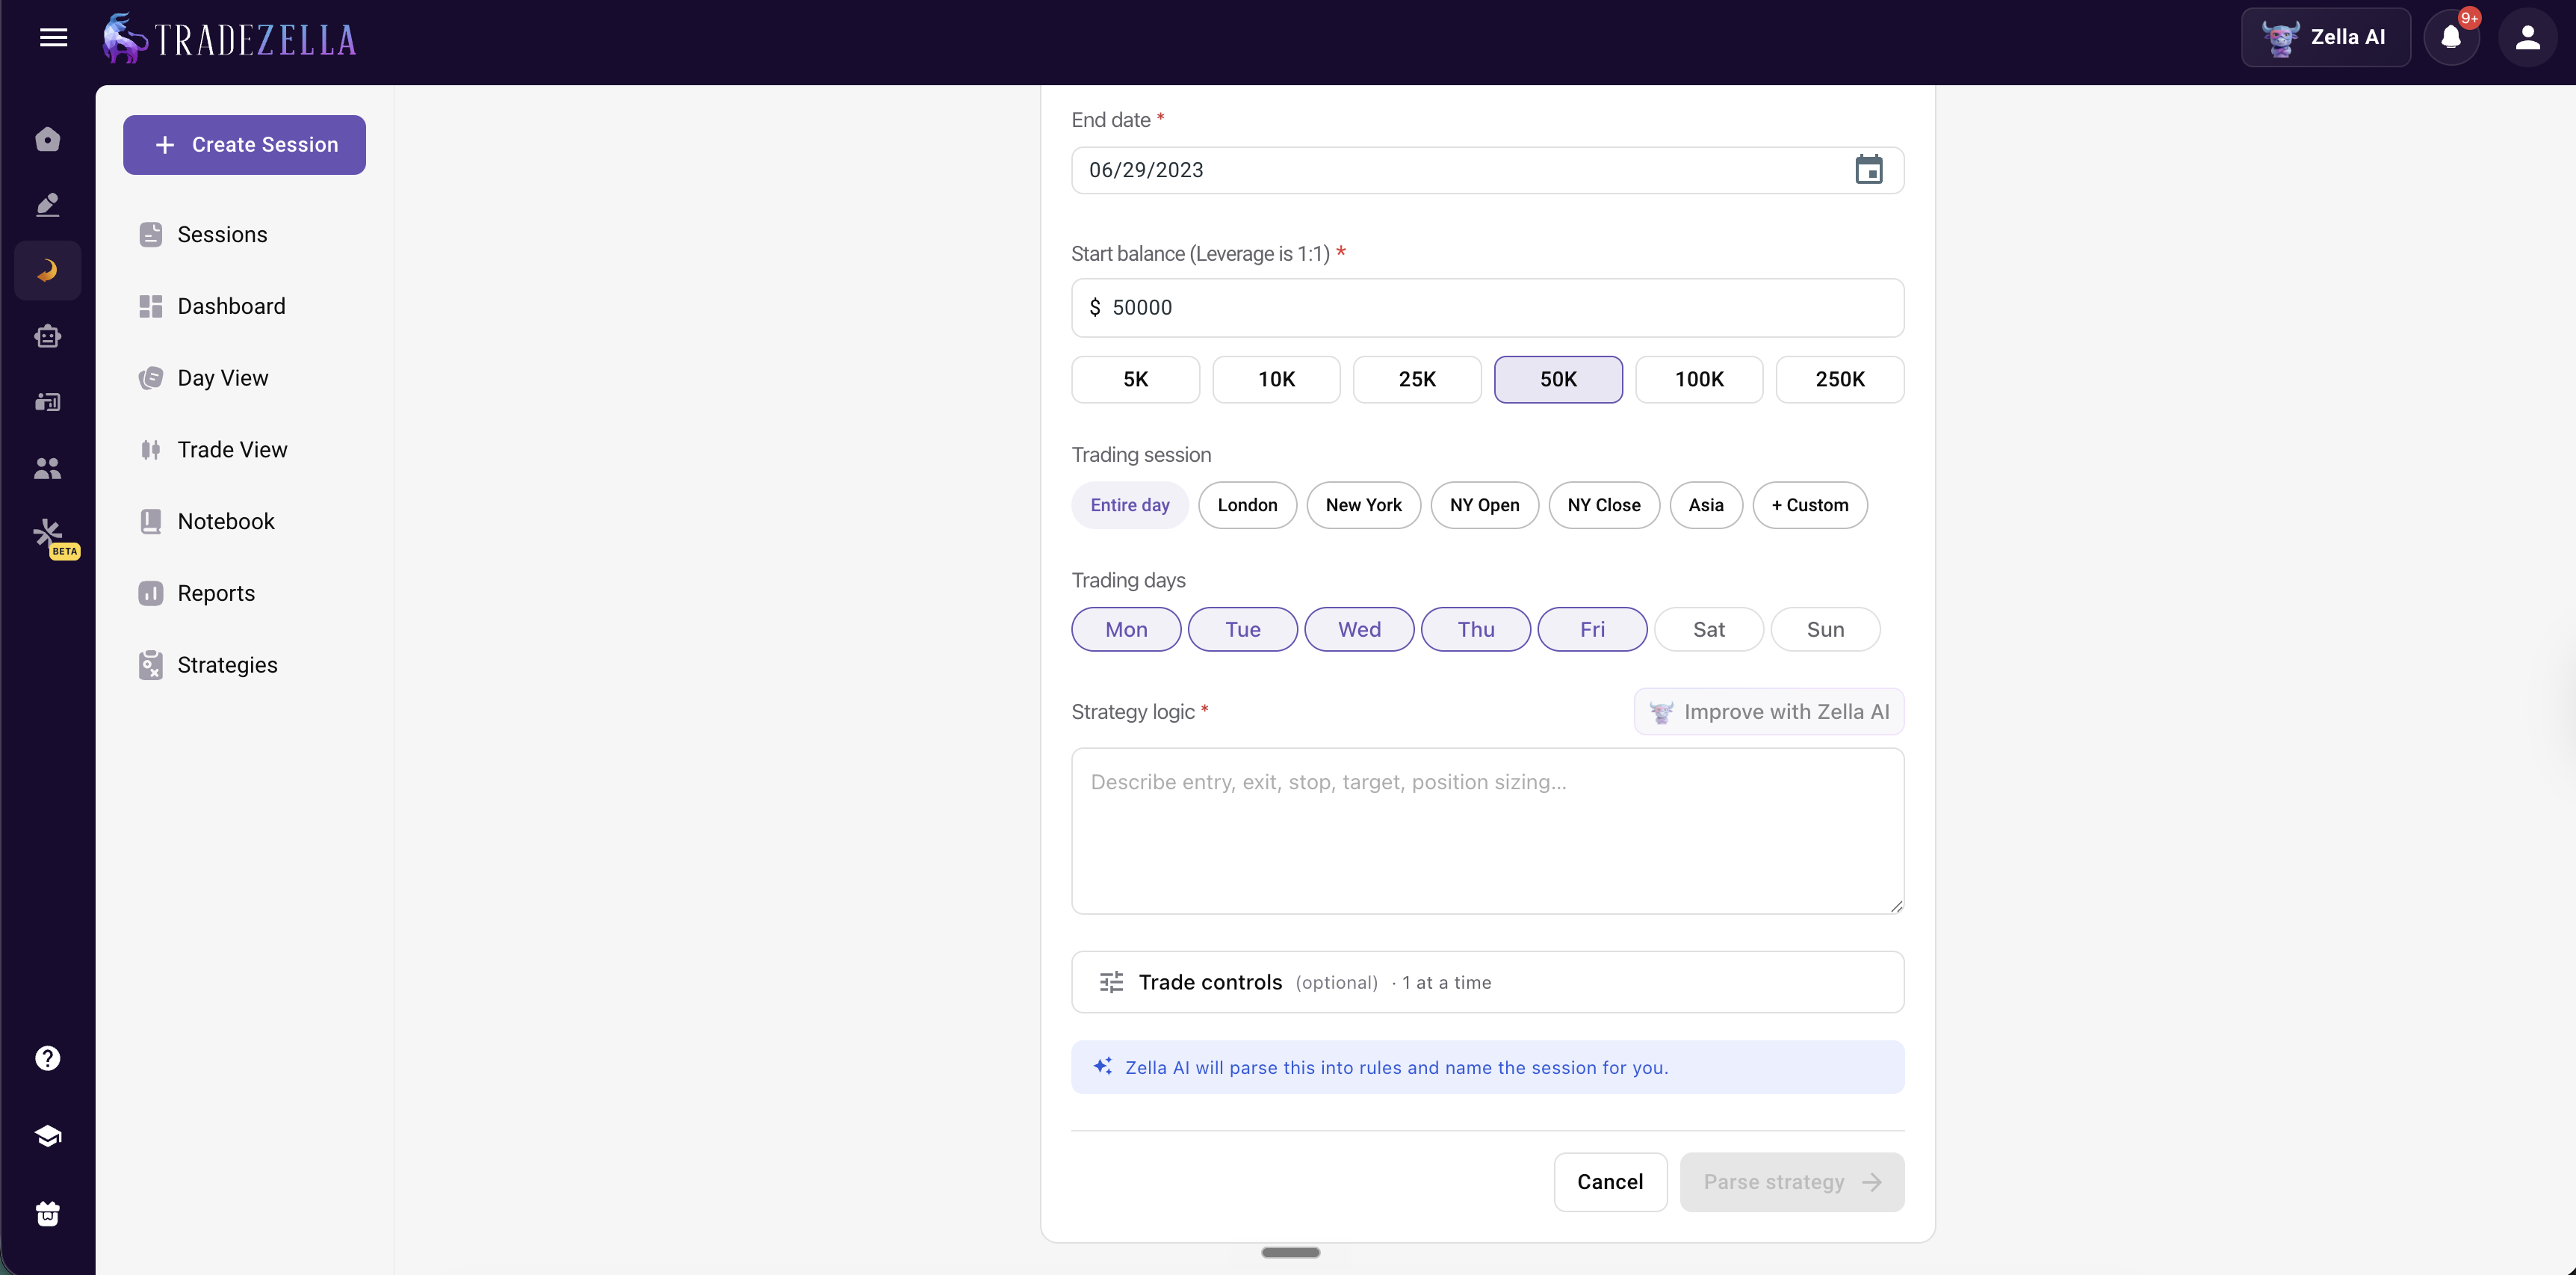
Step 3: Define entry conditions. Write your entry rules in plain English. Examples: "Buy when price crosses above the 20 EMA and RSI is below 70" or "Sell short when price breaks below the opening range low after 9:45 AM." You can stack multiple conditions using AND/OR logic.
Step 4: Define exit conditions. Set your take profit, stop loss strategies, and any time-based exits. Example: "Take profit at 2R. Stop loss at the low of the entry candle. Close any open position at 3:55 PM."
Step 5: Set risk parameters. Define your position size or risk per trade. On a $50,000 account risking 1% per trade, that is $500 per trade. Use the Position Size Calculator to verify your sizing before running the test.
TradeZella Automated Backtestign
Step 6: Run the backtest. Click run. The engine applies your rules across years of historical data and generates a complete trade log in seconds. Every entry, every exit, every win, every loss. No hidden trades, no summary-only output.
TradeZella also offers pre-built templates for common strategies: ICT setups (FVG, liquidity sweeps, breaker blocks), opening range breakout, trend following, and mean reversion. You can start from a template and customize the rules to match your style.
What Types of Strategies Can You Actually Backtest?
The short answer: any strategy that can be defined with rules. If you can describe when you enter, where you place your stop, and where you take profit, you can backtest it. Here are the most common strategy types traders test.
Trend Following
Moving average crossovers, breakouts above resistance, higher highs and higher lows. Example rule: "Buy when the 20 EMA crosses above the 50 EMA on the 15-minute chart. Stop at the most recent swing low. Target 2R." Trend following strategies typically produce lower win rates (40 to 50%) with larger average winners. The key metric to watch is profit factor, which should be above 1.3 after 100 trades.
Mean Reversion
Oversold bounces, Bollinger Band snaps, VWAP reversion trades. Example rule: "Buy when RSI drops below 30 and price is within 0.5% of the lower Bollinger Band. Target the 20-period moving average. Stop 1 ATR below entry." Mean reversion strategies tend to have higher win rates (55 to 65%) with smaller average wins. Watch your risk-reward ratio to make sure the math works at your actual win rate.
ICT and Smart Money Concepts
Fair value gaps, liquidity sweeps, breaker blocks, order blocks. Example rule: "Buy at a bullish FVG after a liquidity sweep below the previous session low. Stop below the FVG. Target the next liquidity pool above." TradeZella's backtesting includes ICT-specific indicators, so you can test these concepts with the same precision as traditional technical setups.
Opening Range Breakout
First 5, 15, or 30-minute range breakouts. Example rule: "Buy when price breaks above the first 15-minute high on ES futures. Stop at the first 15-minute low. Target 2R." This is one of the most testable strategies because the rules are mechanical and time-based. For a complete guide to this setup, read our gap and go strategy article, which covers a related approach.
Chart Pattern Strategies
Bull flags, ascending triangles, head and shoulders, double bottoms. If you can define the pattern entry with measurable criteria (price, volume, timeframe), you can test it. For example: "Buy when price breaks above the upper trendline of an ascending triangle on above-average volume. Stop at the most recent swing low inside the triangle. Target the measured move." For a full list of testable patterns, read trading patterns.
Scalping Setups
VWAP bounces, order flow trades, 1-minute momentum entries. Scalping strategies require the most trades for statistical validation because individual wins and losses are small. Plan for at least 100 backtested trades before drawing conclusions. Detailed scalping approaches are covered in our scalping strategies guide.
Swing Trading Setups
Pullbacks to moving averages on the daily chart, weekly breakouts, sector rotation entries. Swing strategies need fewer trades per month but larger sample windows (6 to 12 months of data minimum). See our full swing trading strategies guide for specific setups worth testing.
Asset-Specific Strategies
Different asset classes have different backtesting considerations. Forex strategies need session-specific testing (London, New York, Asian) and spread cost accounting. Read forex backtesting for the full breakdown. Stock strategies need sector filters, earnings date awareness, and pre-market/after-hours handling. Our backtesting stocks guide covers those specifics.
How Do You Write Plain English Backtesting Rules?
Writing backtesting rules is easier than most traders expect. You are not writing code. You are describing what you already do when you trade.
Start with three questions:
1. When do I enter? What specific conditions need to be true on the chart before you take the trade? Be precise. "The market looks bullish" is not a rule. "Price crosses above the 9 EMA while the 9 EMA is above the 21 EMA on the 5-minute chart" is a rule.
2. When do I exit? Where is your stop loss? Where is your profit target? Do you have a time-based exit (close before the session ends)? A complete exit plan has at least two components: a stop and a target. The more specific, the better.
3. How much do I risk? On a $50,000 account with 1% risk, you are risking $500 per trade. The distance between your entry and your stop determines your position size. If your stop is 10 points away on ES futures ($12.50 per point), you can trade 4 contracts. $500 / ($12.50 x 10) = 4 contracts.
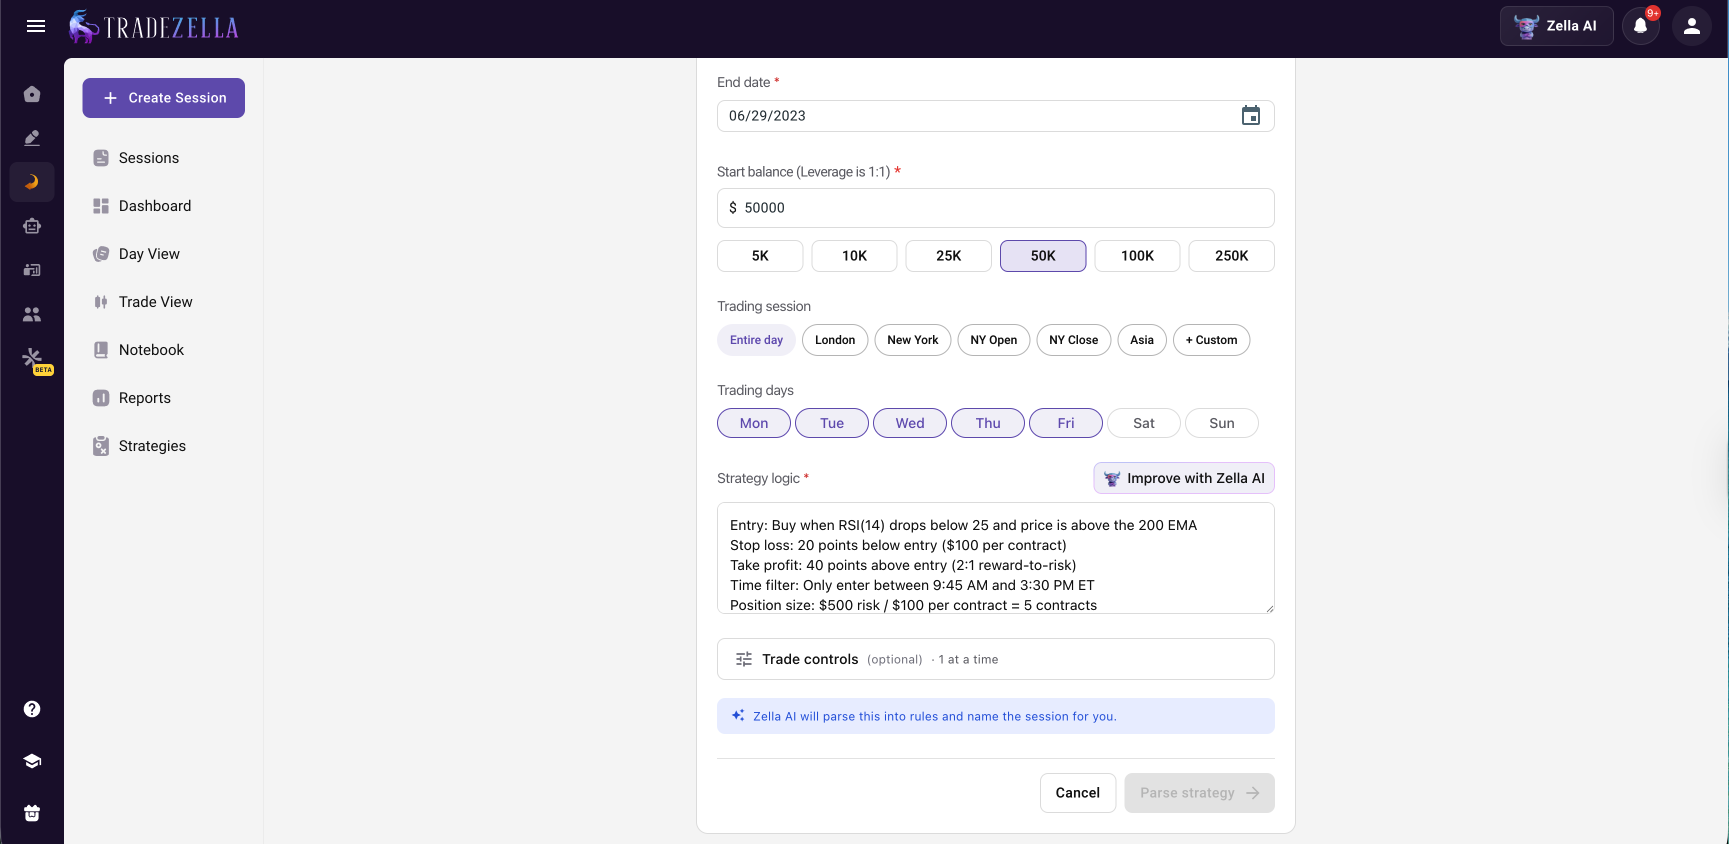
Here is a complete example for an NQ futures mean reversion strategy:
Instrument: NQ (Nasdaq 100 E-mini futures) Timeframe: 5-minute chart Entry: Buy when RSI(14) drops below 25 and price is above the 200 EMA Stop loss: 20 points below entry ($100 per contract) Take profit: 40 points above entry (2:1 reward-to-risk) Time filter: Only enter between 9:45 AM and 3:30 PM ET Position size: $500 risk / $100 per contract = 5 contracts
That entire strategy can be entered in plain English in TradeZella's rule builder and tested across years of NQ data in seconds. No coding. No scrolling through thousands of candles.
What Metrics Tell You Whether Your Backtest Passed or Failed?
Running the backtest is the easy part. Interpreting the results is where most traders get tripped up. Here are the five metrics that matter most, with benchmarks for each.
Win Rate is the percentage of trades that were profitable. A 45% win rate is perfectly fine if your average winner is 2x your average loser. A 70% win rate is meaningless if one bad trade wipes out ten winners. Context matters more than the number itself. For the full breakdown, read win rate.
Profit Factor is your gross profits divided by your gross losses. A profit factor of 1.0 means you broke even. Below 1.0 means the strategy lost money. Above 1.3 is the minimum threshold for a tradeable strategy. Above 2.0 is strong. Above 3.0 across 100+ trades is exceptional and worth investigating for overfitting. Full guide: profit factor.
Expectancy tells you how much you expect to make per trade in R-multiples. The formula is: (Win Rate x Average Win) minus (Loss Rate x Average Loss). On a $50,000 account risking $500 per trade, an expectancy of +0.3R means you expect to make $150 per trade on average over a large sample. If your expectancy is negative, the strategy loses money regardless of your win rate. Full guide: trading expectancy.
Maximum Drawdown is the largest peak-to-trough decline during the backtest period. On a $50,000 account, a 15% max drawdown means the account dropped $7,500 from its highest point before recovering. Most traders should target max drawdowns below 20%. Prop firm traders need to stay well below their firm's drawdown limits, often 5 to 10%. For risk management rules on managing drawdowns, read our complete guide.
Sample Size is the number of trades in your backtest. Thirty trades is the bare minimum for any statistical conclusions. Fifty is solid. One hundred or more gives you real confidence. If your strategy only produced 12 trades across two years of data, the sample is too small to trust.
Pass/fail benchmarks: Profit factor above 1.3, positive expectancy, max drawdown below 20% of account, and at least 50 trades. If the backtest hits all four, the strategy is worth taking to the next stage. If it misses on any one, dig into the trade log and figure out why before trading it live.
What Do You Do After a Successful Backtest?
A positive backtest is not permission to trade full size immediately. It is the first checkpoint in a longer validation process.
Stage 1: Review the individual trades. Do not just look at the summary metrics. Scroll through the trade log. Are the entries where you would actually enter? Are the stops realistic, or does the strategy assume you would hold through a 30-point spike against you without flinching? TradeZella's backtesting shows every individual trade so you can evaluate execution quality, not just outcomes.
Stage 2: Practice with replay. Use trade replay to walk through the strategy's historical trades in simulated real time. This builds execution confidence. A strategy might look clean in a trade log but feel uncomfortable at the speed of live markets. Replay bridges that gap. TradeZella offers Trade Replay for individual trades, Day Replay for full sessions, and Scenario Replay for practicing specific setups.
Stage 3: Go live at reduced size. Start at 50% of your target position size. On a $50,000 account where you normally risk $500 per trade, start at $250. Trade the strategy for 20 to 30 trades. Compare your live results to the backtest. If your profit factor is within 15 to 20% of the backtest, the strategy translates to live execution. If live results are significantly worse, investigate whether the gap comes from execution (hesitation, skipped trades) or market conditions that changed since the backtest period.
Stage 4: Graduate to full size. After 20 to 30 trades at 50%, move to 75% for another 20 trades, then 100%. This graduated approach protects your account during the transition from historical data to live markets.
For the complete validation pipeline from backtest to live trading, read backtesting vs forward testing. For building this into a complete trading system with phase gates and pass/fail criteria, read our guide on building a trading system.
Can You Backtest Discretionary Strategies?
This is the most common objection traders raise: "My strategy is discretionary. I read the chart. I cannot write it as rules."
The honest answer is that pure discretion, where every trade is a unique judgment call with no repeatable criteria, cannot be backtested. But most "discretionary" traders are more systematic than they think. They have favorite setups. They trade certain times of day. They avoid certain market conditions. Those patterns are testable.
Start by identifying the mechanical components of your strategy. If you trade pullbacks to the 21 EMA during the New York session on trending days, the entry (pullback to 21 EMA), the time filter (9:30 AM to 12:00 PM), and the trend filter (price above 50 EMA) are all rule-based. The "discretionary" part might be how you read the candle at the EMA, which is a smaller component than you think.
Backtest the mechanical components first. If the mechanical rules alone produce a positive expectancy, you have a validated edge. The discretionary overlay, reading the candle, checking order flow, gauging momentum, is refinement on top of a proven base.
For a complete framework on backtesting discretionary and semi-discretionary strategies using journal data, replay, and holdout splits, read backtest without code.
How Does Zella AI Help You Interpret Backtest Results?
Pattern detection. Zella AI can identify time-of-day clusters where your strategy performs best or worst, drawdown sequences that repeat under specific market conditions, and periods where the strategy's edge decays.
Optimization suggestions. Based on your results, Zella AI can suggest rule adjustments: tighter stops during volatile sessions, different targets during trending versus ranging markets, or time filters that eliminate the weakest trades.
Backtest-to-live comparison. Once you start trading the strategy live, Zella AI's agents go to work. The Auto Trade Tagger applies your custom tags to every trade automatically. The Session Review agent compares your morning plan against your actual results. Over time, Zella AI builds a memory of your trading patterns, preferences, and risk limits that compounds with every session.
The combination of automated backtesting for validation and Zella AI for ongoing analysis creates a workflow where every strategy gets tested before it touches real capital, and every live trade gets reviewed after the session ends.
Key Takeaways
Backtesting validates your strategy before you risk real money. If you cannot define your rules and test them against data, you are gambling on intuition.
Traditional backtesting is slow. Manual replay takes hours per strategy. Coding takes weeks to learn. Plain English automated backtesting takes seconds.
Any rule-based strategy can be tested. Trend following, mean reversion, ICT setups, opening range breakouts, chart patterns, and any other strategy with definable entry and exit criteria.
Five metrics determine pass or fail. Profit factor above 1.3, positive expectancy, maximum drawdown below 20%, sample size of 50+ trades, and consistent performance across time periods.
Overfitting is the biggest risk. Keep rules simple, test out-of-sample, validate across time periods, and be suspicious of results that look too good.
A passing backtest is not permission to go full size. Review individual trades, practice with replay, then graduate from 50% to 75% to 100% position size over 40 to 60 live trades.
Even discretionary traders can backtest. Identify the mechanical components of your strategy, test those rules first, then add discretionary refinement on top of a proven base.
Frequently Asked Questions
How do you backtest a trading strategy?
Define your entry conditions, exit conditions, and risk parameters as specific rules. Then run those rules against historical market data to see how they would have performed over dozens or hundreds of trades. TradeZella lets you write these rules in plain English and test them across years of stock, futures, and forex data in seconds.
How many trades do you need for a valid backtest?
Thirty trades is the bare minimum for any statistical conclusions. Fifty trades gives you a solid foundation. One hundred or more trades provides real confidence in the results. If your backtest only generated 10 to 15 trades, the sample size is too small to trust and you should either extend the data range or test on additional instruments.
Can you backtest any strategy, including discretionary ones?
Any strategy with definable rules can be backtested. Most discretionary traders have mechanical components in their approach, such as specific setups, time-of-day filters, or trend conditions, that can be isolated and tested. Backtest the mechanical components first, then use replay to practice the discretionary overlay.
Do you need to know how to code to backtest?
No. TradeZella's automated backtesting uses plain English rules instead of code. You describe your strategy the same way you would explain it to another trader, and the engine translates it into executable logic. Pre-built templates are also available for common strategies like ICT setups, opening range breakouts, trend following, and mean reversion.
How accurate is backtesting?
Backtesting shows how a strategy would have performed on historical data, not how it will perform in the future. Results are accurate for the data tested, but live trading introduces execution variables like slippage, emotional pressure, and changing market conditions. Expect live results within 15 to 20 percent of backtest results for a well-validated strategy.
How long does it take to backtest a strategy?
With plain English automated backtesting, the actual test runs in seconds. Writing the rules takes 5 to 15 minutes depending on the complexity of the strategy. The total time from idea to results is under 20 minutes for most strategies, compared to 8 to 16 hours for manual bar replay or 20 to 40 hours of learning for coding-based approaches.
Can you backtest stocks, futures, and forex on the same platform?
Yes. TradeZella supports backtesting across stocks, futures, and forex with 11 or more years of historical data. You run one instrument per backtest to keep results clean, but you can test the same strategy across multiple instruments to check whether the edge is durable or instrument-specific.