How to Build a Trading System from Scratch (The Data-Driven Way)
How to Build a Trading System from Scratch (The Data-Driven Way)
Most trading system guides stop at backtesting. But backtesting is only phase 3 of a 7-phase process. This guide walks through every phase, from forming a testable hypothesis to live execution and iteration, with specific metrics, red flags, and TradeZella analytics at each step.
class SampleComponent extends React.Component {
  // using the experimental public class field syntax below. We can also attach
  // the contextType to the current class
  static contextType = ColorContext;
  render() {
    return <Button color={this.color} />
  }
}
Last Updated: April 20th, 2026
A trading system is a complete, rules-based framework for making every trading decision, from entry to exit to position sizing, without relying on gut feeling or in-the-moment judgment. It replaces "I think" and "I feel" with "the data shows." Building a trading system is a 7-phase process: you form a hypothesis, define rules, backtest against historical data, forward test in real time, live test with small capital, evaluate performance across all phases, and iterate based on what the data tells you. Most guides stop at backtesting. But backtesting is only phase 3. The phases after, forward testing, live testing, evaluation, and iteration, are where systems either prove themselves or fall apart.
The problem with most "trading system" advice is that it focuses on the idea (find a setup that works) and skips the validation (prove it works, under real conditions, over enough trades to be statistically meaningful). A backtest that shows a 65% win rate over 200 historical trades is a promising start. But if that same system drops to a 48% win rate when you forward test it in real time, something is wrong, either the backtest was overfit, or you can't execute it under live conditions. You need all 7 phases to find out.
This guide walks through every phase with specific metrics, pass/fail thresholds, red flags, and the exact data you should be tracking at each step.
Phase 1: What Is a Tradeable Hypothesis?
Every system starts with a specific, testable idea about market behavior. Not a vague feeling that "breakouts work" or "I can read price action." A hypothesis that can be tested with data.
Good hypothesis: "Stocks that gap up 3% or more on earnings with above-average pre-market volume tend to continue higher in the first 30 minutes of the session." This is specific. You can code it into a backtest. You can define exact entry and exit criteria around it.
Bad hypothesis: "I can make money by reading price action." This is too vague to test. Two traders could look at the same chart, take opposite trades, and both claim they were "reading price action."
The best hypotheses come from your own trading data. If you've been trading for a while and logging trades in a journal, look at what's already working. Which setups have the highest win rate? Which time periods produce the best results? If you run scalping strategies and your morning trades (9:30 to 11:00 AM) have a 62% win rate while your afternoon trades are at 41%, there's a hypothesis: "My strategy performs best in the first 90 minutes of the session."
If you don't have existing data, start with established market concepts, things like breakout continuation, VWAP reversion, gap fills, or opening range breakouts. These have been studied extensively and give you a known starting point. Just make sure your hypothesis is narrow enough to test with specific rules.
Phase 2: How Do You Define System Rules?
Rules must be specific enough that two people watching the same chart would make the same decision. If there's any ambiguity, the rule isn't finished. Your trading plan provides the overall framework. The system rules are the specific, mechanical criteria within that framework.
Entry Rules
Define every condition that must be true before you enter. Example: "Enter long when: (1) stock gaps 3% or more on earnings, (2) pre-market volume exceeds 2x the 20-day average, (3) price breaks the 5-minute opening range high, (4) breakout candle volume is 1.5x the prior bar." All four conditions must be met. If any one fails, you skip the trade.
Exit Rules
Define three types of exits. Stop loss: "Stop at the opening range low." Profit target: "Take 50% off at 1.5 R-multiple, trail the remaining 50% with a break-even stop." Time exit: "Close everything after 60 minutes regardless of P&L." Having all three prevents you from holding losers too long or giving back winners.
Position Sizing Rules
"Risk 1% of account per trade. Calculate position size based on entry-to-stop distance." On a $50,000 account, 1% risk means $500 maximum loss per trade. If your stop is $2 away from entry, you can trade 250 shares. Use the position size calculator to get exact numbers so there's no guesswork involved. This connects directly to your risk management plan.
No-Trade Conditions
Define when you will NOT trade, even if your entry criteria are met. Examples: "No trades on FOMC announcement days. No trades if daily loss has reached 2% of account. No trades in the first 5 minutes of market open." No-trade rules are just as important as entry rules because they keep you out of environments where your system has no edge.
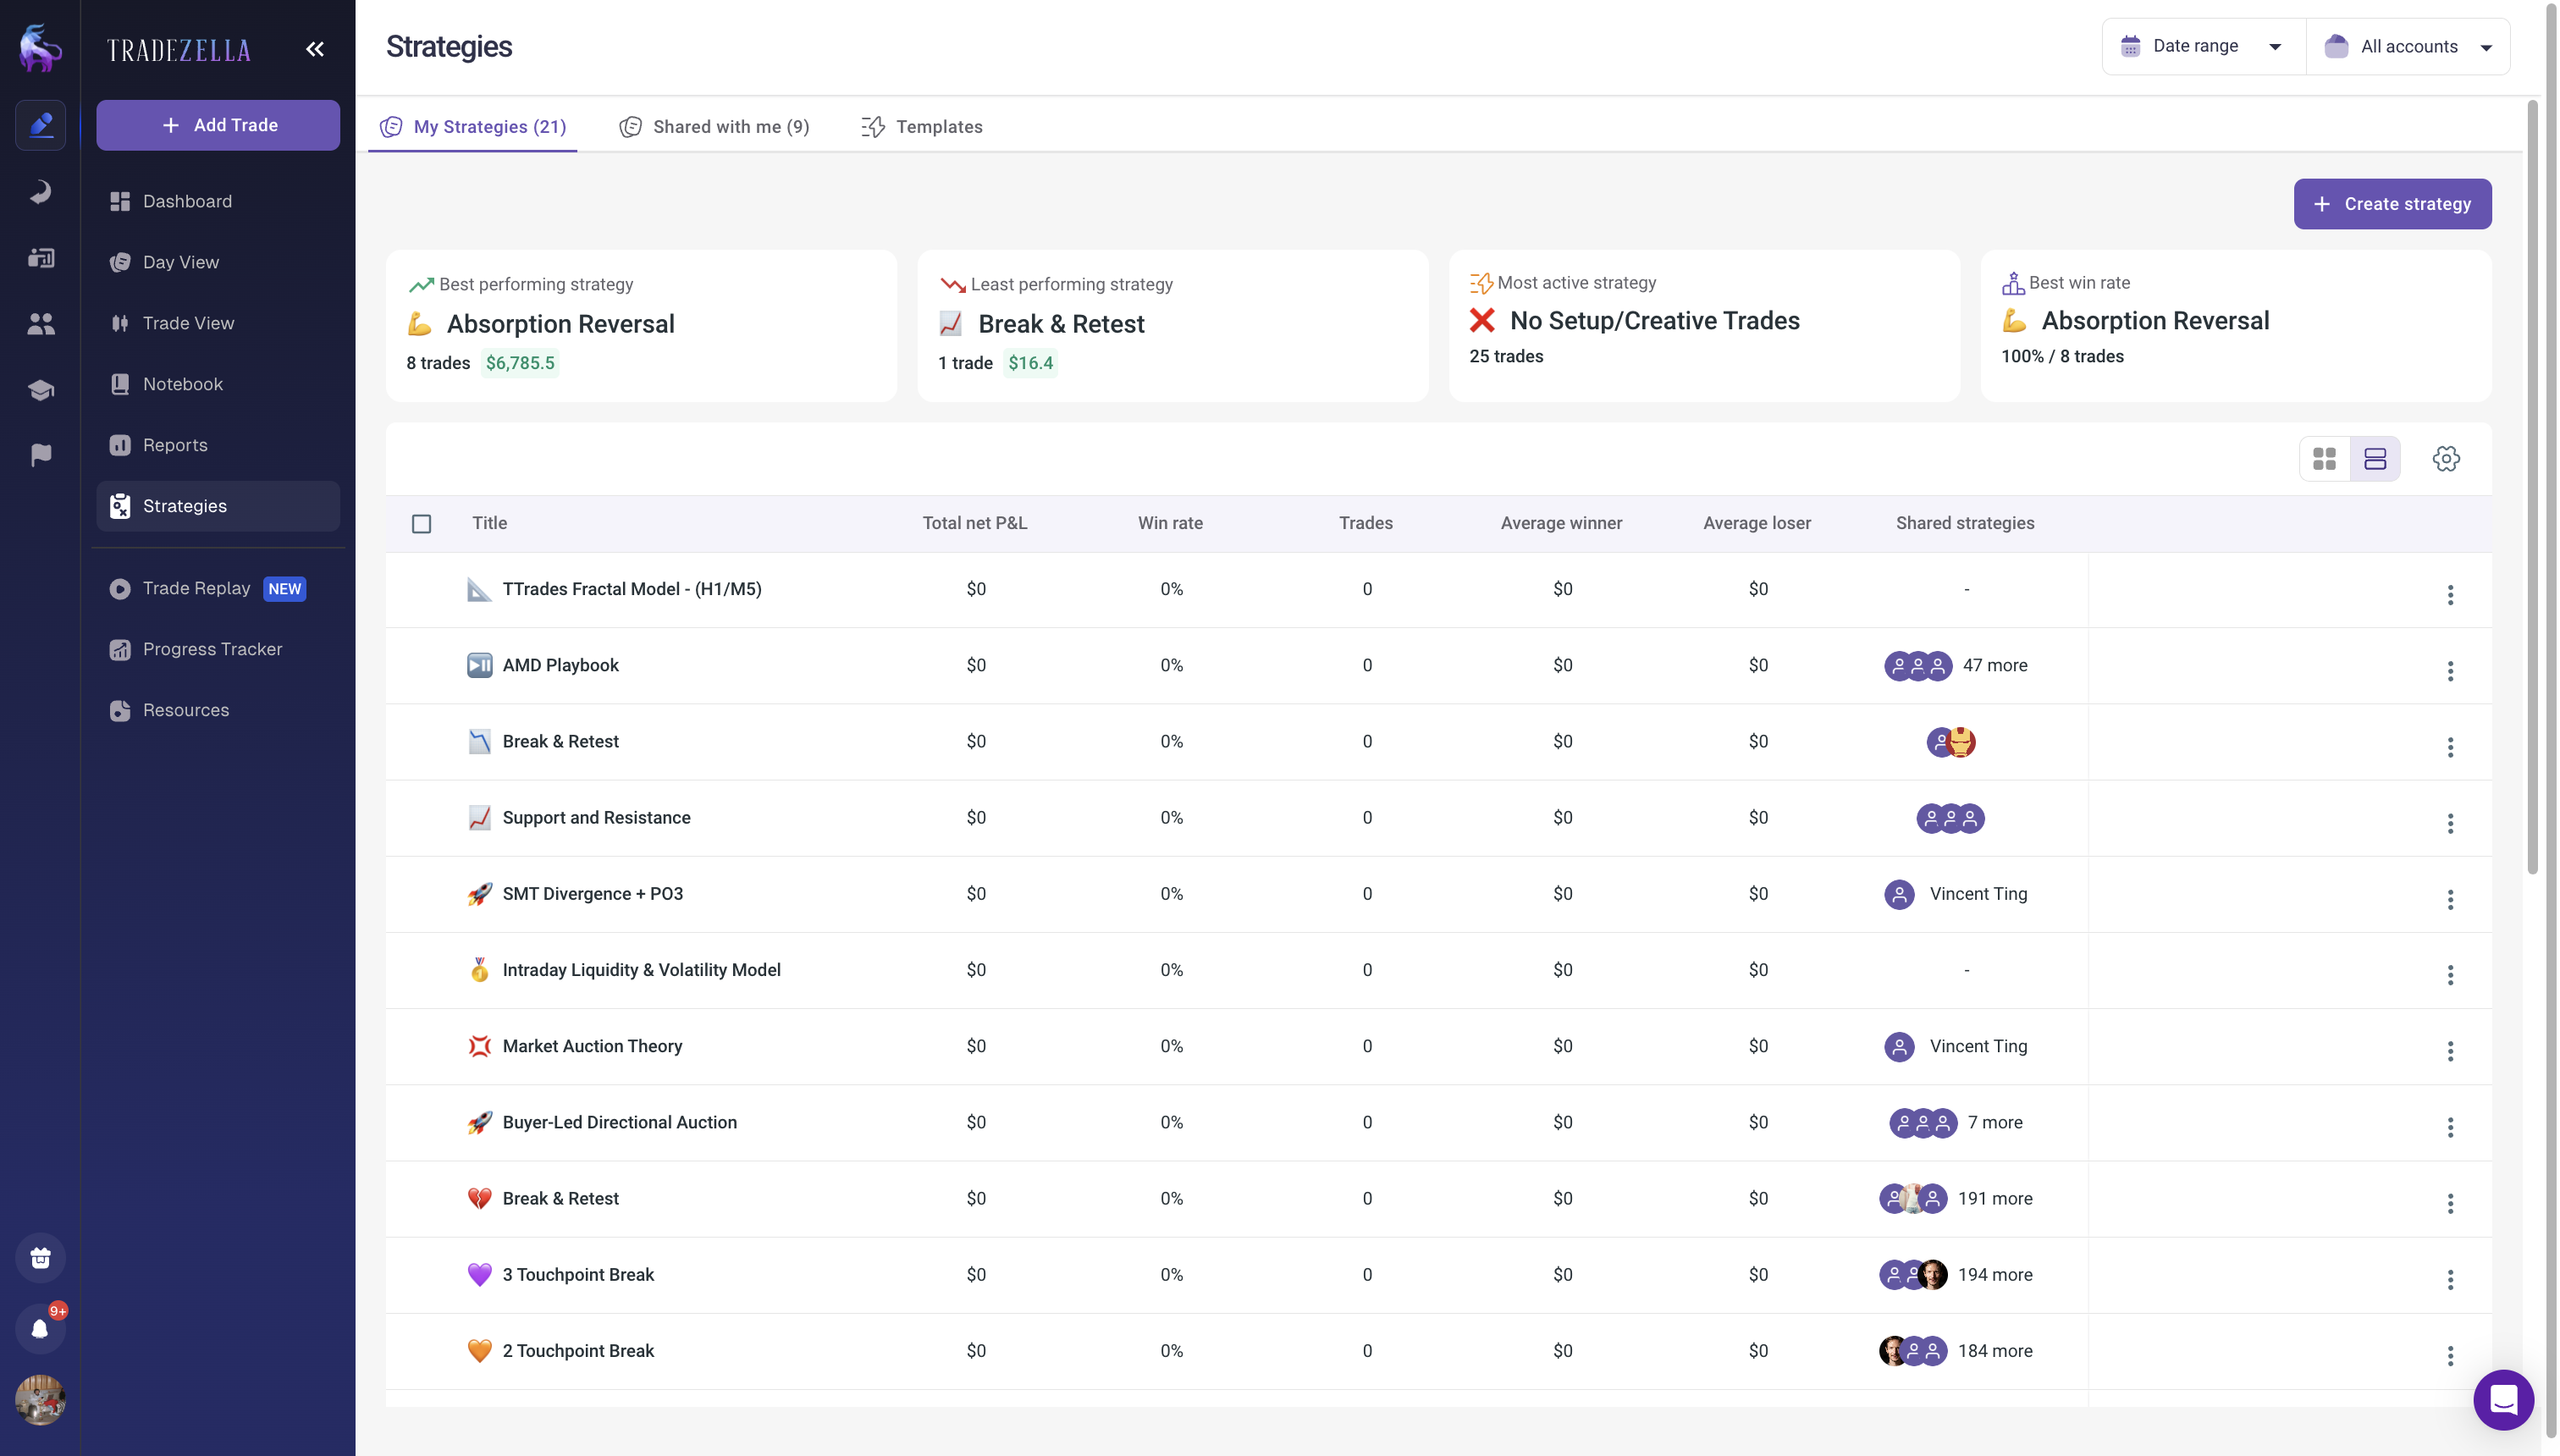
In TradeZella, you can build each of these rules directly into a Strategy. Define your entry criteria, exit rules, position sizing, and no-trade conditions as part of the Strategy setup. Then every trade you take under that Strategy gets tracked automatically, so you can see win rate, profit factor, and R-multiple performance over time and know exactly whether your rules are producing an edge.
TradeZella Strategies
Phase 3: How Do You Backtest a Trading System?
Backtesting runs your system rules against historical data to see how they would have performed. Our full guide on backtesting trading strategies covers the details. Here are the minimum requirements for a reliable backtest:
Minimum 2 years of data. This ensures your system has been tested across different market conditions: trending, choppy, volatile, and quiet. A system that only works in one condition will fail when conditions change.
Minimum 50 trades. Fewer than 50 trades means your results aren't statistically significant. A 70% win rate over 10 trades could easily be noise. Over 50+ trades, the numbers start telling you something real.
Include commissions and slippage. A backtest that ignores costs can make a marginally profitable system look great. Add realistic commission costs and assume some slippage on entries and exits, especially for less liquid instruments.
Don't over-optimize. If you keep tweaking parameters until the backtest looks perfect, you've curve-fit to historical data. The system will fail on new data. Run one test with your initial parameters. If it fails, change the hypothesis, not the parameters.
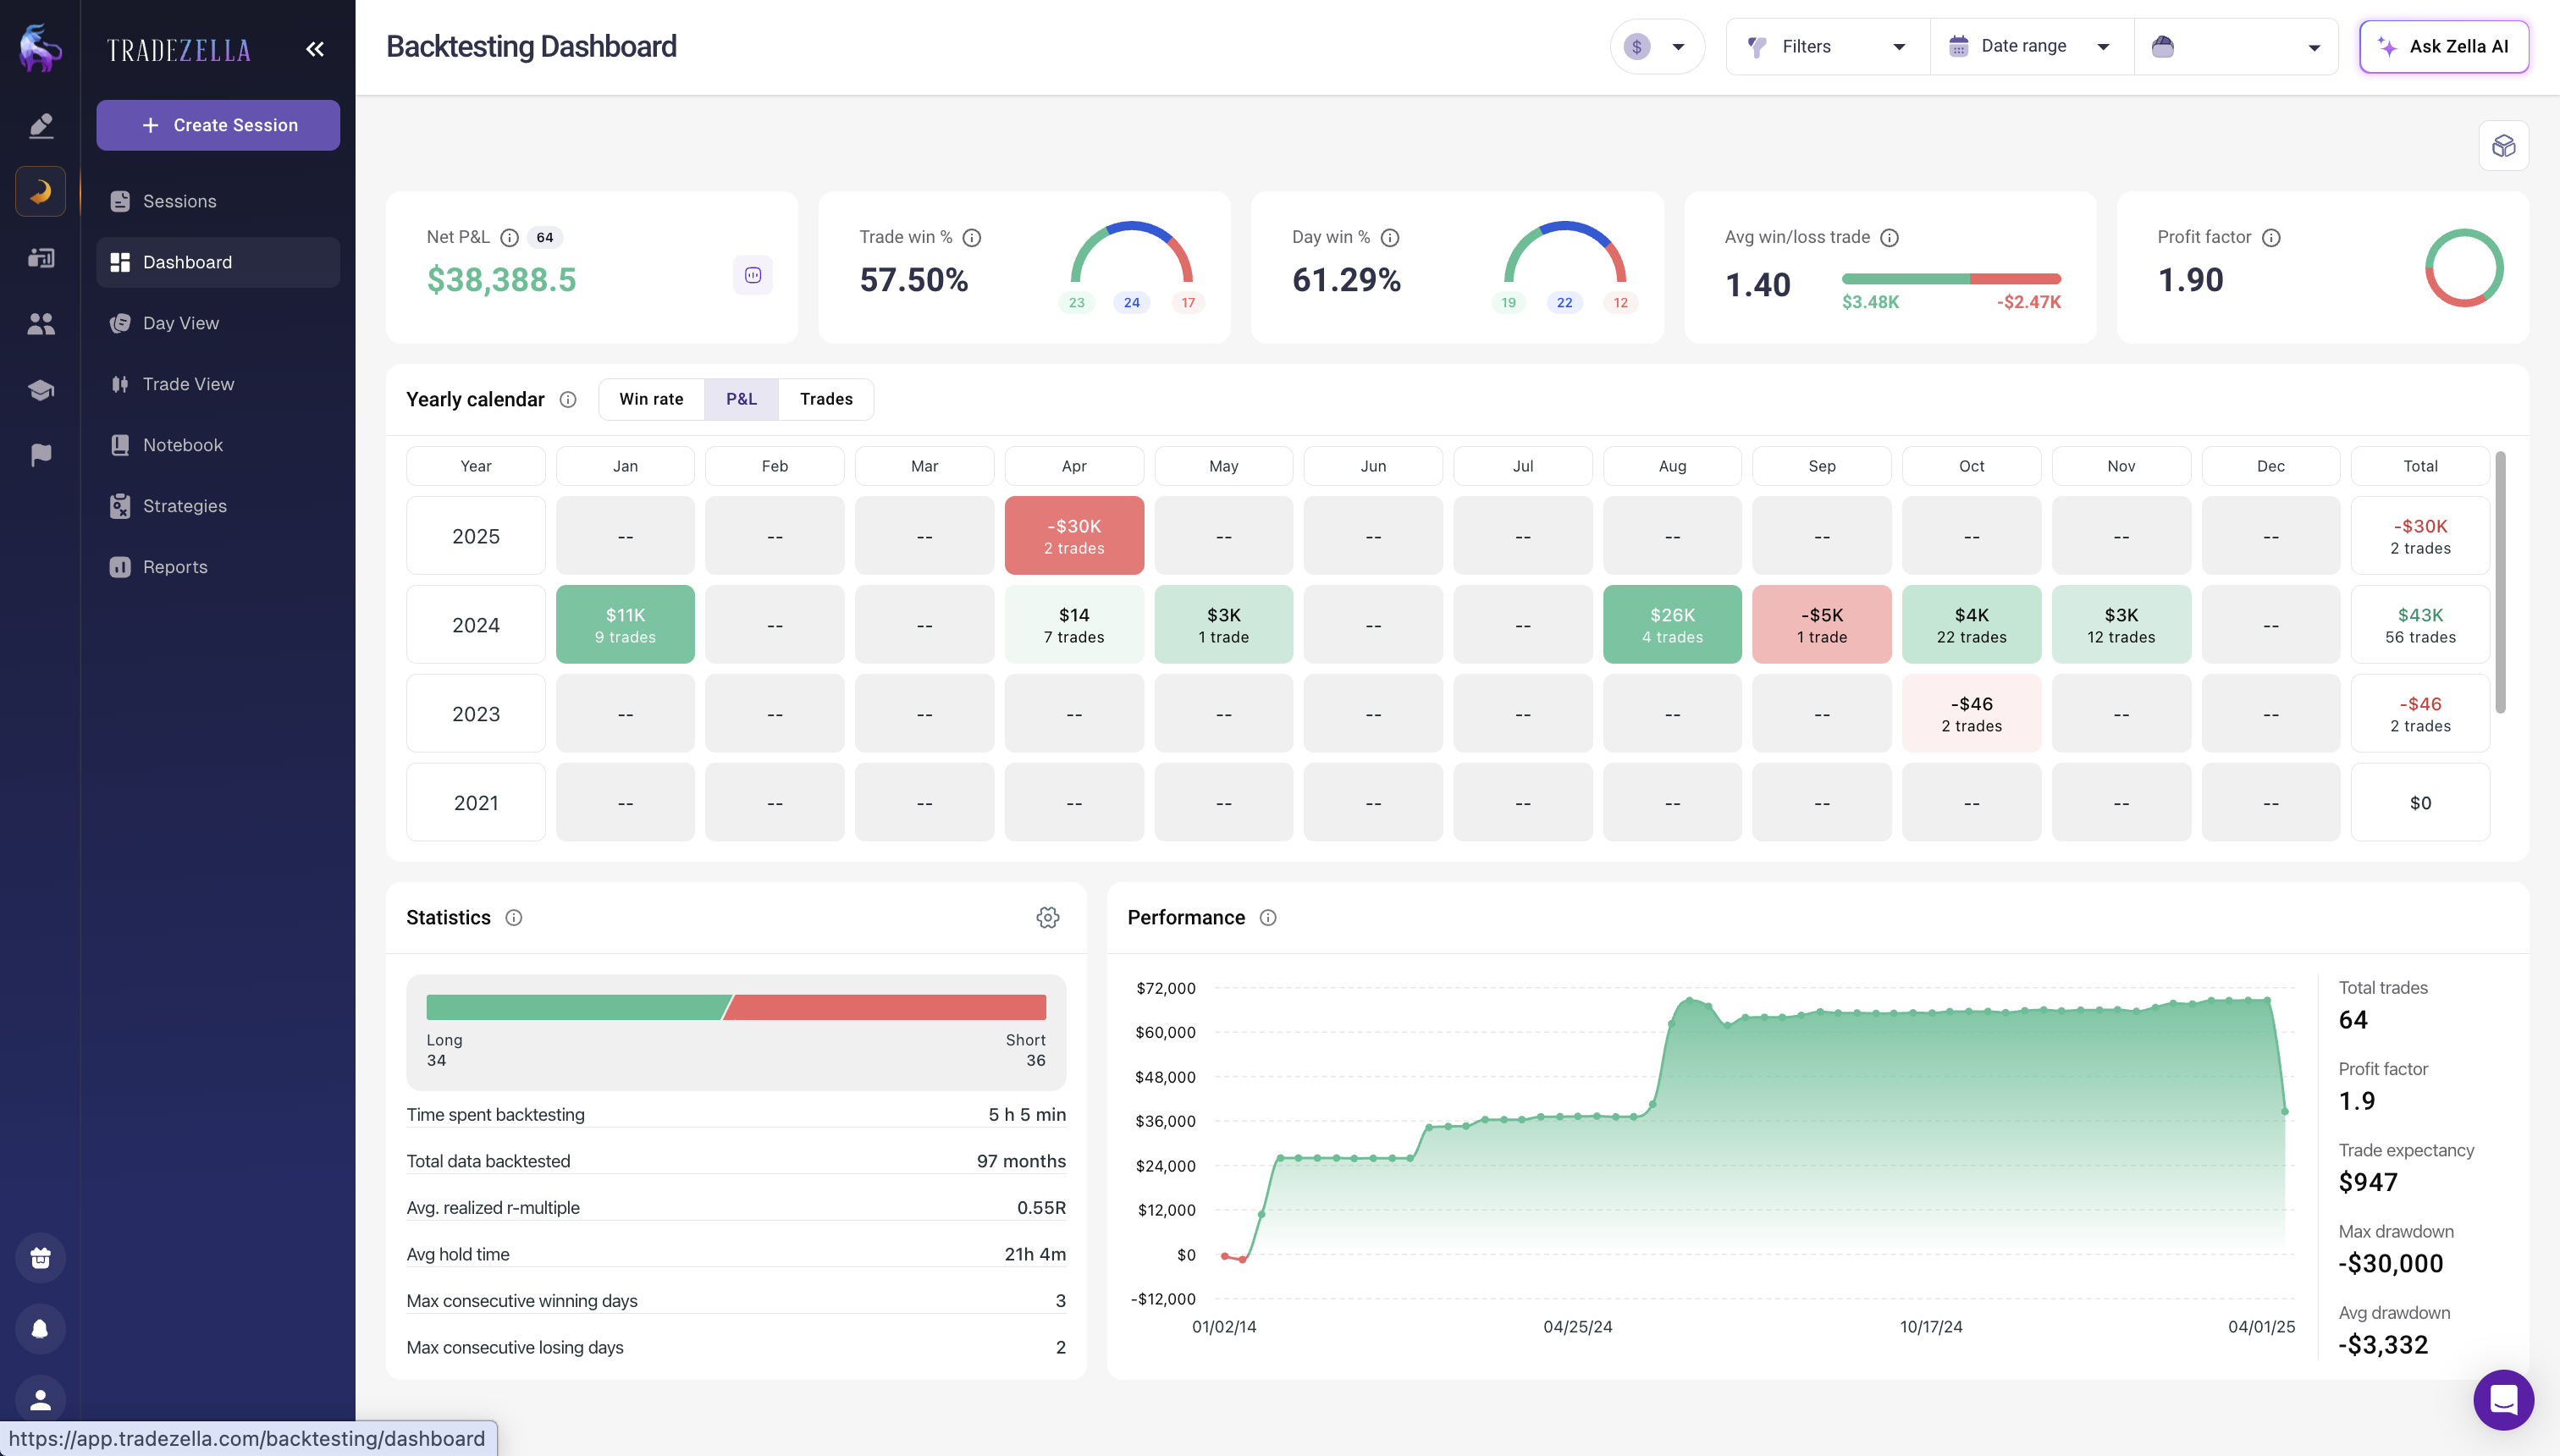
In TradeZella, the backtesting feature lets you test strategies against 11+ years of historical data across stocks, forex, crypto, and futures. You set your rules, run the test, and get back win rate, profit factor, trading expectancy, max drawdown, and equity curve.
TradeZella Backtesting Dasboard
Validate with Monte Carlo Simulation
A single backtest gives you one possible outcome based on the specific sequence of trades that happened historically. But what if those trades occurred in a different order? Monte Carlo simulation runs your backtest results through thousands of randomized sequences to show the range of possible outcomes, including worst-case drawdowns.
TradeZella's Monte Carlo Simulator (available on the free trading calculators page) takes your backtest metrics and generates probability distributions for drawdown, final equity, and streak length. If your system survives 95% of Monte Carlo scenarios with a tolerable drawdown, it's robust. If it blows up in 30% of scenarios, the backtest results are fragile.
Pass criteria for Phase 3: Profit factor above 1.3. Max drawdown within your drawdown management tolerance (typically under 15% for personal accounts, under 5% for prop firms). Expectancy positive. Monte Carlo survival rate above 90%. If all pass, move to Phase 4.
Red flags: Profit factor below 1.2, max drawdown above 20%, fewer than 50 trades, performance concentrated in one time period, or Monte Carlo showing more than 20% of scenarios hitting your max drawdown.
Phase 4: Why Is Forward Testing Essential?
Forward testing (paper trading) reveals whether the system is actually tradeable by a human. Backtesting assumes perfect execution: you always see the setup, always get filled at the expected price, and never hesitate. Forward testing exposes the gaps: can you identify the setup in real time? Can you get filled at expected prices? Can you resist the urge to override your rules when a trade is going against you?
In TradeZella, create a Strategy for your system and log all forward-test trades under it. Tag each trade as "Forward Test" so you can filter analytics later. Use the Replay feature to practice identifying your setups on historical charts bar by bar before forward testing in live market conditions.
What to do: Forward test for a minimum of 30 setups (typically 2 to 6 weeks depending on how frequently your setup triggers). Compare forward-test results to your backtest. If forward-test profit factor is within 80% of backtest (a 1.5 backtest profit factor means 1.2+ forward test), the system is performing as expected.
Red flags: Win rate 10+ points lower than backtest, consistently missing entries because you couldn't identify the setup fast enough, frequent urge to override rules (a sign of FOMO trading bleeding into your system), or difficulty getting fills near expected prices. If you're tracking trades in a spreadsheet during this phase, now is the time to move to a dedicated journal, the trading journal vs spreadsheet comparison explains why analytics matter more as volume increases.
Phase 5: How Do You Live Test a Trading System?
Start at 25% of your normal position size. On a $50,000 account that normally risks $500 per trade (1%), drop to $125 risk per trade (0.25%). The purpose isn't to make money. It's to prove you can execute the system with real capital on the line without deviating from your rules.
Real money changes everything. Paper trading a $500 loss feels very different from watching $125 of real money disappear. The psychological pressure of live trading introduces new variables: hesitation on entries, premature exits, moving stops, and trading mistakes you never made in forward testing.
This is where trading discipline becomes measurable. Tag every live trade with your Rule Adherence Score tags ("Rules Followed" / "Rules Broken") alongside your "Live Test" phase tag. Track trading habits to see if specific times, sequences, or emotions cause you to deviate from the system under live conditions.
What to do: Trade 20+ setups at 25% size. If your metrics are within 80% of forward-test results and your Rule Adherence Score is above 80%, scale to 50% size. Trade 20 more at 50%. Then 75%. Then 100%. Each step requires you to demonstrate consistent execution before sizing up.
Red flags: Rule Adherence Score below 70% (you're deviating too often under live pressure), win rate or profit factor significantly worse than forward test (execution problems), or emotional spirals after losses leading to losing streak behavior.
Phase 6: How Do You Evaluate a Trading System?
After 50+ live trades at full size, you have enough data for a meaningful comparison. Put all three datasets side by side:
Phase
Duration
Minimum Sample
Pass Criteria
Red Flags
1. Hypothesis
1-2 days
N/A
Specific, testable idea with clear entry/exit logic
Vague or untestable concept
2. Rules
3-7 days
N/A
Mechanical rules for entry, exit, sizing, and no-trade conditions
Ambiguous rules, subjective criteria
3. Backtest
1-2 weeks
50+ trades, 2+ years
Profit factor >1.3, max drawdown <15%, Monte Carlo 90%+ survival
PF <1.2, drawdown >20%, <50 trades, curve-fitting
4. Forward Test
2-6 weeks
30+ setups
PF within 80% of backtest, setups identifiable in real time
Win rate 10+ pts below backtest, can't spot setups live
Live PF <50% of backtest, persistent execution issues
7. Iterate
Ongoing (monthly)
30+ trades per review
PF >1.2, stable win rate, validated changes only
PF <1.0 over 50+ trades = retire or rebuild
In TradeZella, filter your analytics by phase tags (Backtest, Forward Test, Live Test) for a clean comparison. You can see win rate, profit factor, average R-multiple, max drawdown, and trading expectancy for each phase in one view.
The 70% rule: If your live profit factor is at least 70% of your backtest profit factor, the system is viable at full size. A backtest profit factor of 1.8 means your live target is 1.26 or higher. If significantly worse, diagnose the cause:
Execution quality: Are you getting filled at worse prices than expected? Slippage may be higher than your backtest assumed.
Rule adherence: Is your Rule Adherence Score below 85%? If so, the system isn't the problem. Your execution is. Focus on the trading discipline system.
Market conditions: Did market conditions change between your backtest period and your live test period? A trending backtest period followed by a choppy live test period will naturally produce weaker results.
Phase 7: How Do You Iterate and Improve a Trading System?
No system is finished. Markets change. Volatility regimes shift. What worked in a trending market may underperform in a range-bound one. The iteration phase is permanent and ongoing.
Monthly reviews. Use your trade review process to evaluate your system every month. Key questions: Is your win rate stable within its historical range? Is your profit factor still above 1.2? Are you seeing new patterns in the data that suggest a rule change? Compare the current month's metrics against the 6-month baseline.
Making changes. Treat every parameter change as a new hypothesis. Want to change your stop from 1 ATR to 1.5 ATR? That's a hypothesis: "A wider stop will reduce the number of trades stopped out by noise, improving overall expectancy." Backtest the change. Forward test it for 20+ trades at reduced size. Only implement at full size after validation. Never change based on a single trade or a single bad week.
When to retire a system. If your profit factor drops below 1.0 over 50+ trades despite clean execution (Rule Adherence Score above 85%), the system has lost its edge. This usually means the market conditions the system was built for no longer exist. A breakout system built during a high-volatility year will underperform in a low-volatility year. You can either wait for conditions to return and pause the system, or develop a new hypothesis for current conditions and start at Phase 1.
Building a system for prop firm trading: If you're planning to trade a prop firm evaluation with this system, the pass/fail criteria are tighter at every phase. Your backtest max drawdown must be under 5% (not 15%). Your forward test needs 90%+ Rule Adherence because one discipline lapse during an evaluation can fail the account. And your live test should include tracking performance separately for each prop firm account. See the full guide on how to pass prop firm challenge evaluations for prop-specific rules at each phase.
Key Takeaways
A trading system has 7 phases: hypothesis, rules, backtest, forward test, live test, evaluate, iterate. Most traders only do 1-3 of these.
Your hypothesis must be specific and testable. Vague ideas produce vague systems that can't be validated.
Rules must be mechanical and unambiguous. If two people can't make the same decision from your rules, they're not finished.
Backtesting requires 2+ years of data and 50+ trades. Don't curve-fit. Validate with Monte Carlo simulation.
Forward testing reveals if the system is actually tradeable by a human in real-time conditions. Target 80% of backtest performance.
Live testing starts at 25% size and scales through 50%, 75%, 100%. Each stage requires consistent execution before sizing up.
The 70% rule: Live profit factor within 70% of backtest = viable system at full size.
Iteration is permanent. Monthly reviews, validated changes only, and a clear trigger for when to retire the system.
3 to 6 months from hypothesis to fully validated, assuming you don't skip phases. Phase 1 and 2 take 1 to 2 weeks. Phase 3 (backtesting) takes 1 to 2 weeks depending on data availability. Phase 4 (forward testing) takes 2 to 6 weeks for 30+ setups. Phase 5 (live testing) takes 4 to 8 weeks for 50+ trades at graduated sizing. Rushing leads to undertested systems that fail when conditions change.
Can beginners build a trading system?
Yes. Start simple: one setup, clear entry, clear stop, clear target. A system with 3 rules you can follow consistently will outperform a system with 15 rules you can't. The Rule Adherence Score is more important than system complexity. Build the simplest version first, validate it through all 7 phases, then add complexity only if the data supports it.
How do I know if my backtest results are reliable?
Reliable backtests have minimum 50 trades across 2 or more years, include realistic commission and slippage assumptions, and haven't been excessively optimized. Run your initial parameters once. If the system fails, change the hypothesis, not the parameters. Validate further with Monte Carlo simulation: if 90 percent or more of randomized scenarios survive with tolerable drawdown, the results are robust.
What is the minimum capital needed to build a trading system?
Phases 1 through 4 (hypothesis, rules, backtesting, and forward testing) require zero capital. You can backtest and paper trade with no money at risk. Phase 5 (live testing) can begin with $2,000 to $5,000 if you risk 0.25 percent per trade ($5 to $12.50 per trade at those account sizes). The goal is proving execution, not generating profit.
Should I build my own system or trade someone else's?
Build your own. Someone else's system was designed for their personality, risk tolerance, time availability, and market knowledge. A system that requires monitoring 15 stocks at once won't work if you can only watch 3. Use established concepts (breakouts, mean reversion, gap strategies) as starting points, but test and validate with your own data through all 7 phases.
How many systems should I trade at once?
Start with one. Get it through all 7 phases before adding a second. Trading two untested systems simultaneously makes it impossible to diagnose what is working and what isn't. After your first system is validated and running at full size, you can begin Phase 1 on a second system. Most profitable traders run 2 to 3 validated systems that perform well in different market conditions.
What do I do if my live results are much worse than my backtest?
Compare your live metrics to both backtest and forward test. If forward test results were close to backtest but live results dropped, the problem is likely psychological, the pressure of real money is affecting your execution. Check your Rule Adherence Score. If it's below 80 percent, the system isn't the issue, your discipline is. If your Rule Adherence Score is above 85 percent and results are still poor, market conditions may have shifted since your backtest period.