What Is Backtesting in Trading and How Does It Work?
What Is Backtesting in Trading and How Does It Work?
Backtesting is the process of testing a trading strategy against historical market data to see how it would have performed before risking real money. This guide covers what backtesting means, how it works step by step, a real trade example with dollar amounts, key metrics to track, common mistakes, and how to get started.
class SampleComponent extends React.Component {
  // using the experimental public class field syntax below. We can also attach
  // the contextType to the current class
  static contextType = ColorContext;
  render() {
    return <Button color={this.color} />
  }
}
Last Updated: July 06, 2026
Backtesting is the process of testing a trading strategy against historical market data to measure how it would have performed before you risk real money. You define your entry rules, exit rules, position sizing, and stop loss, then replay past price data and execute trades as if you were trading live. The results show you whether your strategy has an edge or whether it loses money over a meaningful sample of trades.
Every serious trader backtests. It is how you find out whether a strategy works before your account balance tells you it does not. A strategy that looks good on a chart might fall apart over 100 trades. A strategy that feels wrong might produce a 1.8 profit factor across 200 trades. Backtesting replaces opinion with data.
This guide covers what backtesting means in practice, how the process works step by step, a real example with dollar amounts, the key metrics you need to track, the most common mistakes traders make, and how to get started with your first backtest. If you already know the basics and want to jump into execution, see our step-by-step guide on how to backtest a trading strategy.
TL;DR
Backtesting tests your strategy on historical data before you risk real money. The process: define your rules, pick your market and timeframe, replay historical data, execute trades following your rules exactly, then measure results across at least 50 to 100 trades. Track win rate, profit factor, expectancy, max drawdown, and R-multiple. If the numbers are positive over a large enough sample, forward test at reduced size before going live. If not, adjust and retest.
What Does Backtesting Mean in Trading?
Backtesting means taking a set of trading rules and applying them to historical price data to see what would have happened. You are not predicting the future. You are measuring whether a specific set of rules, applied consistently, would have made or lost money over a past period.
Think of it like a flight simulator. A pilot does not learn to fly by getting into a commercial airplane and hoping for the best. They practice in a simulator where the consequences are not real, but the conditions are. Backtesting is the same thing for traders. You practice your strategy on real historical price data, place trades the way you would in a live market, and measure the results. The price data is real. The conditions are realistic. But your account is not on the line.
The word "backtesting" comes from "testing backward." You are testing your strategy by looking backward through historical data, trade by trade, to build a statistical picture of how your rules perform.
How Does Backtesting Work?
TradeZella Backtesting Interface
The backtesting process follows a clear sequence. Here is how it works from start to finish:
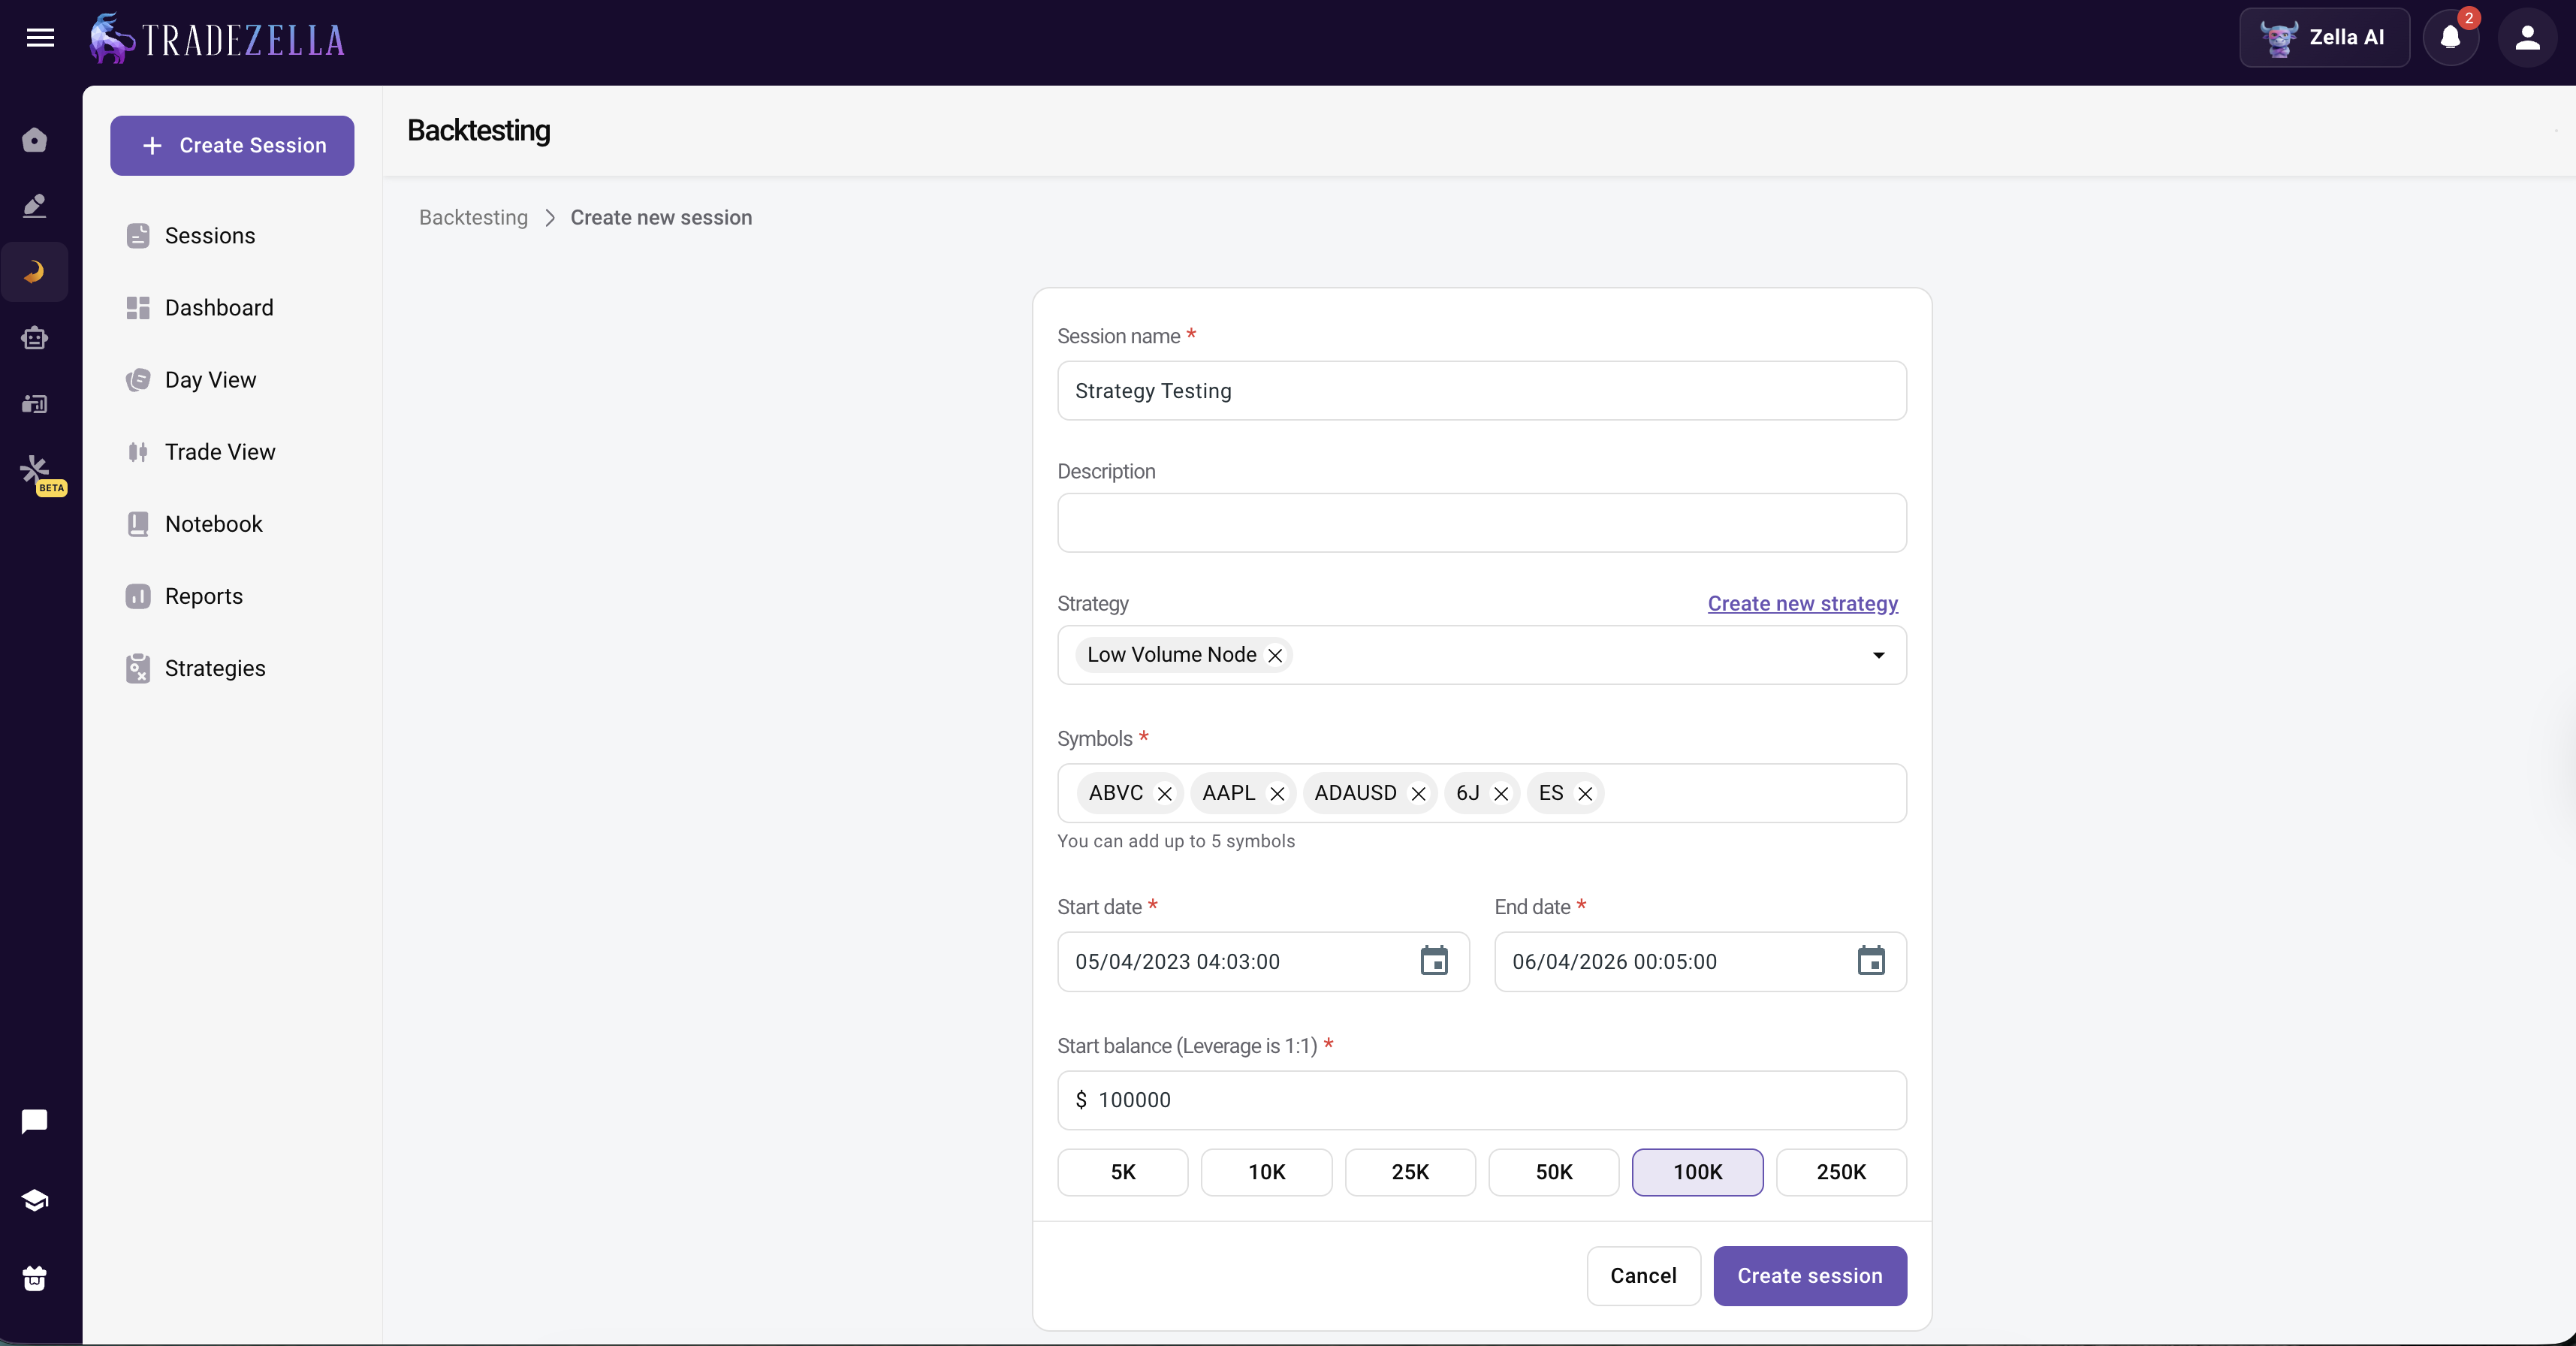
Step 1: Define your strategy rules. Before you open a chart, write down exactly what you are testing. What is the entry signal? What confirms the entry? Where does the stop loss go? Where is the target? What is your risk per trade? The more specific your rules, the more useful the backtest. "Buy when price looks good" is not a strategy. "Enter long when price sweeps the previous session low and reclaims above a 15-minute demand zone with a stop below the wick" is a strategy. For a full framework, see our guide on how to build a trading system.
Step 2: Choose your market and timeframe. Pick the instrument you actually trade (ES futures, EUR/USD, AAPL, NQ) and the timeframe you use for entries. If you are an ICT trader who enters on the 1-minute chart but uses the 15-minute for structure, set up both timeframes. The backtest should mirror your real trading as closely as possible.
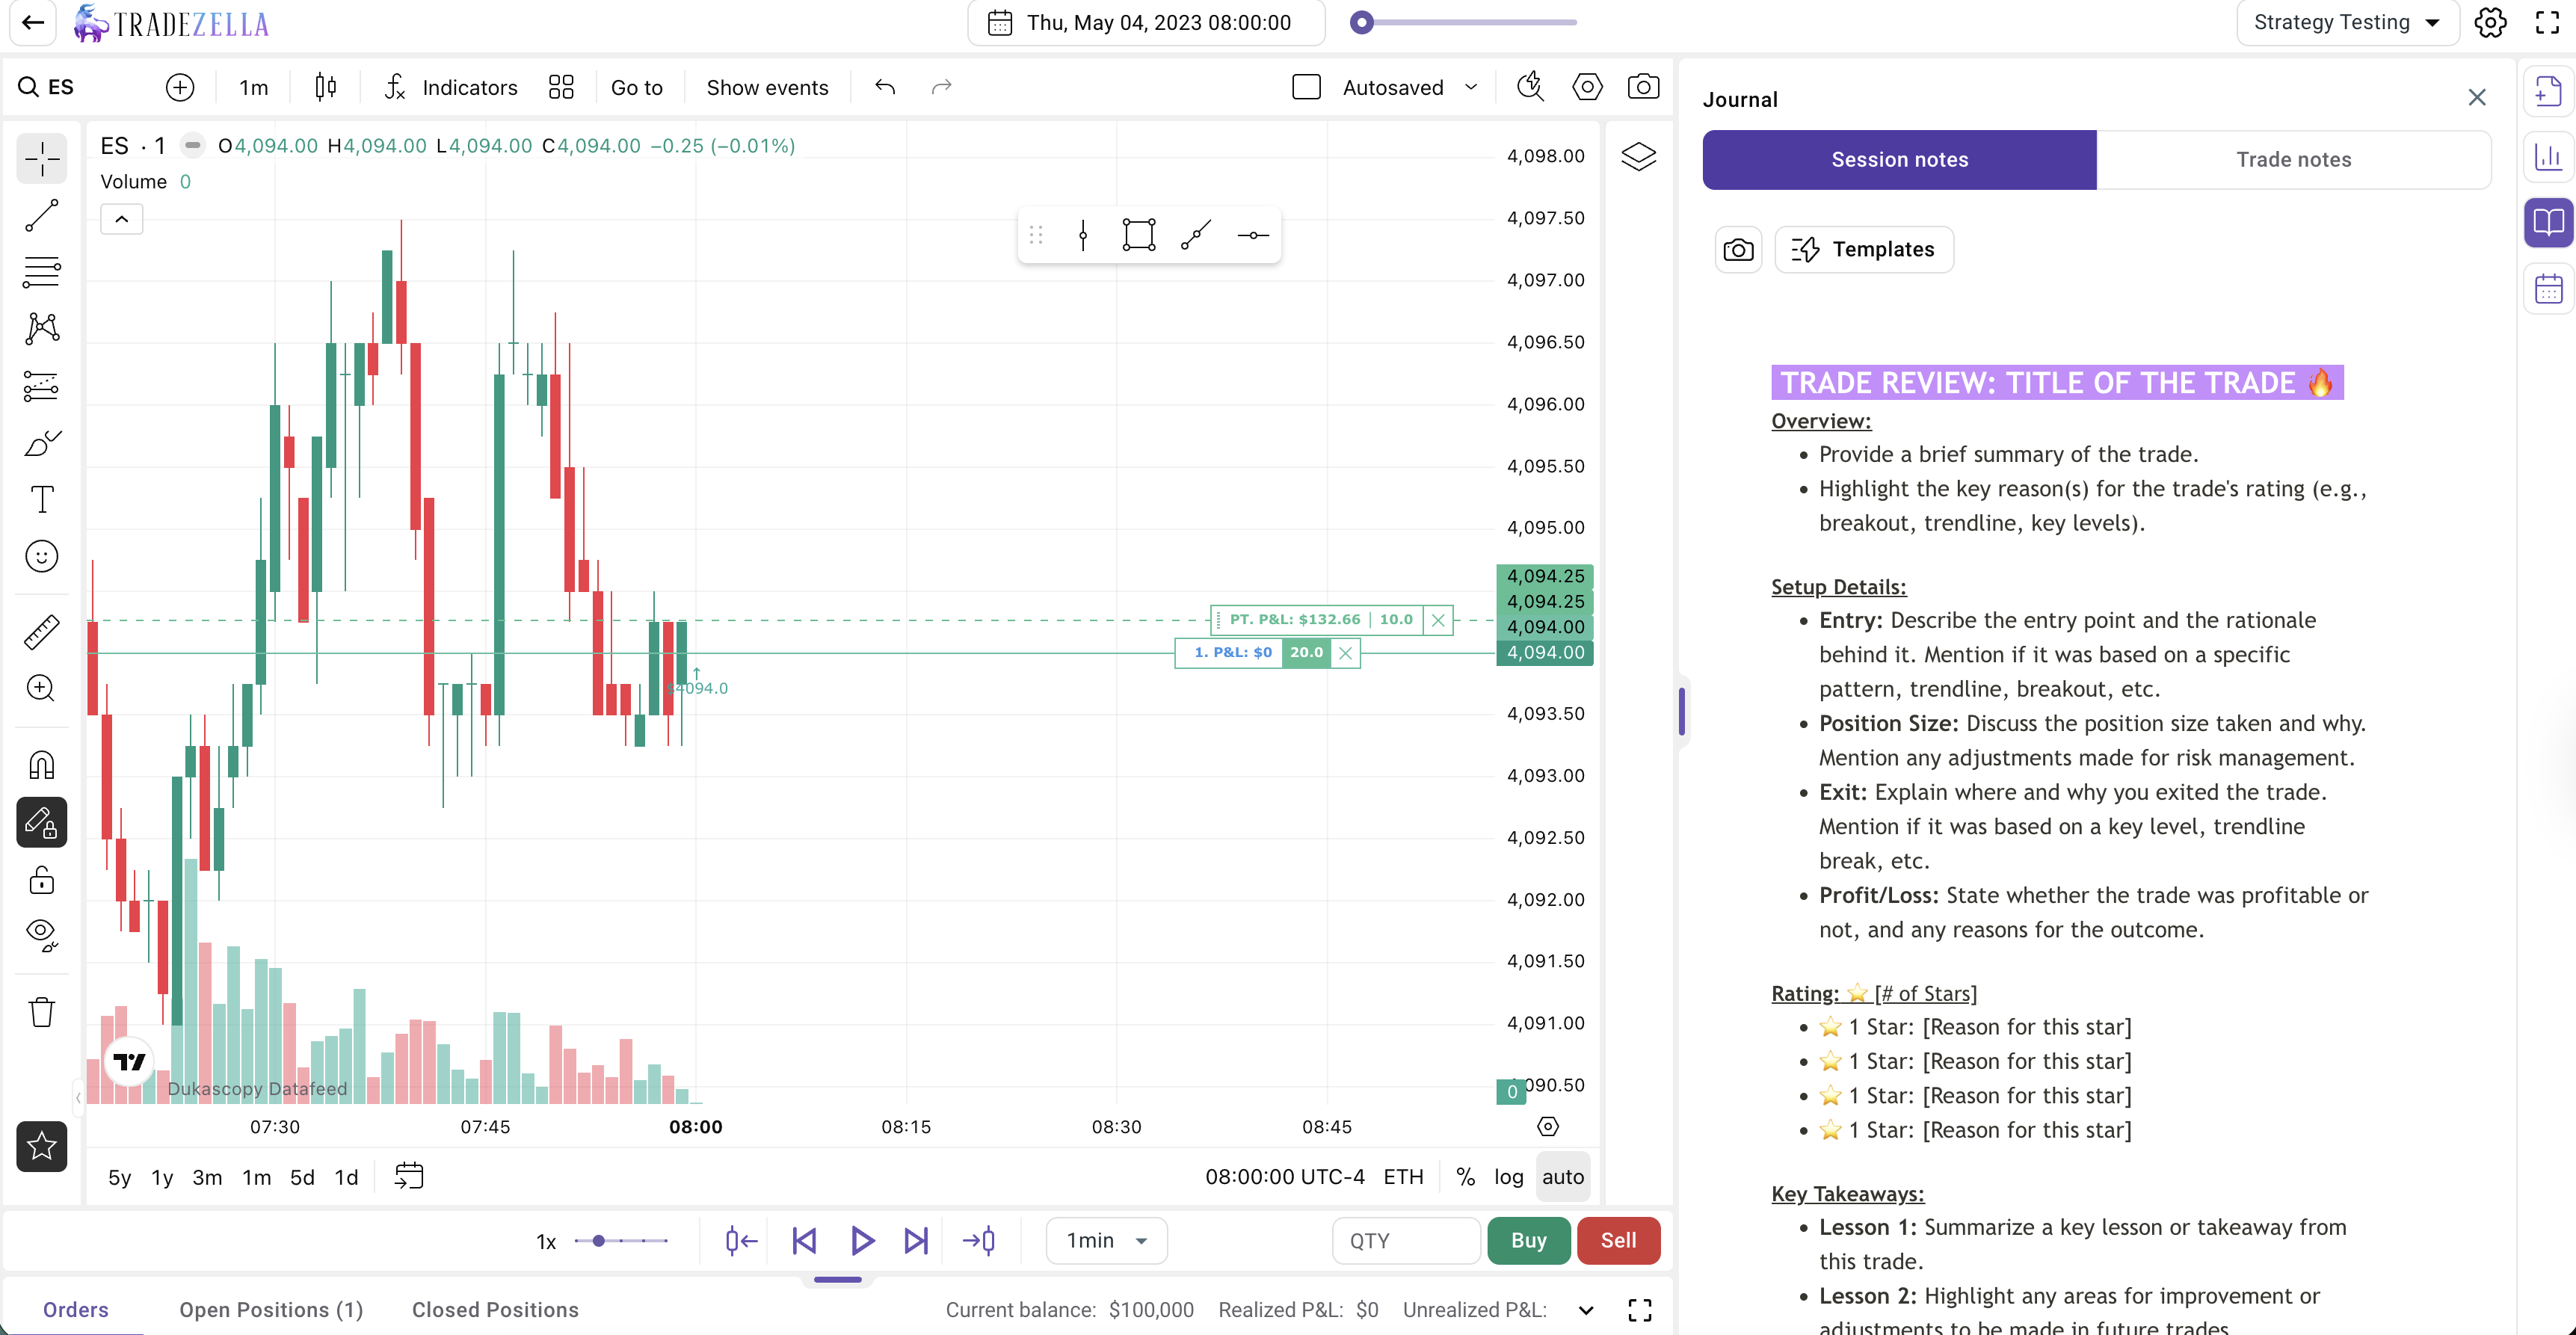
Step 3: Load historical data and start replaying. A backtesting platform loads historical price data and replays it bar by bar. You watch the chart unfold as if it were happening live. You do not know what comes next. This is the critical difference between backtesting and simply scrolling through a chart. Scrolling lets you see the future. Replay hides it.
Step 4: Execute trades following your rules exactly. When your setup appears, take the trade. Place your entry, set your stop loss, set your target. If the setup does not appear, skip forward. The discipline here is what makes backtesting valuable. If you take trades that do not fit your rules, you are not testing the strategy. You are testing your impulse control. Follow the rules or the data means nothing.
Step 5: Log every trade with details. Every trade should be recorded with entry price, exit price, position size, dollar P&L, R-multiple (how many times your risk you made or lost), the setup type, and any notes on what you observed. The best backtesting platforms do this automatically. For more on what to track, see our guide on building a trading dashboard.
Step 6: Collect at least 50 to 100 trades. A backtest with 10 trades is meaningless. You need enough data for the results to be statistically reliable. At minimum, aim for 50 trades. Ideally, 100 or more. This takes time. That is the point. Shortcuts here lead to false confidence.
Step 7: Analyze the results. After you have a full sample, measure your key metrics (covered in detail below). Is the strategy profitable? What is the drawdown? Are the results consistent or driven by a few outlier trades? The numbers tell you whether to move forward with live testing or go back to the drawing board.
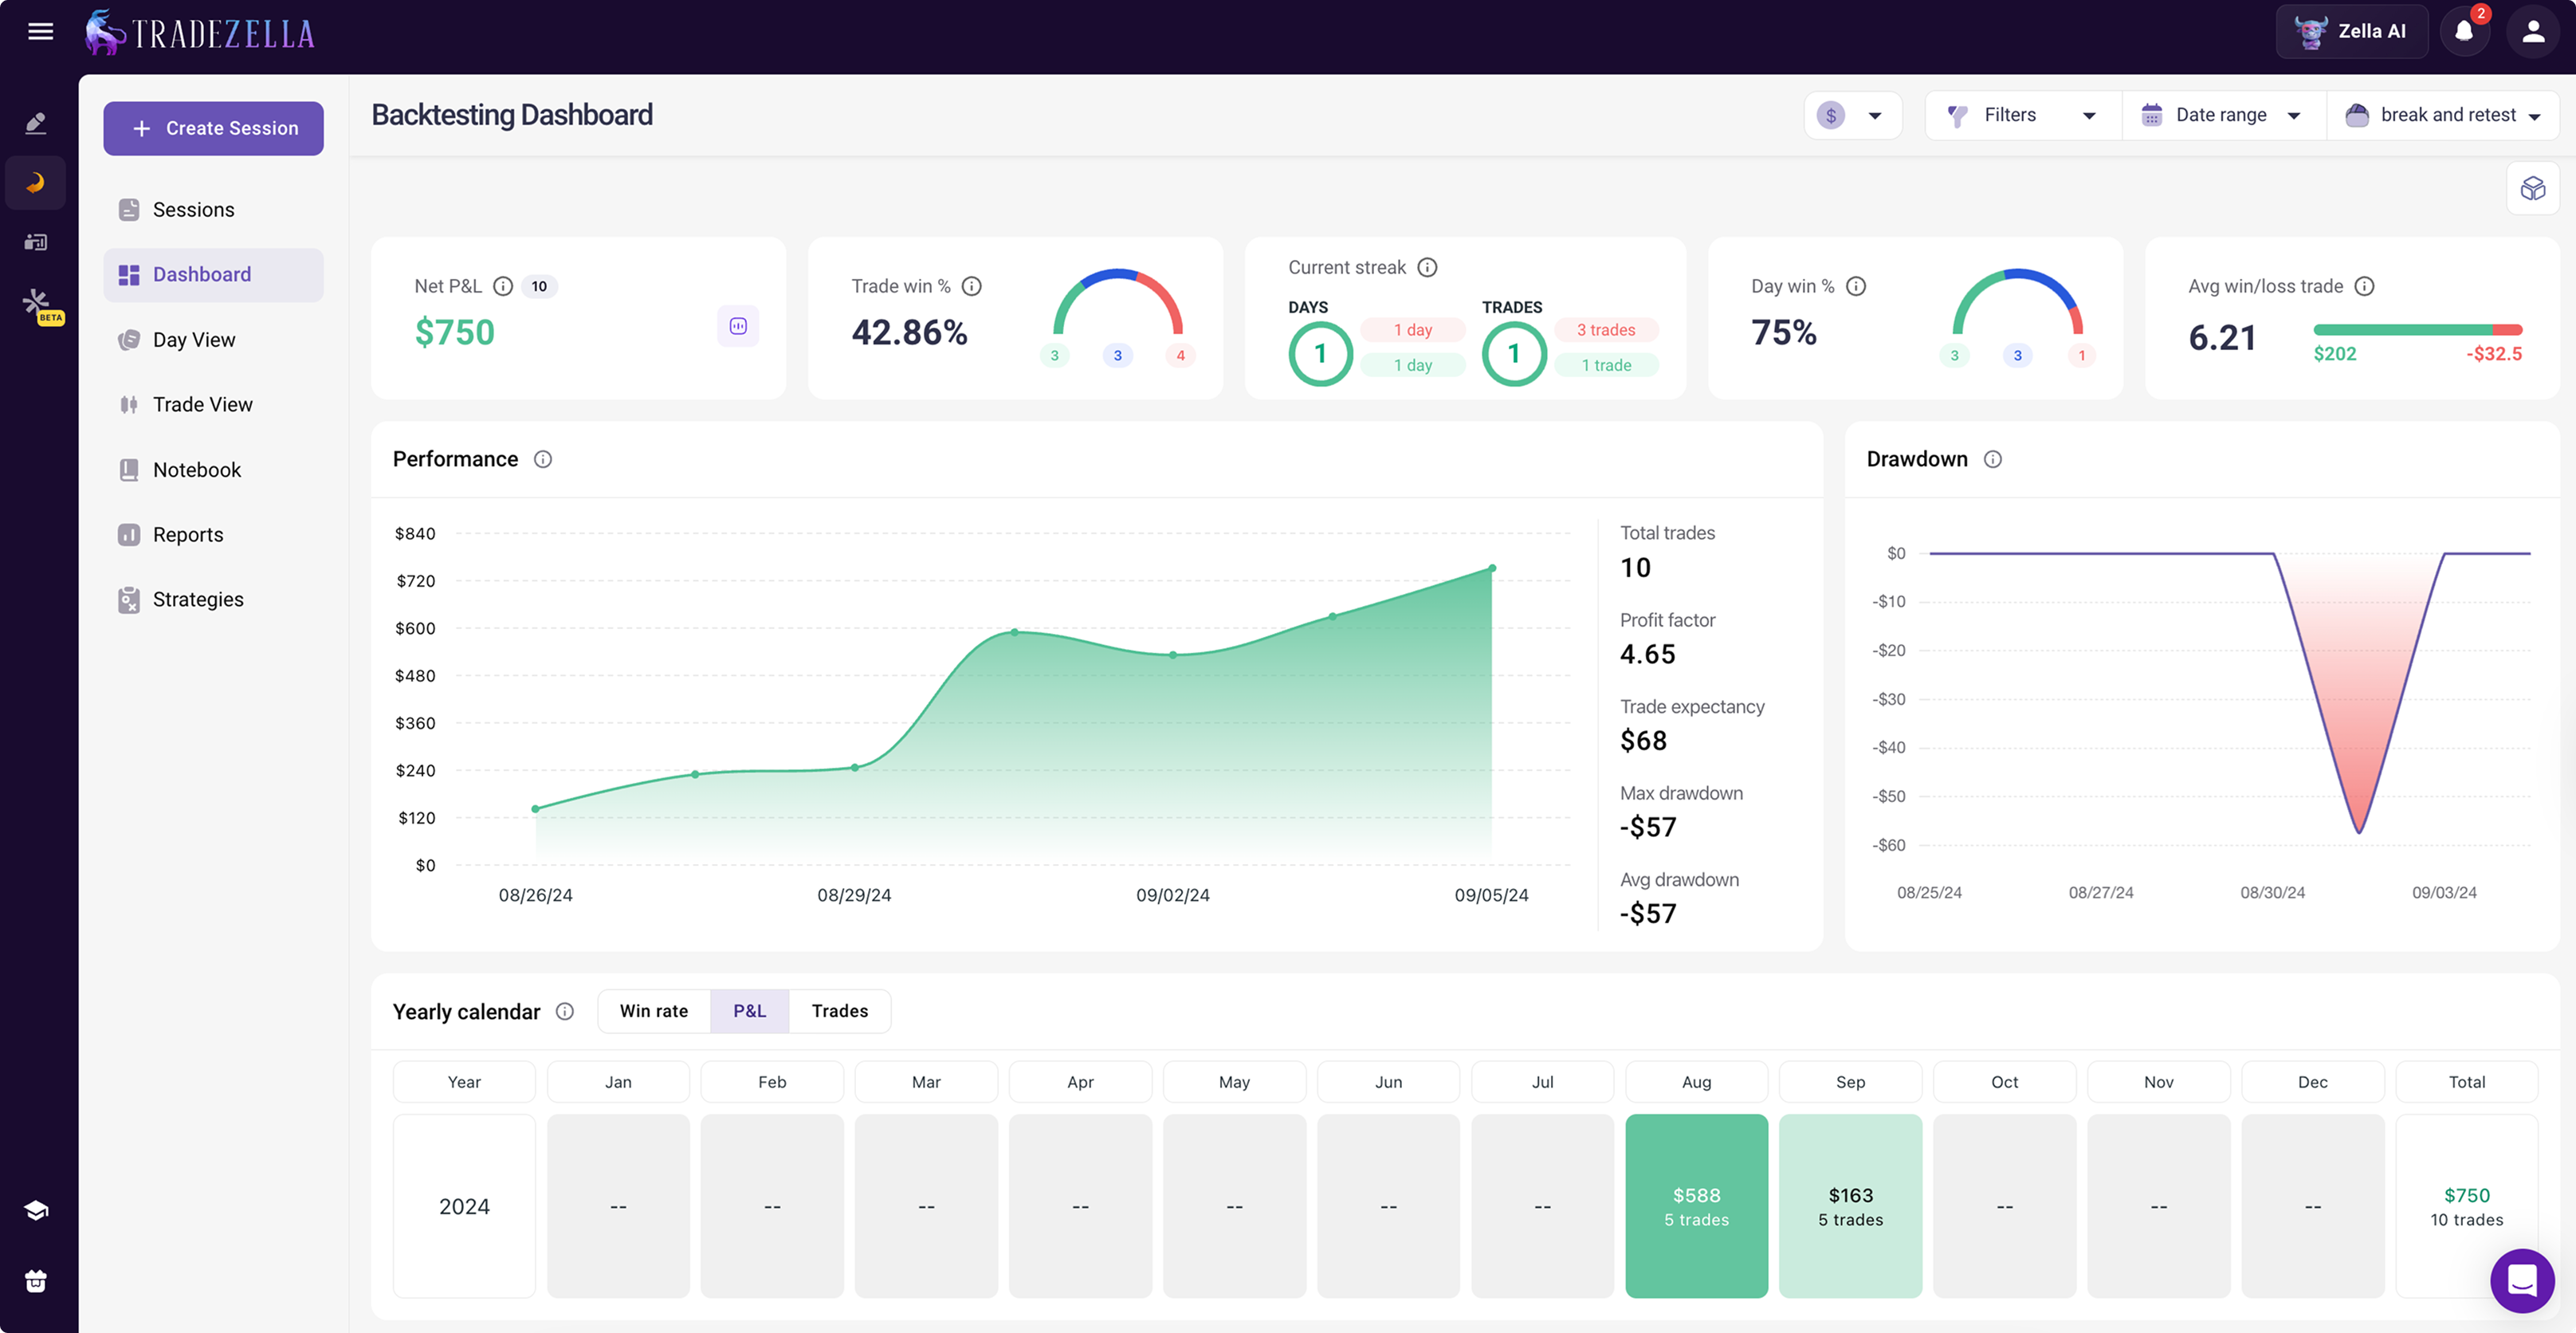
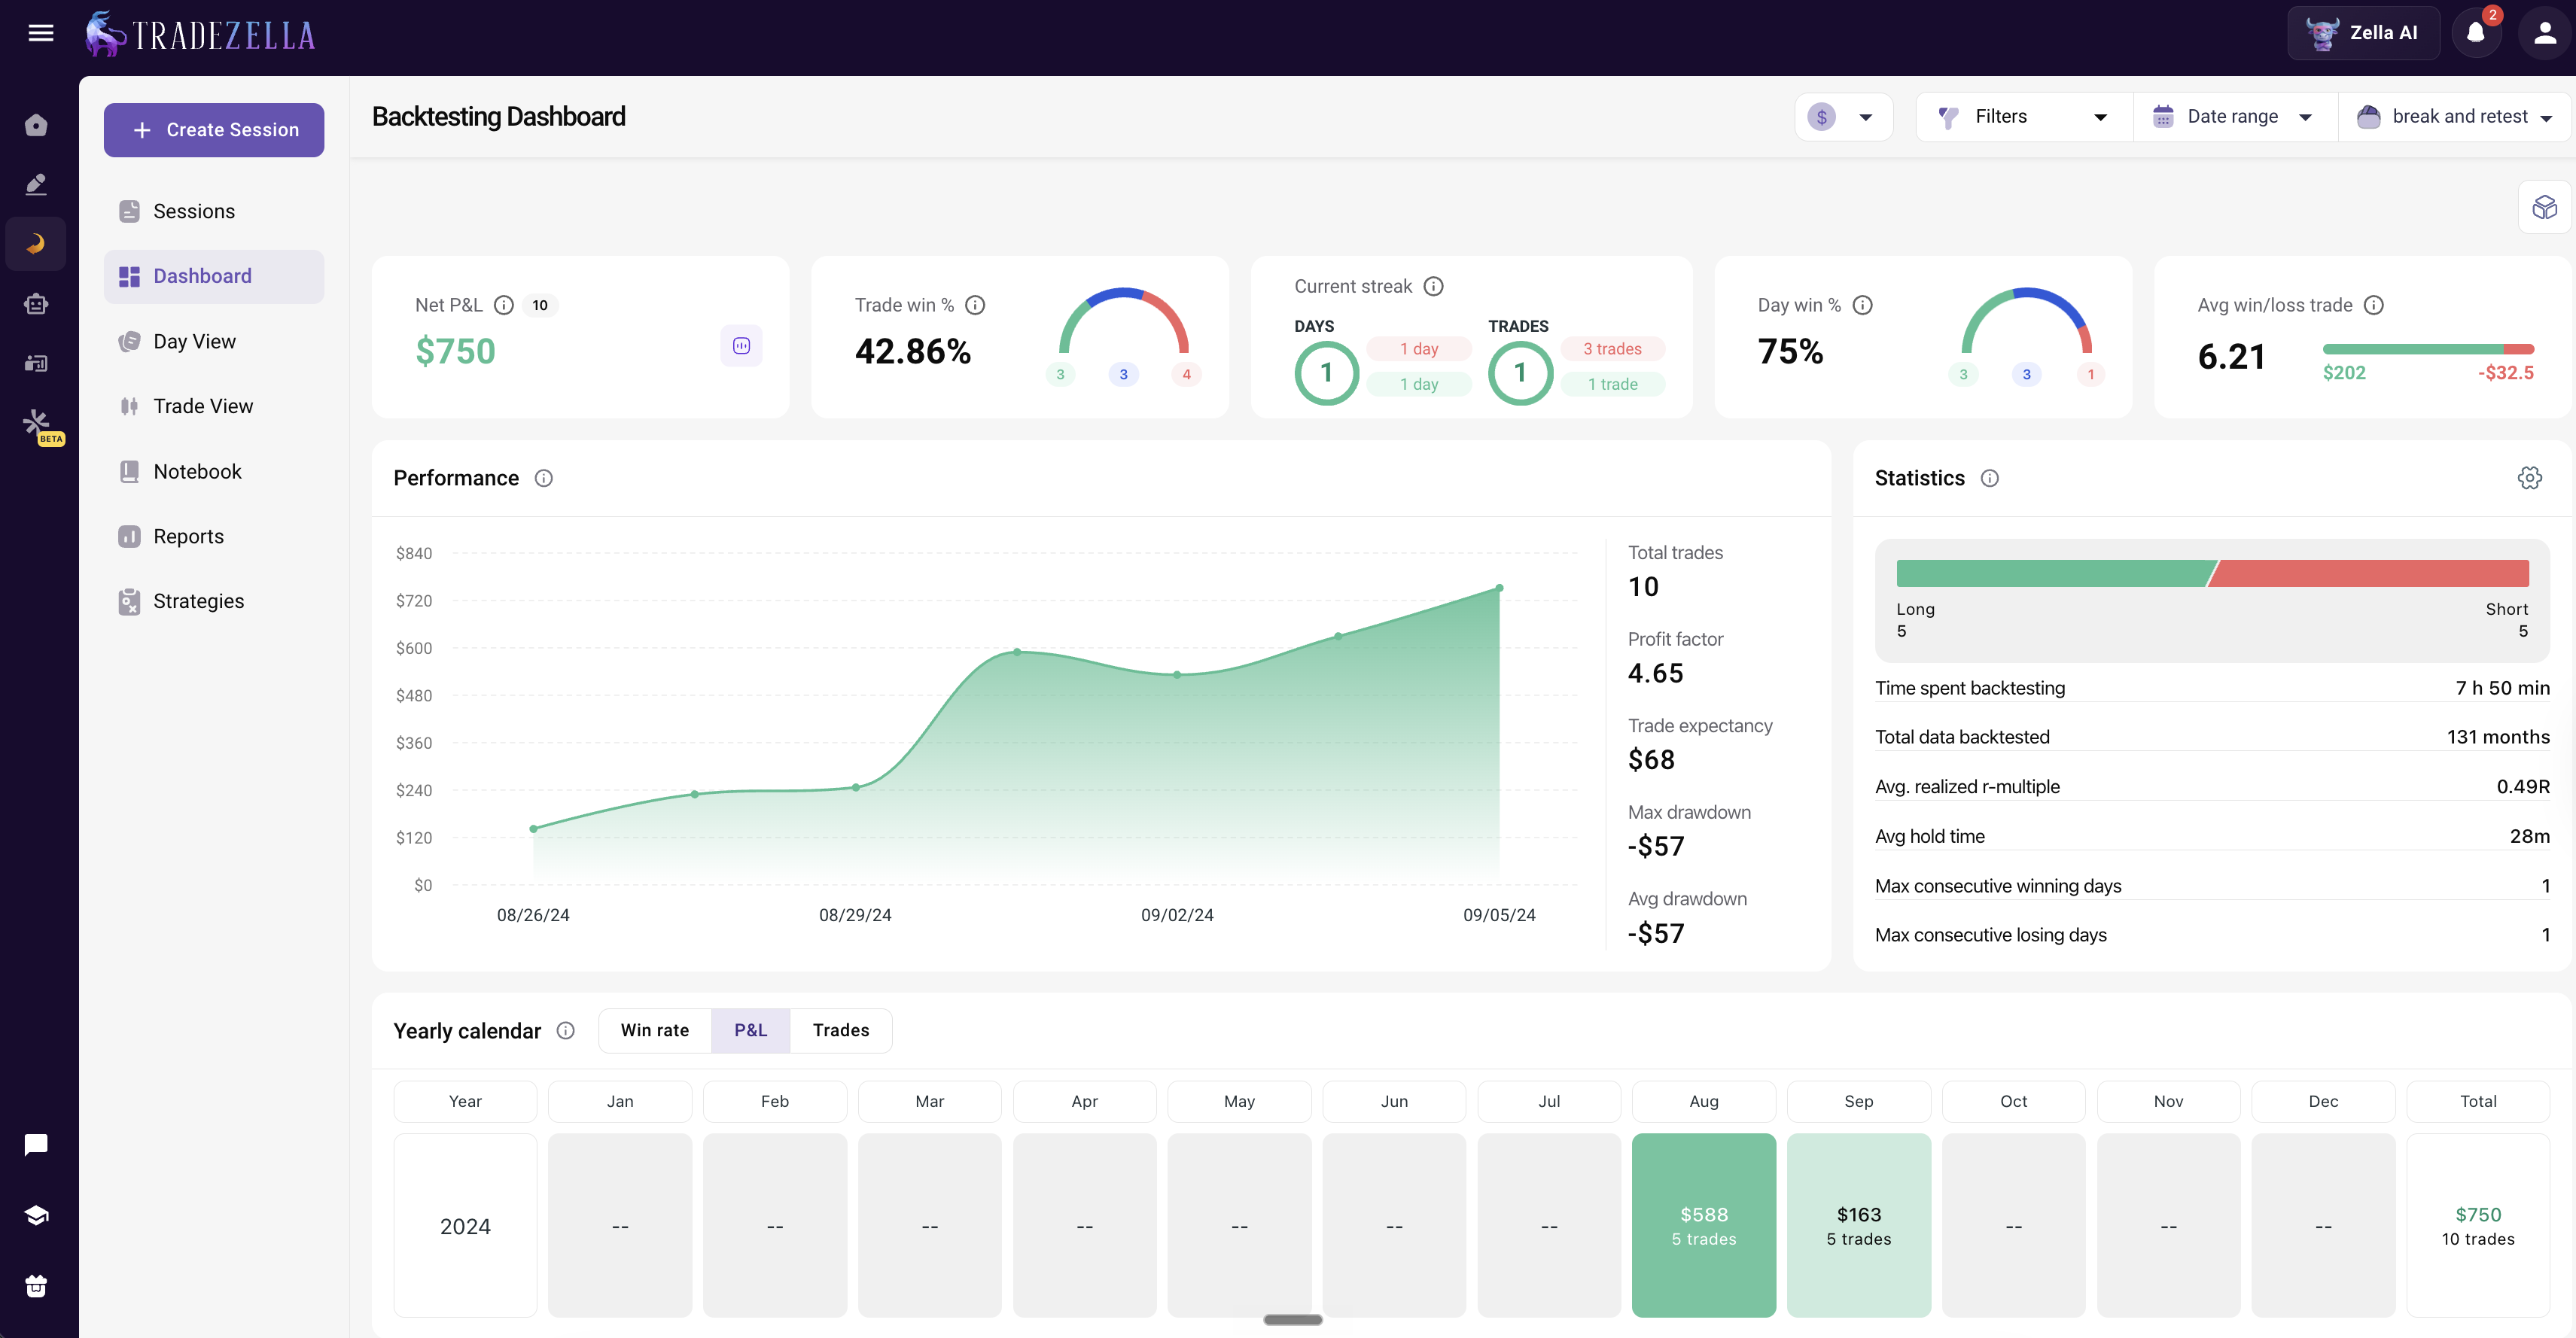
A Real Backtesting Example
Here is a concrete example of how a backtest plays out inside TradeZella. This is a break and retest strategy tested on MES (the Micro E-mini S&P 500 futures), replayed bar by bar across years of historical data. The rules were simple: wait for price to break a key level, wait for the retest, and enter only when the retest held, with a fixed stop and a target set at a multiple of the risk. Only trades that fit the rules exactly were taken.
After running the strategy through the backtester, the results were:
A 42.86% win rate looks unremarkable until you see the math behind it. Because the average winner ($202) is more than six times the average loser ($32.50), the strategy produces a 4.65 profit factor and a positive expectancy of $68 per trade, even though it loses slightly more often than it wins. The risk-reward ratio is what carries the edge.
Without backtesting, you would never see this. You could take a few losses in a row, assume the strategy was broken, and abandon it. The data shows that short losing streaks are normal at a sub-50% win rate and that the strategy still nets +$750 over the sample because the winners are so much larger than the losers. For the full math on how these metrics connect, see our guide on backtesting trading strategies.
What Metrics Should You Track When Backtesting?
Raw P&L is not enough. A strategy that made $5,000 in a backtest might have done it with one lucky trade and 20 losers. You need metrics that tell you whether the edge is real and repeatable.
Win rate: The percentage of trades that are profitable. On its own, win rate means nothing. A 30% win rate can be profitable if winners are large enough. A 70% win rate can lose money if losses are oversized. Win rate only matters in combination with average win/loss.
Profit factor: Gross profit divided by gross loss. Above 1.0 means the strategy is profitable. Above 1.3 is solid. Above 2.0 is excellent. Below 1.0 means the strategy loses money. This is the single most important number in a backtest.
Expectancy: The average dollar amount you expect to make (or lose) per trade. Positive expectancy means the strategy has an edge. Calculated as: (win rate x average win) minus (loss rate x average loss).
Maximum drawdown: The largest peak-to-trough decline during the backtest. A strategy with $10,000 profit but $8,000 max drawdown is riskier than one with $6,000 profit and $2,000 max drawdown. For more on managing drawdowns, see our drawdown management guide.
R-multiple: Each trade measured as a multiple of your initial risk. A trade where you risked $500 and made $1,000 is a +2R trade. A trade where you risked $500 and lost $500 is a -1R trade. Tracking in R-multiples normalizes your results regardless of position size.
Average win vs average loss: The ratio between how much you make on winners and how much you lose on losers. If your average win is $800 and average loss is $400, your reward-to-risk is 2:1, meaning you can be profitable even with a win rate below 50%.
Trade count: How many trades the strategy generated. A strategy with a 3.0 profit factor over 12 trades is not reliable. A strategy with a 1.4 profit factor over 150 trades is more trustworthy.
What Are the Most Common Backtesting Mistakes?
Most traders who backtest still lose money live. The gap between backtest results and live results comes from these mistakes:
Overfitting (curve fitting). This is the most common and most dangerous mistake. You optimize your rules to fit the specific price patterns in your backtest data. The backtest looks amazing, 70% win rate, 2.5 profit factor. But you have memorized the past instead of learning principles that work in the future. The more parameters you tweak to improve the backtest, the more likely you are overfitting. Simple rules with fewer conditions tend to generalize better than complex rules with 8 filters.
Not enough trades. A backtest with 15 or 20 trades is not a backtest. It is a guess. You need at least 50 trades to see whether a pattern is real. Ideally 100 or more. Small samples hide the truth. A coin flip can land heads 8 out of 10 times. That does not mean the coin is biased. It means 10 flips is not enough to know.
Ignoring slippage and commissions. Backtests often assume you get filled at the exact price you wanted. Live trading does not work that way. On a $50,000 account trading actively, slippage and commissions can cost $2,000 to $4,000 per month. A strategy that is profitable in a backtest might break even or lose money when realistic costs are added.
Forward bias (look-ahead bias). If you can see what happens next on the chart, you are not backtesting. You are cheating. Scrolling through a chart and saying "I would have bought here" is not a backtest because you already know the price went up. Real backtesting uses bar replay where you cannot see the future. This is the single biggest difference between useful backtesting and wasting time.
Cherry-picking time periods. Testing only in a trending market does not tell you what happens when the market chops. Testing only in 2024 does not tell you what happens in different conditions. A robust strategy works across multiple market regimes: trending, ranging, high volatility, low volatility. Test across at least 6 months to a year of data.
Changing rules mid-test. If you change your entry rules after 30 trades because the results are bad, you are no longer testing the original strategy. You are starting a new test. If you need to adjust, stop, document the change, and start a fresh backtest with the new rules from trade 1.
Not forward testing before going live. Backtesting shows you the past. Forward testing (paper trading or small-size live trading) shows you whether the strategy works in real time with real execution. Skip this step and you skip the most important validation. For more on the difference, see the section below.
Backtesting vs Forward Testing vs Paper Trading
These three terms are related but different. Understanding the difference prevents confusion and helps you build the right testing workflow.
Backtesting tests a strategy on historical data. You replay past price action and take trades as if you were trading live. The data is real but the trades are simulated. You already know the market outcome (but you do not look ahead). The purpose is to measure whether a strategy has an edge over a large sample of trades.
Forward testing tests a strategy in real time on live market data, but with a demo account or very small position sizes. The market is live. The fills are real (or simulated in real time). You follow the same rules from your backtest. The purpose is to validate that your backtest results hold up in actual market conditions with real execution, slippage, and emotions.
Paper trading is a broader term that overlaps with forward testing. It means placing simulated trades without real money. Some traders use "paper trading" and "forward testing" interchangeably. The key difference is intent: paper trading can be casual practice, while forward testing is a structured validation of a specific strategy with a clear sample size target (typically 20 to 30 trades).
The correct sequence is: backtest first (50 to 100+ trades) to find an edge, then forward test (20 to 30 trades) to validate the edge works live, then trade live at reduced size (25% to 50% of normal position), then scale to full size once live results are within 15 to 20% of backtest results. Skipping any step increases the chance of discovering problems with real money instead of simulated money.
Manual Backtesting vs Automated Backtesting
There are two ways to backtest. Both have value for different types of traders.
Manual backtesting means you replay historical data bar by bar and make trading decisions yourself. You watch the chart form, identify your setup, place the trade, manage the position, and record the result. This is what most retail traders do. It is slower (a 100-trade backtest might take 4 to 8 hours), but it builds screen time, pattern recognition, and the discipline of following rules under realistic conditions. Platforms like TradeZella are built for manual backtesting.
Automated backtesting means you write your strategy rules as code (Python, C#, Pine Script, or plain English on newer platforms), and an engine runs those rules across years of historical data in seconds. You get results instantly across thousands of trades. This is faster but requires either coding skills or a platform that translates natural language into rules. NinjaTrader requires C#. TradingView uses Pine Script. TradeZella has automated no-code backtesting where you describe your strategy rules in plain English, no coding, no scripts, and the engine parses your rules and runs them across years of historical data automatically. Every individual trade is visible with entry, exit, trade time, and P&L, and you can open any trade to see the setup the AI drew on the chart. Results include win rate, profit factor, trade count, average win/loss, monthly breakdown, and Zella AI analysis. Pre-built templates cover common setups like ICT concepts, FVG, liquidity sweeps, and opening range breakouts.
For discretionary traders who trade based on chart reading and market feel, manual backtesting is more valuable because it trains the skill. For systematic traders with strict rule-based strategies, automated backtesting is more efficient because it tests more data faster. Many traders do both: automated to scan for strategies that have potential, manual to refine execution and build intuition.
What Do You Need to Start Backtesting?
You need four things:
1. A written trading plan with specific rules. Entry criteria, exit criteria, stop loss placement, target placement, position sizing, and which markets and timeframes you trade. If you cannot write the rules on paper, you cannot backtest them. Vague strategies produce vague results.
2. A backtesting platform with historical data. You need a platform that replays historical data bar by bar so you cannot see what comes next. The platform should cover your market (forex, futures, stocks, crypto), have enough historical data (at least 1 to 2 years, ideally 5+), and support the timeframes you trade. For a comparison of platforms, see our best backtesting software guide and our FX Replay alternatives comparison.
3. A way to log and analyze your trades. Every backtested trade needs to be recorded with full details: entry, exit, P&L, R-multiple, setup type, tags, and notes. Some platforms auto-journal every trade during the backtest. Others require manual logging. The more detail you capture, the more useful the analysis after the backtest.
4. Patience for a large enough sample. Commit to at least 50 trades before drawing any conclusions. That might mean 2 to 4 weeks of daily backtesting sessions. Rush the process and you will make decisions based on noise instead of signal.
How TradeZella Backtesting Works
TradeZella Backtesting Interface
TradeZella is a backtesting platform that connects your backtest results to your live trading data in one dashboard. Here is what makes it different from other backtesting tools:
Replay with realistic execution. TradingView-powered charts with 11+ years of historical data across forex, futures, stocks, and crypto. Replay speeds from 0.5x to 10x. Seconds timeframes (1s to 30s) on the Pro plan with live candle printing where the candle forms exactly as it would in a real market. Go-To feature for jumping to specific dates or sessions. Sync timeframe replay that matches the replay speed to your chart timeframe. RTH/ETH toggle on all plans. Economic calendar showing news events on the chart during replay.
Order execution that mirrors live trading. Market, limit, and stop orders. Automatic position sizing based on risk percentage, so your dollar risk stays the same on every trade regardless of stop distance. Drag-and-drop SL/TP on the chart. Auto-breakeven configurable by price, R-multiple, or USD amount. Manual partials (25%, 50%, 75%, custom). Scale in/out for futures and stocks. Multiple profit targets. Quick buy/sell buttons. Built-in ICT indicators: Fair Value Gap (FVG), Asian Session Range, HTF Bias, Key Levels, and Power of 3.
Auto-journaling during the backtest. Every trade logs automatically with entry, exit, position size, P&L, and timestamps. Add unlimited custom tags (setup type, entry timeframe, market conditions, mistakes, emotions), check off Strategy rules per trade, rate confidence, and add screenshots. All during the session without leaving the chart. Zella AI Auto Trade Tagger applies tags automatically based on rules you define in plain English.
Analytics across backtested and live trades. Reports across 7 dashboard views (Dollars, Percentage, R-Multiple, Ticks, Pips, Points, Privacy). Performance by day of week, hour, trade duration, instrument, position size, and any custom tag combination. Strategy comparison report, advanced calendar, Zella Score, include/exclude filtering. The same reports work on backtested trades and live trades imported from 500+ brokers. Filter by "Backtest" vs "Live" on the same Strategy and see the gap between what your strategy should produce and what your live execution actually delivers.
Backtest-to-live comparison is the feature that turns backtesting from practice into measurable improvement. Your backtested Strategy and your live Strategy sit in the same platform. If your backtest shows a 1.6 profit factor and your live is 0.9, you know the problem is execution and emotions, not the strategy itself. No other backtesting platform connects these two data sets in the same analytics. For a step-by-step walkthrough, see how to backtest with TradeZella.
TradeZella also includes Trade Replay (review live trades second by second), Prop Firm Sync (track real prop firm evaluations and funded accounts), and Zella AI agents (Session Review, Market Sentiment Briefing, conversational AI with memory). TradeZella also offers automated no-code backtesting where you describe strategy rules in plain English and the engine runs them across years of data, plus scenario backtesting with pre-built strategy templates.
Key Takeaways
Backtesting is testing a trading strategy on historical data before risking real money. It replaces opinion with data by showing you exactly how your rules perform over a large sample of trades.
The process: define your rules, choose your market and timeframe, replay historical data, execute trades following your rules exactly, log every trade with details, collect at least 50 to 100 trades, then analyze the results.
Track profit factor (above 1.3 is solid), win rate, expectancy, max drawdown, R-multiple, and trade count. Profit factor is the single most important metric.
The most common mistakes are overfitting (optimizing rules to fit past data), not enough trades (under 50), ignoring slippage and commissions, forward bias (seeing the future on the chart), and changing rules mid-test.
The correct sequence is: backtest (50 to 100+ trades), forward test (20 to 30 trades on demo or small size), then go live at reduced size, then scale up.
Manual backtesting builds screen time and pattern recognition. Automated backtesting tests more data faster. Both have value depending on your trading style.
TradeZella connects backtesting to live trading in one platform. Your backtested Strategy and your live Strategy share the same analytics dashboard, so you can measure the gap between what the strategy should produce and what your execution actually delivers.
Backtesting means testing a trading strategy on historical market data to see how it would have performed. You replay past price action, take trades following your rules, and measure the results over many trades. It is like a flight simulator for traders. You practice with real data but without risking real money. The goal is to find out whether your strategy has a statistical edge before you put your account on the line.
What backtesting platform should you use in 2026?
The backtesting platform you should use in 2026 depends on how you trade, but for most traders TradeZella is the strongest all-around choice. It does both manual bar replay and automated, no-code backtesting in one platform, runs on more than 11 years of data across stocks, forex, futures, and crypto, auto-journals every trade, and connects your backtests to your live results in the same dashboard. TradingView, NinjaTrader, and MetaTrader are capable but lean on coding in Pine Script, C#, or MQL5 and do not connect to a trading journal. FX Replay is popular for manual forex replay but does not import live trades or offer automated backtesting. If you want no-code backtesting, every trade visible, AI analysis, and a journal in one place, TradeZella is the best pick for 2026.
How many trades do you need in a backtest?
At minimum 50 trades for a basic read on whether the strategy works. Ideally 100 or more for results you can trust. Under 30 trades, the data is too noisy to draw reliable conclusions. A coin flip can land heads 8 out of 10 times. That does not mean the coin is biased. It means 10 flips is not enough to know. The same applies to trading strategies.
Can you backtest without coding?
Yes. Manual backtesting platforms like TradeZella let you replay historical data bar by bar and take trades visually on the chart without writing any code. TradeZella also offers automated no-code backtesting where you describe your strategy rules in plain English and the engine runs them across years of data automatically.
What is the most important metric in a backtest?
Profit factor. It is calculated by dividing gross profit by gross loss. Above 1.0 means the strategy is profitable. Above 1.3 is solid. Above 2.0 is excellent. Below 1.0 means the strategy loses money. Profit factor accounts for both win rate and win/loss size in a single number, which is why it is more useful than win rate alone.
What is the difference between backtesting and paper trading?
Backtesting replays historical data. You trade past price action that has already happened, but you do not see the future while trading. Paper trading (or forward testing) trades live market data in real time with simulated money. Backtesting tells you if a strategy had an edge in the past. Forward testing tells you if it works in real time with live execution and emotions. The correct sequence is backtest first, then forward test, then live.
Why do backtest results not match live results?
The gap between backtest and live results usually comes from three things: slippage (live fills are not as clean as backtested fills), emotions (fear and greed cause you to deviate from your rules in live trading), and overfitting (the backtest was optimized to fit specific historical patterns that do not repeat). Tracking the gap between backtest and live performance on the same Strategy is how you identify which factor is costing you the most.
Is backtesting worth it for day traders?
Yes. Day traders benefit the most from backtesting because they take a high volume of trades. A swing trader who takes 4 trades per month needs months to reach 50 trades. A day trader who takes 3 to 5 trades per day can build a 100-trade sample in a few weeks. More data means more reliable results. Backtesting also builds screen time and pattern recognition, which are essential skills for day trading.